Search Results for: euthyroid sick syndrome

Jimmy Moore on the Perfect Health Retreat

Our May 2015 Perfect Health Retreat has just concluded. It was a rousing success: we had a great time, the program was better than ever, and we appear to have had excellent health outcomes.

But, thanks to a busy winter, I have barely begun to blog about the October 2014 retreat. I have many testimonials to share from October. One of them came from a celebrity guest: low-carb podcaster and author Jimmy Moore.

Why I invited Jimmy to the Retreat

Jimmy and I first met in person at the first PaleoFX (in 2011). There we had a long conversation about starches, and I encouraged him to try them. He seemed open to the idea and we agreed that he would do a “PHD” trial at some future time.

The years passed and we never did the trial, but at AHS 2014 we continued our conversation. Jimmy was more committed to a low-carb (now ketogenic) approach than ever, and I was more persuaded than ever (in part due to my friend Seth Roberts’ death; I’ll blog about that soon) that such a diet risked an early death from cardiovascular disease. I again encouraged Jimmy to try PHD and see if he felt better on it. Jimmy said that he didn’t feel he could give PHD a fair test on his own, because he didn’t fully understand it.

If you meet a man dying of thirst, you have an obligation to lead him to water; even if he has an irrational aversion to water, and you know he is unlikely to drink. Still, if you refuse to show him the water, you share the guilt for his suffering. If you show him the water and he refuses to drink, his suffering is his fault alone. In the same way, I felt an obligation to show Jimmy the way to a healthier diet, even if I knew it was unlikely he would drink from that pool. We weren’t quite sold out, so I invited Jimmy to do the PHD experiment for one week at our retreat. Jimmy and his wife Christine accepted the invitation.

Jimmy’s Praise of the Retreat

On the final day of the retreat, Jimmy generously recorded a video testimonial for us. After seeing the final edited video in January, Jimmy signed an authorization for us to use it. Here is the video:

For those who don’t like to watch videos, here are some quotes:

  • “We had such a great time”
  • “It was such an amazing time”
  • “The camaraderie among the attendees was better than I have seen with any other group”
  • “I enjoyed the food better than anything … It surprised me that it was not only tasty, delicious, and nourishing which I expected it all to be but I wasn’t quite as hungry as I thought I’d be eating more carbohydrates than I’m used to.”
  • “This setting is absolutely spectacular.”
  • “I’ve considered myself a pretty good exerciser … but you challenged me…. I learned quite a bit.”
  • “I was very pleased [with the science classes]…. I really hope you pack this place out … The circadian rhythm stuff dude that is the best stuff you’ve done … that has helped my sleep and helped me get back on track with that more than anything.”
  • “I actually was surprised [by how beneficial the health coaching was] … You provided information that no doctor ever has.”
  • “This would shock a lot of people but I would absolutely recommend the retreat because I think if you’re interested in your health, you deserve to know all the evidence…. I think you owe it to yourself to give PHD a chance, learn about it, see if it works for you, and give it a go.”
  • “Very glad I did it, and highly, highly recommend it for anyone else”

For those who are wondering, there was no quid pro quo between us. Jimmy had no obligation to give us a testimonial, and I’m grateful for his enthusiastic endorsement of the retreat.

Jimmy’s Recent Blog Post

Although they enjoyed their week at the retreat, it didn’t change their minds about their own diets. Jimmy and Christine told me when they left the retreat that it was clear PHD was bringing health benefits to many people, but they themselves, and many of their readers, were different and needed a lower-carb diet to be healthy.

Their conviction that eating moderate levels of carbs would harm their health came out in a blog post Jimmy published on May 2, the first day of our May 2015 retreat. “Paul Jaminet’s Perfect Health Retreat: The Good, The Bad, The Ugly” is a discussion of “my thoughts of the good, the bad, and the ugly about what this event was like for us.”

The important words here are “for us.” Those who only read headlines might obtain the impression that the retreat itself was “bad” or “ugly”; but in fact most of what Jimmy refers to as “bad” and “ugly” are statements about the biological reactions he and his wife had to eating carbs.

Although Jimmy may not have intended to denigrate the value the retreat brings to those who actually want to eat carbs, I feel that casual readers will interpret his post as a denigration of the retreat, so I’d like to correct the record. Also, I disagree with his interpretations of his experiences, and I think my commentary on the science may be helpful to many – even Jimmy, if he is open to it. So I’d like to respond in detail.

The “good” in his post repeated statements from his video testimonial above; so I’ll discuss only the “bad” and “ugly.”

The Bad #1 – Disorganized Schedule

This was his sole criticism of the retreat itself. Jimmy wrote:

There was a general schedule of waking up, attending a morning seminar, morning workout time, doing a kitchen class, eating lunch, afternoon free time, afternoon workout time, afternoon cooking class, evening meal, meditation class, and then sleep. But it would have been nice to have some semblance of a written schedule to at least know what we’re doing next…. This is easily resolved with a schedule.

We did in fact have a schedule, it was emailed to guests as part of a larger information packet in advance of the retreat and written on a whiteboard in our dining area. Jimmy himself took a picture of the whiteboard (from his Instagram):

Jimmy 01

In future retreats, the welcome kits that guests receive when they arrive will include a printed handout of the schedule, a map to help them find class locations, and a detailed description of the topic of each class, so that those who prefer to skip a class in favor of hot tub, pool, ocean, beach, or Internet browsing may know what they are missing.

For May this year, we revised the schedule, moving the start of science classes back from 9 am to 8:30 am and giving more time to movement and cooking classes. This helped prevent slippage of start and end times, something we experienced in October 2014.

It takes some experience to make everything move like clockwork. We’re getting there.

Overall, I think our organization deserves a great deal of credit. We delivered an ambitious program successfully. Our staff of 11 in October 2014, 13 in May 2015, was well coordinated. Many guests complimented us on what we had achieved. One October 2014 guest, CEO of a $100 million per year company who frequently stays in 5-star hotels, told us that he was very surprised by how well we had managed to deliver luxury hospitality rivaling the best he had experienced. (Credit where credit is due: We benefited from having David Spence, the principal of a luxury hospitality business, come as our guest to the May 2014 retreat and provide us with detailed advice on how to improve our hospitality. Susan Savery of Savery Services has been outstanding as our concierge.)

The Bad #2a – Christine was hungry

Jimmy writes:

[A]lthough we were told to eat at least two pounds of food per meal and as much as we wanted to satiety, Christine was constantly hungry throughout the retreat.

Although this experience is uncommon, it’s quite possible for this to occur.

A full plate of PHD food in PHD proportions weighs about 2 pounds and has about 900 calories. We serve two meals per day so “two pounds” per meal works out, including a glass of wine, to about 1900 calories per day. However, calorie needs vary based on body size, age, activity levels, and health considerations, so we don’t provide calorie or food weight guidance. Rather, our guidance is, “Eat as much as you want in the first days of the retreat. Then, as you get experience with intermittent fasting, calibrate your food intake during the feeding window so that you just begin to experience mild hunger at the end of the next day’s fast. ‘Mild hunger’ means that you notice it if your attention is unoccupied, but forget it if you give your attention to something else, such as exercise, an interesting conversation, or interesting work.”

For most guests, PHD food is highly satisfying from the first day of the retreat, and there is little to no hunger during the fast. For most others, there may be hunger during the fast for a few days, but by the end of the week, they feel satiated and begin eating less and having no hunger during the fast.

However, occasionally someone may remain hungry for a full week. Invariably this is someone who has been undereating either total calories or carbs before coming to the retreat. So far we have only seen this occur in women.

We had one such person in May, out of 27 guests. I would say that this phenomenon of week-long hunger affects no more than 3% of the people who come to our retreat.

Why does this happen? As we discuss in our book (Chapter 17), nutrient deficiencies drive appetite. A dearth of a key nutrient, such as carbohydrates, will drive appetite.

The exception to this is that, if a missing nutrient is chronically unavailable, hunger disappears. The brain does not want hunger to distract us from critical activity – the search for food. Thus, starvation itself is anorectic – it tamps down hunger.

However, once the starving person finds the food or nutrient she needs, the hunger returns, amplified. The brain acts as if the starving person, after a long trek through the desert, has found an oasis that may be only transiently available. Therefore, it makes the person ravenously hungry, to get her to eat as much as possible while food (or the missing nutrient) is available.

Ketogenic diets are generally carb-starved diets, and carbs are a critically important nutrient; so it is not surprising that ketogenic diets lead to exactly this pattern. Here is an animal study which measured hunger through serum levels of ghrelin, the “Hunger Hormone.” [1]

Rats were put on a ketogenic diet (KD) or chow diet (CH) for 8 weeks, then the ketogenic diet rats were switched to a chow diet. The ketogenic diet suppressed ghrelin a bit – consistent with tamped-down hunger – but when the ketogenic diet rats switched to a diet with carbs, ghrelin levels soared. At one week post-switch, ghrelin levels were more than double their levels on the ketogenic diet. Ghrelin levels dropped steadily with continued time on the chow diet, returning close to normal around 8 weeks post-switch.

Jimmy 02

What does this prove? It’s not that surprising that someone coming from a ketogenic diet might be hungry for the first week after adopting a higher-carb diet. It may take more than a week to improve carbohydrate status, reassure the brain that starvation is not imminent, and bring appetite back to normal.

Let me emphasize – such hunger is a rare occurrence at the retreat. People coming to the retreat from SAD diets are generally hunger-free throughout. People coming from low-carb or ketogenic diets typically see their hunger disappear in one to three days. In only two cases – Christine’s and one other – have we seen hunger persist for a full week.

The Bad #2b –Jimmy developed acne

Jimmy wrote:

I was surprisingly NOT hungry eating all of that (but I was pretty well fat-adapted and used to regular periods of extended intermittent fasting of 18-24 hours between meal on keto prior to the retreat). My issue was the sudden outbreak of acne all over my face that was not there before.

The video above was recorded at the end of the retreat, so you can clearly see the quality of Jimmy’s complexion. Judge for yourself whether acne is “all over [his] face.” I see one pimple on his face and one on his neck.

We have had 64 paying attendees at the retreat (15 in May 2014, 22 in October 2014, 27 in May 2015). As far as I know no one but Jimmy has developed pimples while at the retreat. I have a long history of severe acne and while it is far better than it was, I sometimes do develop pimples during the Boston winter. However, they quickly go away when I go to the retreat. So I don’t think the retreat is an acne-promoting environment – far from it.

On the rare occasions pimples do appear on PHD, they can usually be quickly cleared with some nutritional supplements and sunshine. Vitamin A, zinc, and pantothenic acid are typically the supplements most likely to eliminate pimples.

Why might Jimmy have gotten pimples at the retreat? My best guess is that it was a combination of (1) a depleted mucus layer in the gut caused by his carb-starved pre-retreat diet, (2) a sudden rise in his gut bacteria population at the retreat due to a suddenly increased carb and fiber intake, leading to (3) inflammation triggered by direct contact between gut bacteria and intestinal cells, coupled with (4) some nutrient deficiencies that made his skin sensitive to the inflammation.

I’ve blogged on how very low-carb diets can deplete the mucus layer of the gut (see “Dangers of Zero-Carb Diets, II: Mucus Deficiency and Gastrointestinal Cancers,” Nov 15, 2010). This happens because mucin-2, the primary constituent of mucus in the gut, is 80% carbohydrate, and when the body is carb-starved glucose is triaged for the benefit of the brain, starving other tissues like the gut.

The mucosal layer of the gut generally shields the gut and immune cells lining the digestive tract from direct contact with bacteria. The bacteria they do see are beneficial probiotic mucin-degrading microbes like Akkermansia. A good mucus layer assures an absence of inflammation and a non-permeable gut barrier.

However, when the mucosal layer is depleted, the cells lining our gut are exposed to direct contact to gut bacteria that feed on food. This is inflammatory and also tends to lead to a leaky gut barrier and endotoxemia (entry of bacterial cell wall components into the body). Here’s a picture, from [2]:

Antimicrobial peptides (AMPs), including defensins and cathelicidins, constitute an arsenal of innate regulators of paramount importance in the gut.

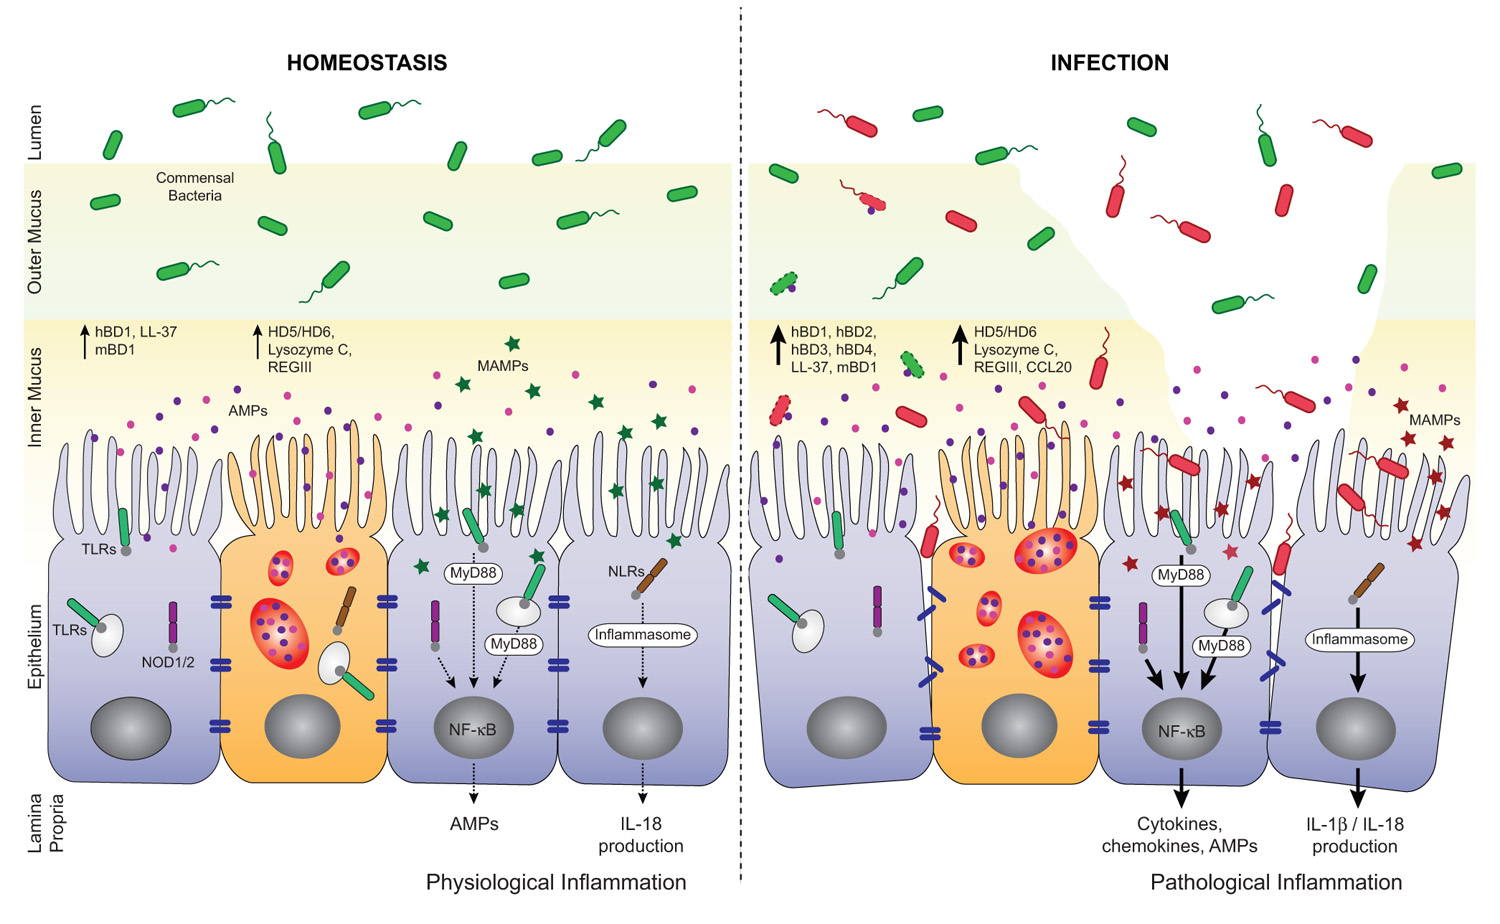
A depleted mucosal layer leads to inflammation and gut permeability.

My guess is that when Jimmy arrived at the retreat, he had a depleted mucosal layer of the gut, similar to the “INFECTION” side of the image above. However, on his very low carb diet, his gut bacterial population was low, so there wasn’t a lot of inflammation.

When he started eating carbs, his population of gut bacteria soared – bacteria can double their numbers in 20 minutes. It took a week or so to restore a normal mucosal layer. So he had a temporary period that was characterized by a relatively high level of inflammatory signaling coming from the gut.

As our guest Seppo Puusa wrote (“What Causes Acne? An Overview,” Feb 27, 2013), inflammation is the trigger for acne:

[M]ore than anything [acne] is an inflammatory problem. Many researchers now believe that inflammation in the skin is the trigger that kicks off the whole process. Studies have shown that inflammation is present in the very earliest stages of a pimple, even before P. Acnes bacteria colonizes the skin pore.

Antioxidant and immunomodulatory nutrients like vitamin A, zinc, and copper help to prevent pimple formation, while fat disposing nutrients like pantothenic acid help to prevent pore blockage. Jimmy was probably lacking in some of these nutrients, increasing the impact of the inflammation upon his complexion.

Of course this is just speculation, but the general picture is consistent with other aspects of Jimmy’s health. For example, his high LDL is suggestive of a leaky gut and endotoxemia, and recent lab tests indicate a number of nutrient deficiencies.

If I’m right, then Jimmy’s two pimples would have gone away in a little more time on PHD.

The Bad #3 – No info on ketogenic version of PHD

Jimmy wrote:

One thing I was especially looking forward to at the Perfect Health Retreat was learning more about the ketogenic version of Paul’s Perfect Health Diet. He has often noted that there are certain situations where ketones can play a therapeutic role in health–but there was nary a mention of ketosis at all in the hours upon hours of lectures…. [W]hy not share the information about how you recommend going keto for those who do need it?

When we did longer retreats – 30 days and 2 weeks – a discussion of ketogenic diets was part of the curriculum, but with a 1-week curriculum some content had to be dropped. We do health coaching pre-retreat, which allows us to identify any guests who would benefit from a ketogenic diet. So far no such person has come to the retreat. Since none of the guests would benefit from a ketogenic diet, there’s little reason to include it in the curriculum, when we have so much material of general interest.

(Interestingly, Paul would not allow me to give a guest lecture about ketosis as a bonus class for the attendees, but he did let me share a half-hour presentation on cholesterol based on my 2013 book Cholesterol Clarity).

With two days left in the retreat, Jimmy asked me if he could give a talk to the guests. I said sure; but it would have to be in the afternoon – the only free time in the schedule – and I wouldn’t be able to attend because that is when I do one-on-one health coaching. He said he could speak from either of his two books – Keto Clarity and Cholesterol Clarity – and asked which I would prefer. I said I would prefer he do the cholesterol talk, because many of our guests were not familiar with our differences of opinion, and might be confused to hear non-PHD diet recommendations being given with the apparent imprimatur of the retreat, and without me being present to clarify disagreements. Jimmy seemed fine with that at the time, delivered his cholesterol talk, and I heard it was well attended and well received.

I think it is misleading to summarize this conversation with the phrase “Paul would not allow me to lecture about ketosis.” Had I been able to be present and chime in to discuss points of difference, I would have been fine with Jimmy giving his ketogenic diet talk.

Jimmy also states that it is “unfortunate” anyone would think the ketogenic variant of PHD was as good as his no-starch, essentially carb-less diet. (Our ketogenic diet recommends including some starches to avert a deficiency of carbohydrate, fiber and medium-chain triglycerides as sources of ketogenic fatty acids, and a shift of protein toward ketogenic amino acids.) It’s no surprise that we differ on this point, since I think eating some carbs is desirable for everyone, while he thinks carbs are harmful in any dose.

The Ugly #1 – Jimmy Gained Weight

Jimmy wrote:

Many have wondered what would happen to my weight if I truly gave these “safe starches” a go in my diet. Like I said earlier, I told Paul we would do his plan as prescribed just to see what would happen. And the results on the scale were pretty shocking after eating this way for just one week–I gained a whopping 13 pounds!

Let me start my reply to this with a picture:

Jimmy weight 01

This picture was taken October 19, 2014, the day after Jimmy left the retreat. (Jimmy was at the retreat October 11-18.) You can see from the comments that Jimmy’s fans think he looks unusually good (“Woohoo! You’re killing it, Jimmy!” “lookin’ handsome Jimmy!! Great job!!” “Lookin’ spiffy!”).

Also note Jimmy’s last statement: he doesn’t know how his weight changed at the retreat. We keep no scales at the retreat, so it was impossible to measure his weight there; and his visit to the retreat was in the middle of a Keto Clarity book tour. He had a series of events in North Carolina following the retreat, and did not have an opportunity to measure his weight until his return home Tuesday, October 21. There must have been a minimum of 11 days between weight measurements, and possibly much longer. Any weight gain he could quantify did not occur in just one week.

If someone did gain 13 pounds in one week, I would expect his face to appear puffy. There is no sign of that in either this image or the video recorded the last day of the retreat.

I looked for a few other full-body images of Jimmy bracketing the retreat. Here is an image dated August 20, 2014 (pre-retreat) from an Asheville, NC Low-Carb meetup:

Jimmy weight 02

By eye, I would guess he was not lighter on August 20 than he was on October 19.

Soon after leaving the retreat, Jimmy undertook a long trip, first to San Francisco and then to Australia. Jet lag is a major circadian rhythm disruptor, and as I noted in my AHS talk on weight loss, circadian rhythm disruption is a major cause of obesity. So I wasn’t surprised that in photos from Australia, Jimmy looked heavier. Below is an image from a video of a talk Jimmy gave in Australia in November 2014 placed alongside the above image from October 19.

Jimmy weight 03

He looks significantly heavier in November. Immediately after the retreat, his suit jacket hangs straight down at the sides. In November, it bulges out sideways around the waistline.

I find it hard to reconcile this photographic evidence, plus my memory of what I saw in October, with Jimmy’s claim to have gained 13 pounds at the retreat.

Nor did Jimmy eat an inordinate amount of food while at the retreat. He went up for seconds at nearly every meal, but 1.5 to 2 plates per meal adds up to 3000-3500 calories per day, which should be roughly a weight maintenance intake for someone of Jimmy’s size (6’3”).

As my AHS talk on weight loss noted, we’ve had excellent results for weight loss at the retreats. Even in one week, we often see significant weight loss, even with ad libitum eating and wine consumption. For example, in May 2015, our two heaviest guests told me on departure that their pants had become loose and they were cinching their belts in one to two notches.

No guest at the retreats has gained significant weight. I think it would be difficult to do so, since we optimize so many of the weight loss factors.

I think Jimmy is mis-remembering when he gained his weight. He may have gained 13 pounds late last year, but it was probably during his cross-time-zone travels, not the week he spent at our retreat.

The Ugly #2 – Jimmy’s Blood Sugars Over 100

Jimmy wrote:

Measuring in a fasted state and then measuring postprandial at 30-minute intervals was not a pretty picture. I regularly saw spikes that jumped well above 140 after an hour which is a sign that your body is not tolerating the level of carbohydrates you just consumed. Of course, I was documenting all of this on social media and Paul decided to chime in about it with the following:

“I saw your blood glucose was 149 after lunch. That’s a normal reading, I actually thought it would be higher so I take that as a good sign. It takes a few days to a week to increase insulin sensitivity so it should be better by the end of the week, but even now it is in the normal range.”

I’m sorry, but 149 is NOT normal for me. My postprandial blood glucose readings typically NEVER go above 110-120 at the very most. Generally, the rise in blood sugar is about 20-25 points. But after every meal I consumed on the Perfect Health Retreat, the jump was more like 60-80 points. Not good at all. It took me a few weeks to get my blood sugar back down and under control again after the starchy meals ended. Promoting a starch-based diet to someone with significant insulin resistance is a recipe for disaster.

Jimmy was posting his blood glucose numbers on Instagram and so we have an enduring record.

Jimmy posted about two dozen blood glucose readings from his week at the retreat – I believe, nearly every reading he took – and only one was above 140 mg/dl. Jimmy has always been eager to show that he couldn’t tolerate starches, and if there were any other instances of a blood glucose reading above 140, Jimmy would have posted them to Instagram lickety-split. So I am confident that Jimmy is misremembering when he states, “I regularly saw spikes that jumped well above 140 after an hour.”

His postprandial glucose readings improved steadily throughout the retreat. I’ll just show his earliest and last reports, with links to Instagram:

  • The first two postprandial glucose readings Jimmy posted from the retreat were 127 mg/dl one hour after lunch on Sunday October 12, and 149 mg/dl after lunch on Monday October 13.
  • After lunch on Friday October 17, the last full day of the retreat, Jimmy’s 90 minute postprandial glucose was 87 mg/dl, and his 120 minute postprandial glucose was 100 mg/dl.
  • After our farewell dinner on the evening of Friday October 17, Jimmy recorded his blood glucose every 15 minutes. They were:

These numbers represent a dramatic improvement over the course of the week. Jimmy’s lowest reading on the first two days of the retreat was higher than his highest reading on the last day.

This improvement in insulin sensitivity was expected. Low-carb ketogenic diets are notorious for inducing insulin resistance, leading to high postprandial glucose when carbs are consumed.

This is one of the earliest reported side effects of a ketogenic diet. Recently Sarah Ballantyne and Denise Minger did a literature review on ketogenic diets and offered this image from a 1931 paper [3]:

Jimmy 04

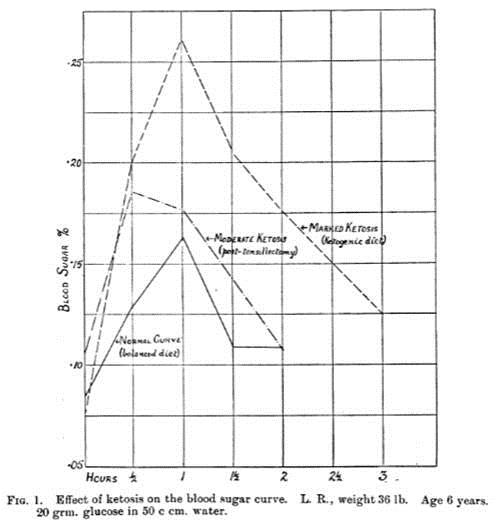
The deeper the ketosis, the higher blood glucose rises after a carb rich meal. A mere 20 grams of carbs (versus about 125 g in Jimmy’s retreat meals) caused a nearly 30% rise in blood glucose.

What is a “normal” postprandial glucose reading? Here is a view of postprandial blood glucose levels in healthy (HbA1c 5.4 or less) young people as measured by Professor JS Christiansen (from Ned Kock):

Jimmy 05

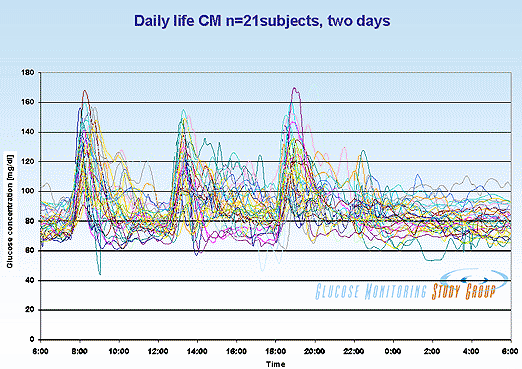
Although most postprandial glucose readings peak about 125 or so, a significant fraction of normal people experience postprandial readings of 149 or higher.

It is within that context that I told Jimmy that it was “normal” for him to have a postprandial reading in the range 127-149 on his first two days at the retreat (coming from a ketogenic diet), and normal to have postprandial readings in the range 97-126 after a week of carb consumption had improved insulin sensitivity.

At the retreat, I estimate that Jimmy was eating about 3000 calories per day, about 1/3 of them carbs; about 500 carb calories per meal and 1000 carb calories per day. It is gratifying to see that he is not diabetic, that a week of carb consumption restored his insulin sensitivity, and that he is fully capable of handling PHD levels of carbs.

More disturbing were Jimmy’s fasting glucose numbers. Jimmy posted these fasting glucose numbers: 130 mg/dl on Monday, 126 mg/dl on Wednesday, 133 mg/dl on Thursday, and 129 mg/dl on Friday. These are pathological numbers, and worse they showed no improvement during the week.

Jimmy’s fasting glucose numbers are lower on his ketogenic diet, but I do not find this pattern reassuring, for several reasons:

  • Jimmy’s numbers are changing for the worse. In his recent “Potpourri of Health Tests,” he reported his history of medical lab tests of fasting glucose: 80 on February 28, 2013; 85 on August 22, 2013; 91 on October 17, 2013; 94 on April 3, 2015; 100 on May 15, 2015.
  • Ketones substitute for blood glucose in feeding the brain, and it is the brain that controls blood glucose levels. So it is normal for blood glucose readings to be lower when in ketosis. However, what is important for health are total circulating energy levels (glucose + ketones + free fatty acids); elevated circulating energy poisons the pancreatic beta and alpha cells through “glucolipotoxicity.” [4] To be in ketosis, Jimmy has to have elevated levels of free fatty acids and ketones. So it is alarming that his fasting blood glucose levels while in ketosis are as high as 100 mg/dl.

Note that the loss of pancreatic alpha and beta cells, presumably due to poisoning by glucolipotoxicity, is an observed adverse effect of long-term ketogenic diets [e.g. 5, titled “Long-term ketogenic diet causes glucose intolerance and reduced β- and α-cell mass but no weight loss in mice”]. So possibly Jimmy’s elevated fasting levels of circulating energy substrates is a harbinger of the future development of diabetes.

UPDATE: Another explanation may be more likely. Apparently Jimmy was supplementing 50 mg melatonin. Melatonin is known to raise blood glucose levels in both evening and morning; just 5 mg of melatonin increased maximum night time plasma glucose by 27%. If this is the explanation, then Jimmy’s poor fasting glucose was a result of not following the Perfect Health Retreat program. We have specific supplementation recommendations and melatonin is not among them, except in rare cases where our RD may recommend a therapeutic supplement, in which case we recommend doses below 1 mg.

All this has come about due to Jimmy’s carb-phobia, but ironically Jimmy shows no metabolic signs of an intolerance of carbs. In a Facebook post on May 4, 2015, Jimmy prescribed a test for the healthfulness of “safe starches”:

Try eating a white potato to see how YOU do. Whether it’s truly safe for you will be determined by the impact it makes in your body, especially blood glucose. Measure at fasting (baseline), eat the potato, and then check at 30-minute intervals for at least two hours. At one hour, it should not go higher than 140. At two hours, you should be back close to your baseline. If either of these is awry, you might want to reevaluate your love for white potatoes.

By this test, by Friday at the retreat his “baseline” (fasting glucose) was 129, but eating about 500 calories of carbs in a PHD meal caused his blood glucose to drop postprandially to readings between 97 and 126 – all below his baseline. So white potatoes, if eaten as part of PHD meals, are “truly safe” for Jimmy by his own criterion.

The Ugly #3 – Dogmatic Approach

Jimmy wrote:

[O]ne of the ugliest parts of the Perfect Health Retreat to me was the completely dogmatic approach that it and it alone is the one and only true way to attain optimal health. There was no consideration given to any other means of getting there …

It is hard for me to fathom why it should be “ugly” for me to teach only advice I believe in, and not approaches that I don’t believe in, such as no-starch ketogenic diets.

I know of no health retreat that says, “We not only teach you the ways to achieve health that we believe in; we’ll also teach you the ways we don’t believe in.” I think guests would rightly respond, “Why should I spend time and money to hear you teach me things you believe are health-damaging? I’d rather you make a shorter, cheaper retreat and teach me only what you believe in.” I’m pretty sure Jimmy doesn’t teach the Ornish Diet on his Low Carb Cruises.

Our retreat makes a simple promise. It offers our best advice on how to be healthy. It covers every “ancestral” input to health — diet, nutrition, lifestyle, environment, movement / physical health — and some modern aspects, like understanding lab tests and managing doctors. There is neither time nor interest on my part (or the guests) for me to teach anything other than our best advice.

If someone wants to learn multiple approaches, they can come to our retreat to learn ours, and other events, like Jimmy’s Low Carb Cruise, to learn alternatives.

[Paul holds] staunch, dogmatic views on diet. While there is a lot of good in his plan, the abject close-mindedness to consider anything outside of what he has prescribed is truly unfortunate.

To borrow the Princess Bride line, I’m not sure “dogmatic” and “close-minded” mean what Jimmy thinks they mean.

First, I give evidence for all my recommendations – logical arguments and evidence for every assertion with citations to the literature. Guests at the retreat are given pdf copies of our slide decks, and each slide has its citations printed on it.

Second, I change my mind and update recommendations as I learn. When I first started Paleo I believed in a very low-carb approach, but when it led to health problems I changed my mind. Between the first edition of our book (2010) and the second (2012), a vast number of our recommendations changed — for example, the recommended macronutrient ratios changed from 20% carb 65% fat to 30% carb 55% fat, and nearly all the micronutrient recommendations were revised — based on research I’d done in the meantime, plus experiences of our readers. As an example of changing micronutrient suggestions, I toyed for several years with the possibility that high-dose iodine might be beneficial, before committing to a steady low dose (225 mcg per day) as a firm recommendation. The history of this blog is replete with explorations of issues to which I did not know the answer, and kept an open mind until sufficient evidence and experience gave a reliable answer.

If our dietary advice has recently been stable, it is because we have great confidence in it. We are hearing lots of success stories from people on PHD, essentially no negative outcomes, and new articles in the scientific literature continue to be supportive of our recommendations.

In contrast, I have not seen Jimmy change his mind about anything of substance, in spite of strong evidence which should have led to a reconsideration of his low-carb advice.

Recently, Tom Naughton changed his mind about starches (Safe Starches and The Perfect Health Diet, April 28, 2014):

I noticed more and more people saying they developed problems on a strict very-low-carb diet – low thyroid function, cold hands and feet, high fasting glucose, dry eyes, etc. – which went away when they added some “safe starches” back into their diets as prescribed in the Perfect Health Diet…. So I figured there had to be something to it…. Is the Perfect Health Diet truly the perfect diet?  I don’t know, but I was persuaded to move my own diet more in that direction.

We’ve gotten thousands of reader reports of health improvements after switching to PHD from low-carb. Tom and every other prominent person in the ancestral community must have seen hundreds – Jimmy too. And every prominent ancestral leader (unless you count Loren Cordain as a leader) has responded to these experiences by endorsing starches and carbs to some degree. But Jimmy remains as anti-carb as ever.

As his low-carb ketogenic experiment winds on, Jimmy and Christine seem to be developing more of the “Zero Carb Dangers” that I blogged about in 2010-11. For example:

Experience shows that there is no amount of evidence that can persuade Jimmy that he is eating too few carbs. Is not his opposition to carb consumption dogmatic?

Summary of the Health Effects of the Retreat on Jimmy

Jimmy’s post suggests that I have overlooked another zero-carb danger: memory loss. After spending the last seven months on an almost carb-free ketogenic diet, Jimmy has forgotten:

  • Most of the good aspects of the retreat.
  • That his 2014 weight gain occurred after the retreat ended, not during it.
  • That his acne at the retreat consisted of one facial pimple, not pimples “all over his face.”
  • That his blood glucose went over 140 mg/dl once, not regularly.
  • That a week at the retreat made him more insulin sensitive and made eating potatoes and rice “truly safe” for him by his own definition.

In truth, I think the retreat benefited Jimmy’s health. He probably left at his lowest weight, best insulin sensitivity, lowest blood pressure, and lowest LDL cholesterol of the last year. And he left in a joyful, generous mood. Thank you, Jimmy, for your video testimonial.

If his recent blog post about the retreat was less generous, well, I would take that as another indicator that his health has been worsening. Poor health can make one cranky and uncharitable.

More on Jimmy’s Situation

Earlier this week Jimmy posted a comprehensive set of medical labs (“Potpourri of Health Tests,” May 16, 2015). He had a host of abnormal numbers. Follow the link and look at all the red and yellow results.

In interpreting these test results, I think it should be recognized that the various individual issues – such as the iron deficiency anemia, the high anion gap metabolic acidosis, the “euthyroid sick syndrome” pattern of low T3 thyroid hormone (see my post “Carbohydrates and the Thyroid,” Aug 24, 2011), and the low cortisol with a disrupted circadian pattern – are probably reflections of deeper problems caused by malnutrition (starvation of carbs, protein, and assorted micronutrients) despite excess fat intake (a source of metabolic stress). Jimmy is posing metabolic stresses to his body that it is incapable of managing. As a result, his body is failing to perform basic functions like maintaining the circadian rhythm of cortisol or the normal pH (slightly alkaline) of blood.

I hope Jimmy will recognize that his labs (dyslipidemia, glucolipotoxicity, high anion gap metabolic acidosis) suggest that his low-carb ketogenic diet may be putting him at risk of cardiovascular disease, diabetes, and kidney disease.

I like Jimmy and consider him a friend, so I hope he recognizes that this post, and my earlier invitation to our retreat, have been friendly interventions intended to help him.

References

[1] Honors MA, Davenport BM, Kinzig KP. Effects of consuming a high carbohydrate diet after eight weeks of exposure to a ketogenic diet. Nutr Metab (Lond). 2009 Nov 19;6:46. http://pmid.us/19925676.

[2] Muniz LR, Knosp C, Yeretssian G. Intestinal antimicrobial peptides during homeostasis, infection, and disease. Front Immunol. 2012 Oct 9;3:310. http://pmid.us/23087688.

[3] Ellis RW. Some Effects of a Ketogenic Diet. Arch Dis Child. 1931 Oct;6(35):285-92. http://pmid.us/21031858/.

[4] Srinivasan VA, Raghavan VA, Parthasarathy S. Biochemical basis and clinical consequences of glucolipotoxicity: a primer. Heart Fail Clin. 2012 Oct;8(4):501-11. http://pmid.us/22999235.

[5] Ellenbroek JH, van Dijck L, Töns HA, Rabelink TJ, Carlotti F, Ballieux BE, de Koning EJ. Long-term ketogenic diet causes glucose intolerance and reduced β- and α-cell mass but no weight loss in mice. Am J Physiol Endocrinol Metab. 2014 Mar 1;306(5):E552-8. http://pmid.us/24398402.


Very Low-Carb Dieting: Are the Hormonal Changes Risk-free?

I was in Chicago earlier this week to record a video discussion with Dr Ron Rosedale hosted by Dr Mercola. Ron and I have taken opposite sides in several “safe starch debates” (First installment here; reply to Ron here; Ancestral Health Symposium panel discussed here.) This new discussion was intended to be more cordial and uncover common ground as well as differences.

I was intrigued to see that Ron’s lunch consisted mostly of plant foods which he ate avidly; he said he believes that most people on his diet eat a significant amount of plant foods. I came away with the impression that the Rosedale Diet resembles the ketogenic version of PHD, only with less starch and MCT oil.

One of my objections to Ron’s recommendations has been that very low carb and protein consumption can be stressful to the body. Scarcity of carbs and protein invokes certain starvation-associated pathways – for instance, lower T3 thyroid hormone. We discussed this in “Carbohydrates and the Thyroid,” August 24, 2011.

Ron believes that low T3 on low-carb diets is healthy, and other low-carb advocates, such as Sam Knox, have made similar arguments.

I believe that intermittent fasting, which invokes starvation-associated pathways transiently, is usually health-improving – but that you can overdo it. What happens if you invoke these pathways chronically and continuously?

Prof Dr Andro on the “Athlete Triad”

Some light was shed on this question recently by Adel Moussa, aka Prof Dr Andro, who discussed the “athlete triad” in three posts (Part I, Part II, Part III) at his blog Suppversity.

The athlete triad appears most commonly in athletes who undereat and overtrain. Symptoms include low energy, amenorrhea in women and low testosterone in men, osteoporosis, reduced cognitive ability, and impaired immune function. The syndrome is surprisingly common, especially in female athletes:

Although the exact prevalence of the female athlete triad is unknown, studies have reported disordered eating behavior in 15 to 62 percent of female college athletes. Amenorrhea occurs in 3.4 to 66 percent of female athletes, compared with only 2 to 5 percent of women in the general population. [1]

As Adel discusses in Part II, the athlete triad is characterized by the following hormonal pattern:

  • low estrogen and testosterone levels
  • low T4 and low T3 thyroid hormone levels, often with low TSH and high reverse T3
  • a disturbed circadian cortisol rhythm lacking an appropriate cortisol spike in the morning and a normal decline in cortisol levels in the course of the day
  • low leptin, low insulin, and low IGF-1

Precisely the same hormonal patterns, including lower thyroid hormone levels, higher cortisol, and a suppressed circadian cortisol rhythm, are observed in total fasting and starvation. [2] [3]

These hormonal changes conserve glucose and protein, an appropriate step during starvation. The energy-intensive tasks of immune function and reproduction are temporarily suppressed until energy is more readily available.

Similar patterns of reduced T3 and elevated cortisol excretion were recently seen in a clinical trial of a 10% carb weight maintainance diet. [4] This trial shows that even in the absence of calorie restriction, carb restriction is sufficient to reproduce much of the “athlete triad”/starvation hormonal pattern.

This pattern reaches its most extreme form in anorexia:

[H]ypocaloric diets causes changes in thyroid function that resemble sick euthyroid syndrome. Changes consist of a decrease in total T4 and total and free T3 with a corresponding increase in rT3….

States of chronic starvation such as seen in anorexia nervosa are also associated with changes in thyroid hormone, GH, and cortisol secretion. There is a decrease in total and free T4 and T3, and an increase in rT3 similar to findings in sick euthyroid syndrome…. [T]here is an increase in GH secretion with a decrease in IGF-1 levels…. The changes in cortisol secretion in patients with anorexia nervosa resemble depression. They present with increased urinary free cortisol and serum cortisol levels. [5]

In chronic starvation, hunger is replaced by anxiety and a desire to move. In evolutionary context this urge to be active may have stimulated food-seeking, but in modern life it can exacerbate conditions like the athlete’s triad.

In Part II of his series, Adel made an interesting observation. Chris Kresser often mentions a patient who cured his health problems with pizza and beer. Here’s Chris recounting the story to Kurt Harris:

Chris Kresser: Back around 2000, I was interning for a holistic doctor down in San Diego, and this was before I got into Paleo or anything, and I was, I think, a vegan macrobiotic, for crying out loud, at that point!  So, we had a patient who was just really, really sick, and he was just getting sicker and sicker.  He weighed about 90 pounds.  I think he was about 6 feet tall.  And the doctor had him on a restricted diet, you know, one of those food allergy type of diets where all you’re eating is, like, broccoli, venison, and quinoa.

Kurt Harris:  The Specific Carbohydrate Diet?

Chris Kresser:  No, no, just like a really, you know, they do the IgG food testing, which is kinda bunk anyways.

Kurt Harris:  Yeah, that’s pretty bunk.

Chris Kresser:  And then they find out you can only eat strawberries, broccoli, quinoa, and ostrich!  You know?  And so, he was doing that, and he kept removing foods until he was literally down to, like, broccoli and steamed whitefish or something.  That was all he was eating.  And he just kept getting sicker and sicker.  So, he disappears for about six months, comes back a completely different person.  He’s back up to 160 or 170, which was his normal weight, you know, completely normal complexion.  Literally, we didn’t even recognize him, and the doctor was saying:  What happened?  Was it diet?  And the guy was like:  Yep, it was diet.  And he said:  Was it the candida diet?  Was it the Specific Carbohydrate?  What was it?  And he said:  It was the beer and pizza diet!  [laughter]  And this guy literally, I mean, the guy got to this point where he was like:  OK, if this is my life, I’m fine with just flaring out.  You know, this isn’t worth it.  And if I’m gonna go out, I’m gonna have fun.  And so, he started going out.  You know, he wasn’t ever hanging out with his friends anymore because he was on such a restricted diet, he had no social life, so he just said: Forget it.  I’m gonna drink beer and eat pizza at least three times a week, and then the other times I’m gonna do whatever I want.  And that completely restored his health.

Adel speculates (very plausibly in light of the man’s weight of 90 pounds!) that the patient was suffering from the starvation pattern which is replicated in very low-carb “euthyroid sick syndrome” and the athlete triad. What he needed was more calories, especially carb and protein calories. Pizza and beer are great sources!

Conclusion

It was a pleasure to chat with Ron and Dr Mercola in Chicago. We recorded a four hour discussion, which is going to be edited down to an hour or hour and a half.

We found plenty of common ground. We agreed that there are very real health benefits to low-carbohydrate diets. Low-carb diets are helpful against diabetes and metabolic syndrome, and quickly improve cardiovascular risk markers such as blood pressure, triglycerides, and HDL.

But in biology, good things can always be taken too far. One can restrict carbohydrates (and protein) too much. Extremism in carb restriction may, indeed, be a vice.

References

[1] Hobart J, Smucker D. The female athlete triad. Am Fam Physician. 2000 Jun 1;61(11):3357-64, 3367. http://pmid.us/10865930.

[2] Shimizu H et al. Altered hormonal status in a female deprived of food for 18 days. J Med. 1991;22(3):201-10. http://pmid.us/1770328.

[3] Palmblad J et al. Effects of total energy withdrawal (fasting) on the levels of growth hormone, thyrotropin, cortisol, adrenaline, noradrenaline, T4, T3, and rT3 in healthy males. Acta Med Scand. 1977 Jan;201(1-2):15-22. http://pmid.us/835366.

[4] Ebbeling CB et al. Effects of dietary composition on energy expenditure during weight-loss maintenance. JAMA. 2012 Jun 27;307(24):2627-34. http://pmid.us/22735432.

[5] Douyon L, Schteingart DE. Effect of obesity and starvation on thyroid hormone, growth hormone, and cortisol secretion. Endocrinol Metab Clin North Am. 2002 Mar;31(1):173-89. http://pmid.us/12055988.

2011 in Review: Top Posts

It’s been a great year for us, full of fun and learning. In this last post of 2011 I’ll review the year’s most interesting posts. Early next week, I’ll add a few more thoughts about 2011 and preview our plans for 2012.

But first let me give a shout out to Stabby Raccoon’s “Guide to Binge Drinking,” at the new group blog “Highbrow Paleo.” If you plan to drink alcohol on New Year’s Eve, either for pleasure or to raise your HDL, you might want to look up Stabby’s advice.

The Puzzle of High LDL on Paleo

One of the more interesting puzzles we delved into this year was the problem of high LDL on Paleo.

Reader Larry Eshelman had this problem, and gathered a large number of examples of low-carb Paleo dieters with high LDL: Low Carb Paleo, and LDL is Soaring – Help!, Mar 2, 2011. We suggested a possible remedy – repairing deficiencies in micronutrients known to be crucial to vascular function – in Answer Day: What Causes High LDL on Low-Carb Paleo?, Mar 3, 2011.

That remedy worked for Larry, and we’ll do an update on his case soon. But it wasn’t the whole story, and later in the year we looked at another cause of high LDL on Paleo – low thyroid hormone levels – in High LDL on Paleo Revisited: Low Carb & the Thyroid, Sep 1, 2011. Going too low-carb causes a reduction in T3 thyroid hormone levels, which leads to inactivation of LDL receptors and potentially large increases in LDL levels. Gregory Barton shared his case history.

Blood Lipids as Diagnostic Tools

We were also led to think about blood lipids because lipoproteins are immune molecules of considerable importance in fighting infectious diseases. We talked about the immune functions of HDL in HDL and Immunity, Apr 12, 2011, and HDL: Higher is Good, But is Highest Best?, Apr 14, 2011. We talked about the immune functions of LDL, VLDL, and Lp(a) in Blood Lipids and Infectious Disease, Part II, Jul 12, 2011.

With help from blogger O Primitivo, we looked at what serum lipid levels optimize health in Blood Lipids and Infectious Disease, Part I, Jun 21, 2011. It’s higher than most think: TC between about 200 and 240 mg/dl is optimal.

We discussed ways to improve immune function by raising HDL in How to Raise HDL, Apr 20, 2011.

Don Matesz objected that newborns have very low serum cholesterol, so we looked at Low Serum Cholesterol in Newborn Babies, Jul 14, 2011. Breast-fed babies achieve normal serum cholesterol of about 200 mg/dl at age six months, which is also when their immune function normalizes.

Another objection was based on the claim by Paleo pioneers Boyd Eaton and Loren Cordain that hunter-gatherers had low serum cholesterol. That led us to a number of posts: Did Hunter-Gatherers Have Low Serum Cholesterol?, Jun 28, 2011; Serum Cholesterol Among the Eskimos and Inuit, Jul 1, 2011; Serum Cholesterol Among African Hunter-Gatherers, Jul 5, 2011; Serum Cholesterol Among Hunter-Gatherers: Conclusion, Jul 7, 2011. The upshot: healthy hunter-gatherers had normal serum cholesterol, with TC usually over 200 mg/dl. The cases of low serum cholesterol were either in stale samples collected from remote sites in the 1930s to 1950s without use of refrigeration and delays of weeks to months in measurement, or from hunter-gatherers with high rates of infectious disease from parasitic protozoa or worms.

This literature survey led us to the belief that there are really only two common causes for low total serum cholesterol (not counting statin consumption): eating a lipid deficient diet, such as a macrobiotic diet; or having an infection with a eukaryotic pathogen.

This means that anyone eating a high-fat diet who has low serum cholesterol should get checked out for eukaryotic infections, probably protozoa or worms. We’ve encouraged half a dozen people or so to do this.

Brendan is a great example. He first left a comment in May asking for advice:

I have rosacea, puffiness in my cheeks, post-nasal drip, frequent headaches, severe constipation (IBS), hypothyroidism, extremely low cholesterol, and a variety of neuropsychiatric symptoms (depression, anxiety, insomnia, and cognitive and motor problems).

“Extremely low cholesterol” is the tell-tale clue. He reported back in December: he did indeed have whipworm and entamoeba infections, and is now seeking treatment.

I like this story because it is a great example of what we’re trying to achieve on this blog. Diet, nutrition, and infections interact to product one’s health; we want to understand how to troubleshoot any problems. I’m excited that blood lipids are turning out to be good diagnostic markers for certain types of infection that are often overlooked.

The Challenge of Obesity

Our diet was designed to help people become healthy; it was not designed as a weight loss diet. Nevertheless, Shou-Ching and I were well aware of the failure of most weight loss diets to cure obesity – rather they tend to produce temporary weight loss followed by yo-yo weight regain – and we strongly suspected that a diet designed for general health might be the best strategy for long-term weight loss. So entering 2011, we were very curious how our diet would work for people trying to lose weight.

From Atkins to the Dukan Diet, recently embraced by Kate Middleton, popular diet books generally recommend high protein consumption, which seems to be very effective at promoting short-term weight loss. A few posts explored the place of protein in a weight loss diet, and whether there are alternatives to high protein: Protein, Satiety, and Body Composition, Jan 25, 2011; Low-Protein Leanness, Melanesians, and Hara Hachi Bu, Jan 27, 2011.

A few people who transitioned to our diet from very low-carb diets noticed an immediate gain of 3 to 5 pounds. This caused us to look into the issue of water weight: Water Weight: Does It Change When Changing Diets? Does It Matter?, Jan 14, 2011.

We also did a bit to link obesity to our favorite causes of disease – malnutrition, toxins, and infections – in Why We Get Fat: Food Toxins, Jan 20, 2011. Another post along this line was Obesity: Often An Infectious Disease, Sep 20, 2010.

Losing weight is especially hard for post-menopausal women, especially if they can’t exercise. Calorie needs may be as low as 1500 calories per day, making it hard to be well nourished on a calorie-restricted diet. The case of erp, a 76-year-old women with bad knees who needed to lose weight for knee replacement surgery, led us to clarify where the calories should come from when few can be eaten: Perfect Health Diet: Weight Loss Version, Feb 1, 2011.

We were happy that erp did indeed lose weight, dropping from size 16 to size 6. Another impressive case of weight loss was recorded by Jay Wright, who started our diet in March at 250 pounds and reached his goal weight of 170 pounds in October. Jay generously shared his story: Jay Wright’s Weight Loss Journey, Dec 1, 2011.

Stephan Guyenet, one of the finest diet and nutrition bloggers, introduced us to “food reward” and to the role in obesity of the brain modules that manage appetite and energy homeostasis. He had a back-and-forth with Gary Taubes over their differing views. I chimed in on a few occasions, notably in Gary Taubes and Stephan Guyenet: Three Views on Obesity, Aug 11, 2011, and Thoughts on Obesity Inspired by Stephan, Jun 2, 2011.

The Guyenet-Taubes debate gave me an opportunity to present a figure from a classic study by Maria Rupnick and colleagues. Giving or withholding an angiogenesis inhibitor causes ob/ob (obesity prone) mice to cycle between obese and normal weight:

It is hard to see how either a brain-centric view or a carb-and-insulin-centric view can account for this. I see this data as testimony to the complexity of biology.

I’m going to be developing my own theory of obesity in 2012; I previewed this theory in my talk at CrossFit NYC on November 19. One element was the subject of a 2011 post: How Does a Cell Avoid Obesity?, Jan 18, 2011. Leptin resistance and insulin resistance – two of the hallmarks of obesity – are symptoms of the disease of obesity, not its cause.

Therapeutic Ketogenic Diets

Ketogenic diets are potentially highly beneficial to neurological function, and are an under-utilized therapy for neurological conditions.

One reason they’re under-utilized is that clinical ketogenic diets have been poorly designed and malnourishing. We discussed how to make a diet ketogenic while minimizing health risks in Ketogenic Diets, I: Ways to Make a Diet Ketogenic, Feb 24, 2011, and Ketogenic Diets 2: Preventing Muscle and Bone Loss on Ketogenic Diets, Mar 10, 2011.

But the goal is to demonstrate that ketogenic diets can be therapeutic for various conditions. We had several great stories from people trying our version of the ketogenic diet.

Kate was able to relieve migraines and anxiety: A Cure for Migraines?:, Mar 29, 2011.

In a poignant story, we learned about a genetic disorder called NBIA (Neurodegeneration with Brain Iron Accumulation). Children with this disorder develop extremely painful muscle spasms and are usually in agony from around age 6, before dying in their teens. It turns out that a ketogenic diet effectively prevents the spasms and pain. Two parents of NBIA children shared photos of their kids in Ketogenic Diet for NBIA (Neurodegeneration with Brain Iron Accumulation), Feb 22, 2011. From being in constant pain, the boys had gone to “smiling and laughing all the time”:

Hypothyroidism

Thanks to our resident expert on hypothyroidism, Mario Renato Iwakura, we had a number of excellent discussions of how to optimize diet and nutrition for hypothyroidism.

First, Mario defended our support of selenium and iodine supplementation in cases of hypothyroidism, including Hashimoto’s autoimmune hypothyroidism, with a thorough review of the literature: see Iodine and Hashimoto’s Thyroiditis, Part I, May 24, 2011, and Iodine and Hashimoto’s Thyroiditis, Part 2, May 26, 2011. It is crucial to get selenium in the range 200 to 400 mcg per day, and to avoid an iodine deficiency. With optimal selenium, a wide range of iodine intakes are healthy, including quite high iodine intakes.

Later in the year, readers asked us to address claims by Anthony Colpo that low-carb diets would lead to “euthyroid sick syndrome,” a condition of low T3 thyroid hormone. We found support for that idea, but only for “very low-carb” diets, ie those with carbs below 200 calories per day (more in athletes or those with inadequate protein intake). Thyroid problems were also exacerbated when omega-6 fat intake was high. A literature search was unable to find instances of thyroid problems on low omega-6 and adequate carb diets. The main posts: Low Carb High Fat Diets and the Thyroid, Aug 18, 2011; Carbohydrates and the Thyroid, Aug 24, 2011; Mario Replies: Low Carb Diets and the Thyroid, II, Aug 30, 2011.

This was a useful discussion, as it led us back to the problem of high LDL on Paleo due to low T3 thyroid hormone levels caused by very low carb consumption.

The Place of Starches in a Paleo Diet

Given that some carbs should be eaten, what form should they take? There are two main food types of carbohydrate, sugars and starches.

I was surprised by the vehement opposition to starch consumption displayed by many low-carb advocates polled by Jimmy Moore in October. Most low-carb diets support the eating of sugary fruits and vegetables, and I would have thought that opposition to starches would be no greater than opposition to sugars. How wrong I was!

My original reply to the many low-carb gurus polled by Jimmy can be found here: Jimmy Moore’s seminar on “safe starches”: My reply, Oct 12, 2011. A week later I added a discussion of why the glycemic index or starches doesn’t matter when they are eaten the way we advise eating them: How to Minimize Hyperglycemic Toxicity, Oct 20, 2011. Dr Ron Rosedale enthusiastically continued the conversation, and I replied to Ron: Safe Starches Symposium: Dr Ron Rosedale, Nov 1, 2011.

Shortly afterward I spoke at the Wise Traditions conference of the Weston A Price Foundation – a great meeting! – and was asked about the GAPS diet of Dr. Natasha Campbell-McBride. It is an excellent diet which embodies a lot of clinical lore about how to heal gut dysbiosis, but its recommendation to avoid starches, while usually helpful, is not always the best course. There are pathogens capable of exploiting every human ecological niche and diet, including very low-carb or fructose-containing diets, and so there is no one diet that is perfect for every patient. Some cases of gut dysbiosis actually benefit from added starch. There seemed to be a bit of controversy about what I said, and I clarified my off-the-cuff comments here: Around the Web; Revisiting Green Meadows Farm, Dec 3, 2011.

Infectious Diseases

I thought I was going to blog a lot more about infectious diseases in 2011, but didn’t get around to it. Still, I got started in February with a few posts: They’ve Got Us Surrounded, Feb 8, 2011; Jaminet’s Corollary to the Ewald Hypothesis, Feb 11, 2011; and Evidence for Jaminet’s Corollary, Feb 15, 2011.

Circadian Rhythm Therapies

I’ve known for a long time that circadian rhythms were important for health. Disruption of circadian rhythms, for instance, by night shift work, is associated with higher rates of disease.

What I didn’t know, until I began to read Seth Roberts, is that simple dietary and lifestyle tactics can have a big impact on circadian rhythms. Seth Roberts and Circadian Therapy, Mar 22, 2011, looks at Seth’s work; “Intermittent Fasting as a Therapy for Hypothyroidism,” Dec 1, 2010, applies circadian rhythm therapies to hypothyroidism.

Cancer

We made a start toward discussing how to eat if you have cancer in two posts: Toward an Anti-Cancer Diet, Sep 15, 2011, and An Anti-Cancer Diet, Sep 28, 2011. Cancer is another disease in which circadian rhythm therapies seem to be important.

However, there’s much more to be said about cancer. We’ll probably discuss HDAC inhibition and anti-viral dieting in 2012.

Miscellaneous Disorders

Check out the “Diseases” categories in our Categories list for other disorders we’ve blogged about. A few items from 2011: Causes and Cures for Constipation, Apr 4, 2011; An Osteoarthritis Recovery Story, May 17, 2011; Around the Web; and Menstrual Cramp Remedy, Mar 5, 2011.

A Year of Food

In 2011, we decided to write a cookbook, and made an earnest start by posting a recipe once a week. Some of our favorite food posts:

Ox Feet Broth, Miso Soup, and Other Soups, Jan 2, 2011

Homemade Seasoned Seaweed, Jan 9, 2011

About Green Tea, Jan 30, 2011

Dong Po’s Pork, Feb 13, 2011

Pho (Vietnamese Noodle Soup), Feb 27, 2011

Pacific Sweet and Sour Salmon, Apr 10, 2011

Crème Brûlée, May 29, 2011

French Fried Potatoes and Sweet Potatoes, Jul 17, 2011

Chicken Wings, Sep 19, 2011

Sarah Atshan’s Lovely Food, Sep 11, 2011

Bi Bim Bap, Oct 16, 2011

Fermented Mixed Vegetables, Nov 27, 2011

Bengali Fish Curry (Machher Jhal), 2: The Recipe, Dec 27, 2011

Art

Shou-Ching wanted to be an artist but settled for being a scientist. This year she began to share some of her art work. We showed some of her paintings in Thank You From Shou-Ching, April 24, 2011, and her Photo Art appears weekly in our Around the Web posts. A complete compilation can be found on the Photo Art page.

Cute Animals

There were too many cute animals in the Around the Web posts to pick a favorite; but here’s one of my favorite places – Logan Pass, Glacier National Park, Montana:

Conclusion

It was a delightful year for us. We made a lot of new friends. Best of all, our diet seems to have improved the health of hundreds, maybe thousands, of people – often dramatically.

We wish all of our readers a very happy New Year! May all of us enjoy improved health in the year to come.

Safe Starches Symposium: Dr Ron Rosedale

Jimmy Moore is graciously continuing the conversation about safe starches with a post from Dr Ron Rosedale. For those trying to keep track, here’s how the discussion has gone:

Today, I’ll reply to Dr Rosedale.

Dr Rosedale argues that glucose is toxic, so we should want to have less of it in our bodies; and that low-carb diets deliver less of it. He cites a lot of papers on the relationship between blood glucose levels and health, and uses blood glucose levels as a proxy for the level of glucose in the body.

Two basic matters are at issue: (1) What blood glucose level is best for health? (2) Which diet will generate those optimal blood glucose levels?

Let’s look at what the evidence shows.

What Blood Glucose Level is Best for Health?

In my main reply, I had written:

What is a dangerous level of blood glucose?

In diabetics, there seems to be no detectable health risk from glucose levels up to 140 mg/dl, but higher levels have risks. Neurons seem to be the most sensitive cells to high glucose levels, and the severity of neuropathy in diabetes is correlated with how high blood glucose rises above 140 mg/dl in response to a glucose tolerance test. [1] In people not diagnosed with diabetes, there is also some evidence for risks above 140 mg/dl. [2]

Dr Rosedale seemed to feel that this was the weakest point in my argument, and directed his fire here. My statement was a description of what the scientific literature shows, and the adjective “detectable” carries a lot of weight here. To refute my statement, you would have to find study subjects whose blood glucose never goes above 140 mg/dl, and yet show health impairments attributable to glucose.

Dr Rosedale argues there is no threshold separating safe from harmful levels of glucose, because glucose acts as a toxin at all concentrations:

I will spend a fair amount of time and show a fair number of studies to show that there is no threshold. Very simply, the higher the blood sugar rise, the more damage is done in some linear upward slope.

I emailed Ron to make sure that he really did mean there was no threshold, so that glycemic toxicity begins at 0 mg/dl. He replied:

I mean the former; that glucose will cause some damage when above 0 mg/dl … obviously a moot point and theoretical when glucose very low and incompatible with life and likely a minute amount of damage when that low.  At any level of glucose compatible with life some more meaningful degree of glycation, hormonal response and genetic expression will take place.   We will always want/need to repair the damage done to stay alive, but with age the repair mechanisms become damaged also.  Eventually damage outdoes repair and we “age”, acquire chronic disease, and die.

Ron’s view can be graphed like this:

This view makes sense as a matter of molecular chemistry: the number of glycation reactions may be proportional to the concentration of glucose, and if glycation products are health damaging toxins then toxicity may be proportional to glucose levels.

The trouble with this is that it doesn’t really get at what we want to know: what blood glucose level optimizes human health?

If we change the y-axis so that it doesn’t measure glycemic toxicity, but rather overall health of the human organism, then the shape of the curve is going to change in two major ways:

  • First, in translating toxicity to its impact on health, we have to account for Paracelsus’s rule: “the dose makes the poison.” The body can readily repair small doses of a toxin with no ill effect – possibly even a hormetic benefit – but large doses of a toxin multiply damage exponentially and can prove fatal. So the impact of a toxin on health will not rise linearly, but non-linearly with a steeper slope as one moves to the right.
  • Second, we have to account for the fact that glucose has a role as a nutrient. As Ron himself says, having too little blood glucose is “incompatible with life.” So low blood glucose – depriving us of the benefits of normal levels of this nutrient – is a catastrophic negative for health. This means that the left side of the curve needs radical adjustment.

With these two changes, our graph becomes something like this:

It now has a U-shape. I’ve drawn the inflection point where toxicity starts rising rapidly at around 140 mg/dl, and the inflection point on the other side where hypoglycemia causes substantial health damage at around 60 mg/dl. But the precise numbers don’t matter much; the point is that there is a U-shape, and somewhere in that U is a bottom where health is optimized.

What do we know about the precise shape of that U, and the location of the bottom?

We can’t intuit the shape of the bottom of the U using theoretical speculations. Theory doesn’t allow us to balance risks of hypoglycemia against toxicity on such a fine scale. The bottom of the U could be very flat, and it might not matter much whether blood glucose levels are 80 or 100 mg/dl. Or the bottom of the U could be tilted, so that the optimum is either at the low end, near 80 mg/dl, or the high end, near 100 mg/dl.

Empirical evidence is limited. Most studies relating blood glucose levels to health have been done on diabetics eating high-carb diets. There are few studies on healthy people, very few testing low-carb diets, and most are insufficiently powered to determine the precise shape of the bottom of the U.

Dr. Rosedale cites a good selection of studies in his response, and let’s review a representative subset. I was familiar with most of the studies; indeed some were cited in our book’s discussion of the dangers of hyperglycemia.

His first cite is “Is there a glycemic threshold for mortality risk?” from Diabetes Care, May 1999, http://pmid.us/10332668. Here is their data:

Look at the black dots, which are the actual data, not the fitted curves which are model-dependent; and at panels A and C, which treat all-cause mortality, not B and D, which are specific for coronary heart disease.

For both fasting and 2-h postprandial blood glucose, the black dots are lowest between about 4.5 and 6.0 mmol/l, which translates to 81 to 108 mg/dl. However, note that there is very little rise in mortality – only about 10% higher relative risk – in 2-h glucose levels of 7 mmol/l, which is 126 mg/dl. Since the postprandial peak is rarely at 2-h (45 min is a common peak), most of these people may well have been experiencing peak levels above 140 mg/dl.

My interpretation: I would say that this study demonstrates that mortality is a U-shaped function of blood glucose levels, but it doesn’t tell us the shape of the bottom of the U. It is consistent with the idea that significant health impairment occurs only with excursions of blood glucose above 140 mg/dl or below 60 mg/dl.

Dr Rosedale’s second cite is actually to a commentary: “‘Normal’ blood glucose and coronary risk” in the British Medical Journal, http://pmid.us/11141131, commenting on a paper by Khaw et al, “Glycated haemoglobin, diabetes, and mortality in men in Norfolk cohort of european prospective investigation of cancer and nutrition (EPIC-Norfolk),” http://pmid.us/11141143.

This study used glycated hemoglobin, HbA1c, which can serve as a measure of average blood glucose over the preceding ~3 weeks. Here is the data:

This supports the “blood sugar should be as low as possible” thesis, since lower HbA1c levels were associated with lower mortality. However, this study has a few flaws:

  • It includes diabetics. Diabetics have poor glycemic control, and episodes of hypoglycemia as well as hyperglycemia, so HbA1c levels (which represent average blood sugar levels) may be a poor proxy for the levels of glycemic toxicity. Also, diabetics are usually on blood-glucose lowering medication, which may distort the blood sugar – mortality relationship.
  • It lumps the population together in very large cohorts. Effectively there were only three cohorts, since the highest HbA1c cohort had only 2% of the sample; the other three cohorts contained 27%, 36%, and 36% of the study population respectively.

We can get a finer grip on what happens by looking at studies that lack these flaws. Here’s one: “Low hemoglobin A1c and risk of all-cause mortality among US adults without diabetes,” Circulation, 2010, http://pmid.us/20923991.

This study is an an analysis of NHANES III; it excludes diabetics and has 3 cohorts, not 1, with HbA1c below 5%. Here’s their data:

The U-shaped mortality curve is very clear. In raw data and all models, the lowest mortality is with HbA1c between 5.0 and 5.4. Mortality increases with every step down in HbA1c: in Model 1, mortality is 8% higher with HbA1c between 4.5 and 4.9, 31% higher between 4.0 and 4.4, and 273% higher below 4.0.

Via Ned Kock of Health Correlator comes a formula for translating HbA1c to average blood glucose levels:

Average blood glucose (mg/dl) = 28.7 × HbA1c – 46.7

Average blood glucose (mmol/l) = 1.59 × HbA1c – 2.59

So the minimum mortality HbA1c range of 5.0 to 5.4 translates to an average blood glucose level of 96.8 to 108.3 mg/dl (5.36 to 6.00 mmol/l).

This result is almost identical to the finding in Dr Rosedale’s first cite, from which Dr Rosedale quoted: “the lowest observed death rates were in the intervals centered on 5.5 mmol/l [99mg/dl] for fasting glucose.”

My interpretation:  Once again, we find that there is a U-shaped mortality curve, and minimum mortality occurs with average or fasting blood glucose in the middle of the normal range – in the vicinity of 100 mg/dl or 5.5 mmol/l.

Let’s finish our examination of this issue with a quick look at Dr Rosedale’s third cite. That paper, “Post-challenge blood glucose concentration and stroke mortality rates in non-diabetic men in London: 38-year follow-up of the original Whitehall prospective cohort study,” Diabetologia, http://pmid.us/18438641, is a familiar one; it was cited in our book (p 36, fn 35).

This study looked at blood glucose levels 2 hours after swallowing 50 grams of glucose, and then followed the men for 38 years to observe mortality rates. CarbSane makes an important observation: this study used whole blood rather than plasma to assay blood glucose. Whole blood has more volume (due to inclusion of cells) but the same glucose, and so less glucose per deciliter. According to this paper, standard (plasma) values are about 25 mg/dl higher, so 95 mg/dl in whole blood actually corresponds to a plasma value of about 120 mg/dl.

Here is the data:

There is no significant difference in mortality among any group with post-challenge whole blood glucose up to 5.29 mmol/l (95 mg/dl), corresponding to 120 mg/dl or 6.7 mmol/l in standard measurements.

The study was designed to look at high blood glucose levels: there were 4 cohorts in the top 10% of blood glucose levels, but the bottom cohort in blood glucose had fully 31% of the sample. This cohort consisted of everyone with 2-hr whole blood glucose levels below 68 mg/dl, or plasma glucose below about 90 mg/dl. Mortality in this large group was indistinguishable from that in the next two groups, who had plasma glucose between 90 and 120 mg/dl.

My interpretation: This study wasn’t designed to observe the lower end of the U. At the higher end, it is consistent with the other studies: mortality rises with 2-hr plasma glucose above 120 mg/dl.

Summary: Optimal Blood Glucose Levels

All of the papers cited by Dr Rosedale are consistent with this story:

  1. Mortality and health have a U-shaped relationship with blood glucose.
  2. Optimum health occurs at blood glucose levels around 100 mg/dl – at normal levels, not exceptionally low levels.
  3. The impaired health seen with fasting or 2-hr blood glucose levels of 110 or 120 mg/dl may be largely attributable to the portion of the day in which those people experience blood glucose levels over 140 mg/dl.

I should note that Dr Rosedale acknowledges that high-normal blood glucose is better than low blood glucose for some aspects of health, like fertility:

Safe starch proponents say that raising blood glucose and raising insulin is a very natural phenomenon and needn’t be avoided. However, if we evolved in a certain way and with certain physiologic responses to the way we eat, it was not for a long, healthy, post-reproductive lifespan. It was for reproductive success. The two are not at all synonymous, in fact often antagonistic.

He’s saying that higher blood glucose favors “reproductive success,” while lower blood glucose favors “post-reproductive lifespan.” I guess one has to choose one’s priorities. Not everyone will choose maximum lifespan.

But suppose Dr Rosedale is right, and that low blood glucose levels are most desirable for at least some persons. I’m willing to stipulate, for the sake of argument, that optimal health for some persons may occur at below-normal blood glucose levels – say, 80 mg/dl. That brings us to the second issue: which diet will produce these low blood glucose levels?

Which Diet Minimizes Blood Glucose Levels?

If the key to health is achieving below-normal blood glucose levels, then low-carb diets are in trouble.

In general, very low-carb diets tend to raise fasting blood glucose and 2-hr glucose levels in response to an oral glucose tolerance test.

This is a well-known phenomenon in the low-carb community. When I ate a very low-carb diet, my fasting blood glucose was typically 104 mg/dl. Peter Dobromylskyj of Hyperlipid has reported the same effect: his fasting blood glucose is over 100 mg/dl. From one of Peter’s posts:

Back in mid summer 2007 there was this thread on the Bernstein forum. Mark, posting as iwilsmar, asked about his gradual yet progressively rising fasting blood glucose (FBG) level over a 10 year period of paleolithic LC eating. Always eating less than 30g carbohydrate per day. Initially on LC his blood glucose was 83mg/dl but it has crept up, year by year, until now his FBG is up to 115mg/dl….

I’ve been thinking about this for some time as my own FBG is usually five point something mmol/l whole blood. Converting my whole blood values to Mark’s USA plasma values, this works out at about 100-120mg/dl.

Peter notes that low-carb dieters will generally perform poorly on glucose tolerance tests, but that increasing carb intake to about 30% of calories is sufficient to produce a normal response to a glucose challenge:

The general opinion in LC circles is that you need 150g of carbohydrate per day for three days before an oral glucose tolerance test.

This is at the high end of the 20% to 30% of energy (400 to 600 calories on a 2000 calorie diet) that is the Perfect Health Diet recommendation for carbs.

The Kitavans eat more than 60% of calories as carbohydrate, mostly from starches. Their fasting blood glucose averages 3.7 mmol/l (67 mg/dl) (http://pmid.us/12817903).

Studies confirm that high-carb diets tend to lower fasting glucose and to lower the blood glucose response to a glucose challenge. CarbSane forwarded me some illustrative studies:

  • “High-carbohydrate, high-fiber diets increase peripheral insulin sensitivity in healthy young and old adults,” http://pmid.us/2168124. Switching healthy adults to a higher carb diet reduced fasting blood glucose from 5.3 to 5.1 mmol/L (95.5 to 91.9 mg/dl) and reduced fasting insulin from 66 to 49.5 pmol/l.
  • “Effect of high glucose and high sucrose diets on glucose tolerance of normal men,” http://pmid.us/4707966. On diets with glucose as the only carb source, 2-hr plasma glucose after a glucose challenge was 184 mg/dl on a 20% carb diet, 183 mg/dl on a 40% carb diet, 127 mg/dl on a 60% carb diet, and 116 mg/dl on an 80% carb diet. The 80% carb diet was the only one on which blood glucose never went above 140 mg/dl.

This last study did not report fasting glucose, but did track blood glucose for 4 hours after the glucose challenge. If we take the 4-hr blood glucose reading as representative of fasting glucose, we find that dieters eating 60% or 80% carb diets had fasting glucose of 76 and 68 mg/dl, respectively.

My interpretation of the evidence from multiple sources: A plausible conclusion is that a high-carb diet produces a low fasting glucose (let’s say, 80 mg/dl), a PHD type 20% carb diet an intermediate fasting glucose (95 mg/dl), and a very low-carb diet a high fasting glucose (say, 105 mg/dl).

Just for fun, I decided to see where these fasting glucose levels show up on the mortality plot from Balkau et al:

The 20% carb diet lines up pretty well with the mortality minimum, and both high-carb and very low-carb diets wind up at bins with slightly elevated mortality.

Now, I don’t believe we can infer from data on high-carb dieters what the relationship between blood glucose levels and mortality will be in low-carb dieters. It was Dr Rosedale, not me, who introduced this study into evidence.

But if we believe that lowest mortality really does occur with 2-hr post-challenge blood glucose around 100 mg/dl and fasting blood glucose below 100 mg/dl, as argued by the studies Dr Rosedale cited, and that this result applies to low-carb dieters, then I think the evidence is clear. One must eat some carbohydrates – at least 20-30% of energy.

This is the standard Perfect Health Diet recommendation. It seems that Dr Rosedale is supporting my diet, not his!

What About Diabetics?

Perhaps the boldest passage in Dr Rosedale’s reply was this:

We are all metabolically damaged to some extent. None of us has perfect insulin and leptin sensitivity….  It is for that reason that I say that we all have diabetes, some more than others, and should all be treated as such.

Well, if we all have diabetes, more or less, then I guess I have to consider whether our regular diet – which recommends about 20% of energy (400 calories) as carbs – is healthy for diabetics.

Now, before I begin this discussion, let me say that I don’t claim that this is optimal for diabetics. I think it is still an open question what the optimal diet for diabetics is, and different diabetics may experience a different optimum. I have often said that diabetics may benefit from going lower carb (and possibly higher protein) than our regular dietary recommendations. However, Dr Rosedale is here saying that even a healthy non-diabetic should eat a diet that is appropriate for diabetics. I want to see whether our regular diet meets that standard.

How do diabetics do on a 20% carb diet? Here’s some data that I found in a post by Stephan Guyenet at Whole Health Source. It’s from a 2004 study by Gannon & Nuttall (http://pmid.us/15331548) and the graph is from a later paper by Volek & Feinman (http://pmid.us/16288655/). Over a 24 hour period, blood glucose levels were tracked in Type II diabetics on their usual diets (blue and grey triangles) and after 5 weeks on a 55% carb – 15% protein – 30% fat (yellow circles) or 20% carb – 30% protein – 50% fat diet (blue circles):

The low-carb diet was a little higher in protein and lower in fat than we would recommend, but very close overall to our recommendations and spot-on in carbs.

What happened to blood glucose? It came close to non-diabetic levels. Fasting blood glucose dropped to 7 mmol/l (126 mg/dl), roughly the level at which diabetes is diagnosed. Postprandial blood glucose elevations were modest – peaking below 160 mg/dl which is about 20 mg/dl higher than in normal persons. Average daily blood glucose looks to be around 125 mg/dl.

What would have happened on a zero-carb diet? Fasting blood glucose probably would still have been elevated, near 126 mg/dl; this is common in diabetics because the loss of pancreatic beta cells creates a glucagon/insulin imbalance that leads to elevated fasting blood glucose. This blood glucose level would have been maintained throughout most of the day, with the postprandial peaks and troughs flattening. Average daily blood glucose level would have been similar to that on the 20% carb diet.

So the big benefit, in terms of glycemic control for diabetics, comes from reducing carbs from 55% to 20%. Further reductions in carb intake do not reduce average 24 hour blood glucose levels, but may reduce postprandial glucose spikes.

In fact, we have some Type II diabetics eating Perfect Health Diet style. Newell Wright reports good results:

I am a type II diabetic and a Perfect Health Diet follower, so I want to chime in with my experience….

I switched from the Atkins Induction diet to the Perfect Health Diet. I have been eating rice, potatoes, bananas, and other safe starches ever since, as well as fermented dairy products, such as plain, whole milk yogurt. I have also slowly lost another seven pounds. I enthusiastically recommend the book, Perfect Health Diet by Paul and Shou-Ching Jaminet.

Today, my fasting blood glucose reading was 105. Note that since following the Perfect Health Diet, my fasting blood glucose reading has gone down. Previously, I was suffering from the “dawn phenomenon.” My blood glucose levels overall were well below 140 one hour after a meal and 120 two hours after a meal. Only my fasting BG reading was out of whack, usually between 120 and 130, first thing in the morning.

For dinner tonight, I had a fatty pork rib, green beans, and a small baked potato with butter and sour cream. For dessert, I had a half cup of vanilla ice cream. One hour after eating, my blood glucose level was 128 and two hours after, it was 112.

So not only am I losing weight on the Perfect Health Diet, my blood glucose levels have actually improved, thanks to the increased carbs counteracting the dawn phenomenon, just as Dr. Kurt Harris (another proponent of safe starches) said it would.

So for me, as a type II diabetic, this “safe starches” exclusion is pointless…. [D]espite the type II diabetes, I am doing just fine on the Perfect Health Diet, thank you. I reject the diabetic exclusion of safe starches.

Note that Newell’s fasting blood glucose went down from 125 to 105 mg/dl when he raised his carb intake from Atkins Induction to Perfect Health Diet levels, and postprandial glucose levels on PHD were no higher than his fasting levels on Atkins Induction. It looks like he reduced blood glucose levels by adding starches to his diet.

To repeat: I’m not claiming that our regular diet, providing 20% of energy from “safe starches,” is optimal for diabetics. I don’t know what the optimal diabetes diet is, and it may be different for different diabetics. But I think there is plentiful evidence that even for diabetics, our “regular” diet is not a bad diet. And for some, it might be optimal.

Summary: Putting It All Together

It looks like 20% of energy is a sort of magic number for carbs. It:

  • Averts glucose deficiency symptoms while achieving normal insulin sensitivity and glycemic control on oral glucose tolerance tests;
  • Avoids significant hyperglycemic toxicity even in diabetics.

Why does this magic number, which happens to be the Perfect Health Diet recommendation for carb intake, do so well?

Perhaps a chart will make the science a little clearer.

“Dietary glucose in” (blue) represents the amount of carbs obtained from diet. “The body’s glucose utilization” (maroon) is how much glucose will be put to useful purposes at a given daily carb consumption. Glucose utilization does not vary as strongly as glucose intake; at low intakes a deficit is made up by gluconeogenesis (manufacture of glucose from protein) and at high intakes an excess of glucose is destroyed by thermogenesis or conversion of glucose to fat.

Where the blue and maroon lines cross, dietary glucose in matches the body’s glucose utilization. For most sedentary adults, this level will be around 600 carb calories per day. We recommend eating close to or slightly below this point (“PHD Recommendation”).

There are dangers in straying too far from this intersection point:

  • Eating too few carbs creates a risk of health impairment due to insufficient glucose or protein.
  • Eating too many carbs results in unnecessary exercise of glucose disposal pathways, and possible unhealthy fluctuations in blood glucose levels if those disposal pathways fail.

Hitting just below the intersection is a safe, low-stress point which will work well for most people.

For diabetics, the excess glucose disposal pathways are broken. However, this is not a major problem if you have no excess glucose to dispose of. Eating up to 20% of calories from carbs doesn’t require the use of disposal pathways – glucose can be stored as glycogen and then released as needed, so the effect of dietary glucose is primarily to reduce the amount of gluconeogenesis. Suppressing gluconeogenesis requires some residual insulin secretion ability, so Type I diabetics cannot achieve this, but most Type IIs can.

The upshot: A 20% carb diet meets the body’s glucose needs without much risk of hyperglycemic toxicity even in diabetics.

The Issue of Thyroid Hormones and Anti-Aging

The most distinctive element of Dr. Rosedale’s diet is its emphasis on longevity as the supreme measure of health, and its emphasis on calorie restriction (especially, carb and protein restriction) and metabolic suppression as the means to long life.

Our book, Perfect Health Diet, relied strongly on evidence from evolutionary selection to guide us toward the optimal diet.

Dr. Rosedale rejects evolutionary selection as a helpful criterion, since evolution did not necessarily select for longevity:

[I]f we evolved in a certain way and with certain physiologic responses to the way we eat, it was not for a long, healthy, post-reproductive lifespan. It was for reproductive success. The two are not at all synonymous, in fact often antagonistic. We have no footsteps to follow as far as the best way to eat for long healthy post reproductive life. We can only use the best science pertaining to the biology of aging and apply it to proper nutrition. That is what I feel I am doing.

We actually share much of Dr Rosedale’s perspective on what influences longevity; it is for longevity that we recommend slightly under-eating carb and protein compared to what evolution selects for. However, we don’t go as far in that direction as Dr Rosedale does.

We have written of the suppression of T3 thyroid hormone levels which is part of the body’s strategy for conserving glucose in times of scarcity, and how this is a risk factor for “euthyroid sick syndrome.” See Carbohydrates and the Thyroid, Aug 24, 2011.

Dr Rosedale acknowledges this and believes it to be beneficial:

I believe that Jaminet and most others misunderstand the physiologic response to low glucose, and the true meaning of low thyroid. Glucose scarcity (deficiency may be a misnomer) elicits an evolutionary response to perceived low fuel availability. This results in a shift in genetic expression to allow that organism to better survive the perceived famine…. As part of this genetic expression, and as part and parcel of nature’s mechanism to allow the maintenance of health and actually reduce the rate of aging, certain events will take place as seen in caloric restricted animals. These include a reduction in serum glucose, insulin, leptin, and free T3.

The reduction in free T3 is of great benefit, reducing temperature, metabolic damage and decreasing catabolism…. We are not talking about a hypothyroid condition. It is a purposeful reduction in thyroid activity to elicit health. Yes, reverse T3 is increased, as this is a normal, healthy, physiologic mechanism to reduce thyroid activity.

Note that Dr Rosedale acknowledges that his glucose-scarce diet reduces body temperature. Many Rosedale dieters have had this experience. Darrin didn’t like it:

This comment from Rosedale support may be of interest to you;

“The best place to measure is under the tongue. Ideal basal temperature is what you have when you first wake up in the morning, and on the Rosedale diet should be upper 96’s lower 97’s. We have found that when someone starts our diet, their basal temperature will go down about 1-2 degrees Fahrenheit which is a great improvement”.

Personally, i did not feel good on a lower body temp when i was low carb (sub 50g) & have been working hard (following phd diet & supps) to get my body temp back up. i would say my basal/morning oral temp is now around the 97.5F on average (up from around 96.5F average pre PHD).

Low body temperatures are associated with a variety of negative health outcomes. For instance, low body temperature is immunosuppressive, leads to poor outcomes in infections, and is a significant independent predictor for death in medical patients. Fever is curative for most infections, low body temperature is a risk factor for infections. Readers of our book know that we think infections are a major factor in aging and premature death. Whether a diet so restricted in carbs that it significantly lowers body temperature is really optimal for longevity is, I think, open to question.

There is a plausible case to be made for the Rosedale diet as a diet that sacrifices certain aspects of current health in the hope of extending lifespan. It cannot however claim to be the optimal diet for everyone. It is certainly not optimized for fertility, athleticism, or immunity against infections.

Conclusion

I am sympathetic to the broad perspective that underlies Dr Rosedale’s diet. Both our diets are low-carb, low-protein, and high-fat, and studies of longevity are the biggest factor motivating the recommendation to eat a fat-rich diet.

However, Dr Rosedale takes low-carb and low-protein dieting to an extreme that I think is not well supported by the evidence.

Dr Rosedale’s direct attempt at refuting our diet consists mainly of two claims:

  • Lower blood glucose is better than higher blood glucose.
  • The way to lower blood glucose is by eating fewer carbs.

Neither claim is supported. Mortality is a U-shaped function of blood glucose and blood glucose levels around 90 to 100 mg/dl are healthiest, not low blood glucose levels. Moreover, the diet that delivers the lowest blood glucose levels is a high-carb, insulin-sensitizing diet, such as the Kitavans eat, not a low-carb diet.

If I truly believed Dr Rosedale’s argument for lower blood glucose, he would have persuaded me to eat a high-carb Kitavan-style diet. However, I am not persuaded.

I believe that:

  • Optimal blood glucose levels are in the 90 to 100 mg/dl range. High-carb diets cause below-optimal levels of blood glucose, especially during fasts. (Indeed, high-carb dieters routinely experience hunger and irritability during long fasts.) Very low-carb diets cause elevated blood glucose due to the body’s efforts to conserve glucose by suppressing utilization. Excessive suppression of glucose utilization is unhealthy.
  • A 20% carb diet, while not optimal for every single person, is healthy for nearly everyone. Twenty percent may be the best single prediction of the optimal carb intake for the population as a whole. Even diabetics can do well eating 20% carbs.

And that is why we recommend moderate consumption of safe starches.