Category Archives: Diets - Page 10

Serum Cholesterol Among the Eskimos and Inuit

We’re investigating the surprising claim, set forth by S. Boyd Eaton, Melvin Konner, and Marjorie Shostak 1988 [1] and reiterated by Loren Cordain and collaborators in 2004 [2] and Boyd and Konner 2010 [3], that hunter-gatherers had total serum cholesterol below 135-140 mg/dl (3.49-3.62 mmol/l), and that this was healthy. A summary of their claims can be found in Tuesday’s post (Did Hunter-Gatherers Have Low Serum Cholesterol?).

The original Eaton et al paper [1] listed Hadza, Kalahari San (Bushmen), Congo Pygmies, Canadian Eskimos, and Australian Aborigines as hunter-gatherer populations with low cholesterol. So I’m going to survey cholesterol levels in those groups, and maybe a few others.

I had intended to cover all groups in one post, but I found that doing the topic justice requires more elaborate discussion. Therefore, I’ll give each group its own blog post, starting with the Eskimos and Inuit.

A word of caution: Please do not jump to conclusions until the series is complete. I will withhold most of my analysis until the end of the series. For now I am just presenting data, assessing its quality, and including relevant facts about the health of the study population.

Summary of the Data

Searches on “Eskimo cholesterol” and “Inuit cholesterol” turned up a lot of papers. I didn’t look at all of them but I looked at most of the pre-1988 papers (which Eaton et al could have cited) and a sampling of recent ones.

Here is a table summarizing what I found. Papers are ordered from oldest to newest:

Cholesterol Levels of Eskimo & Inuit Populations 

Paper [ref] Mean TC Notes
Corcoran & Rabinowitch 1935 [9] 141 mg/dl Stale samples, obsolete technique, small sample size; tuberculosis common
Wilber & Levine 1950 [11] 218 mg/dl
Rodahl 1955 [13] 215 mg/dl
Pett & Lupien 1958 [10] 204 mg/dl
Scott et al 1958 [12] 214 mg/dl
Davies & Hanson 1965 [8] 182 mg/dl Diseased (tuberculosis), life expectancy 32 years
Ho et al 1972 [7] 221 mg/dl
Dyerberg et al 1975 [6] 216 mg/dl
Young et al 1993 [15] 205 mg/dl Average of 4 age and gender cohorts
Howard et al 2010 [14] 211 mg/dl TC calculated from LDL 125, HDL 62, triglycerides 118
Makhoul et al 2010 [5] 223 mg/dl

Results are remarkably consistent. Nine of the eleven papers reported mean total cholesterol (TC) between 204 mg/dl and 223 mg/dl. Let’s look more closely.

Studies that Reported Low Serum Cholesterol

The TC of 141 mg/dl reported by Corcoran & Rabinowitch 1937 [9] among Hudson Bay and Baffin and Devon Island Eskimos is precisely the number quoted for Canadian Eskimos by Eaton, Konner and Shostak [1]. Presumably this was their source for that number.

How solid is the number? Corcoran & Rabinowitch acquired samples from only 27 non-fasting Eskimo men. The measurement method was archaic and the samples were not fresh:

None of the tests was completed during the voyage. The work then was confined to collection of the blood samples and their necessary treatment to preserve the different constituents to be examined. All analyses were made on oxalated plasma. [9]

Corcoran & Rabinowitch note the unreliability of lipid measurements from the 1930s:

A survey of the literature shows wide variations of the different lipoid constituents of blood, both in fasting experiments and following ingestion of food, in animals and in man, and whether the analyses were made upon whole blood, red blood cells, plasma or serum. Correlation of these data is difficult because of the variety of technical methods with which they were obtained. [9]

Possible evidence for deterioration of the samples is the fact that, although twenty of the twenty-seven Eskimos were eating zero-carb diets, no ketones were found in any sample:

Also suggestive of an unusual mechanism for the utilization of fat is the absence of ketosis in these natives, whereas the urines of both [Stefansson and Andersen during the Bellevue All-Meat Trial] contained acetone. The explanation of this absence of ketosis is not entirely clear. [9]

My guess is the ketones had evaporated before measurement, or were otherwise degraded.

I might add that in 1935, when the Corcoran & Rabinowitch samples were collected, the Eskimo had already begun to deviate from the hunter-gatherer lifestyle. Rabinowitch 1936 [16] reports:

These Eskimos are employed by the Police, and live in huts for a great part of the year. Their food and clothing are also to some extent the products of civilization … The food supplied by the Police must be supplemented by the natural foods of their environment- seal, etc. These Eskimos still spend much time hunting. [16]

Rabinowitch observed flour in about half the Eskimo tents he visited, and was told at Lake Harbour, which may have had the lowest flour consumption of the sites he visited, that the average annual flour consumption was 130 pounds for a family of three Eskimos. [16]

Infectious disease, notably tuberculosis, was common:

Tuberculosis was common in the Straits and Bay. At Chesterfield Inlet, of 62 persons examined 22 had some respiratory disturbance; and of these 12 had coughs with no detectable adventitious sounds in the lungs; 2 had what appeared to be bronchitis only; and 8 had active pulmonary tuberculosis. In addition to these 8 cases, active glandular tuberculosis (cervical) was found in 4 children. At Port Burwell, of 31 natives examined 8 had coughs with no detectable adventitious sounds; 2 had what appeared to be bronchitis; and 5 adults had active pulmonary tuberculosis. Two children had masses of confluent glands in the neck. There was one case of tuberculosis of bone (phalanx); there was no reason to suspect lues in this case. At Coral Harbour there was a child with tuberculosis of a knee joint. Two cases of active pulmonary tuberculosis were found at Lake Harbour. At Wolstenholme one child was found with a mass of confluent glands in the neck. [16]

They also had parasites and worms:

From reports of the Institute of Parasitology of McGill University by Drs. TWM Cameron and IW Parnell it is obvious that the Eskimo is exposed to a variety of parasitic infections. These authors have found that at least three-quarters of all the animals examined, birds, duck, geese, etc., harboured parasites. The polar bear, walrus, and weasel were found free, but most of the seals were infected with Ascarides and intestinal flukes. The Eskimo lives in intimate contact with his dogs, and carcasses and feces of these animals are heavily parasitized with hookworm, Ascarides, flukes, and tape worms. Ascarides, taenia and hookworm were found as far north as Craig Harbour, and hares from Ellesmere Island were heavily infected with worms. Nail scrapings of Eskimos were found high in content of Oxyuris vermicularis…. Our pathologist, Dr LJ Rhea, in his search for parasites found 6 cases of eosinophilia amongst 34 blood smears. [16]

The other paper showing a mean population TC below 200 mg/dl was Davies & Hanson 1965 [8], who found a mean TC of 182 mg/dl. I liked this paper because it gave a lot of textual background concerning the health and diet of the 727 Canadian Northwest Passage Eskimos studied. Some quotes from this study:

[Seventy to ninety percent] live at sealing or fishing camps and visit the trading posts twice yearly or more often, depending on distance.

Ten to 25% of their food is obtained from trading posts …

[L]ife expectancy of the Eskimo is about 32 years … [8]

Health was poor, as you’d expect from the short life expectancy. Infectious disease was a serious problem. Many had had tuberculosis or brucellosis; chronic coughs were common. Many had abnormal blood cell counts, such as eosinophilia, neutrophilia, and lymphocytosis. Some had diabetes, despite low-carb diets; I suspect the combination of alcohol and omega-3 fats (also low vitamin D) to have been the culprit. However, iodine status was excellent and hypothyroidism was extremely rare.

My guess is that these Eskimos were bringing a lot of tobacco, alcohol, and infectious disease back from those trading posts.

Considering that 75% to 90% of their food was acquired in the traditional way, a life expectancy of 32 years is not exactly a ringing endorsement of the healthfulness of the Eskimo/Inuit diet. The poor health of this group of Eskimos may have contributed to their relatively low TC of 182 mg/dl.

Studies that Reported High Serum Cholesterol

The other nine studies reported mean serum TC between 204 and 223 mg/dl. These levels fall in the minimum mortality region of O Primitivo’s database and are suggestive of good health.

I particularly like one recent paper, Makhoul et al 2010 [5], because it sampled Yup’ik Eskimo eating the traditional diet, and included scatter plots showing each individual’s cholesterol numbers. They write:

Because of their traditional diet, which is based largely on fish and other marine foods (20), Yup’ik Eskimos have a mean intake of EPA and DHA that is >20 times the current mean intake of the general US population (3.7 compared with 0.14 g/d in men and 2.4 compared with 0.09 g/d in women) (21). Studies of Yup’ik Eskimos offer a unique opportunity to examine how a broad range of EPA and DHA intakes (22) affect chronic disease biomarkers. [5]

Some Eskimos in their sample got as much as 15% of calories from EPA+DHA. Their cholesterol levels:

TC is mostly between 200 and 240 mg/dl, LDL between 100 and 160, and HDL between 50 and 70. Cholesterol increased as fish oil intake increased – evidence that cholesterol gets higher as the diet becomes more traditional.

Other studies also found that the more traditional the Eskimo diet, the higher were total cholesterol levels. Here is the discussion in Ho et al 1977 [7], who found mean total cholesterol of 221 mg/dl in Arctic Eskimos:

This value was in general agreement with that obtained from other mass samplings of Arctic Eskimos (8-11) but was slightly higher than those values obtained from the Eskimos living on the Pacific Coast of Alaska, as reported by Scott et al. (9). [PJ: Scott et al, my reference [12], found mean TC of 214 mg/dl.] A generalization was made by Scott and co-workers from their study on 842 Eskimos that northern Alaskan Eskimos have higher serum cholesterol levels than southern Eskimos. The reason for this difference might well be related to the differences in their diets, as the main staple of northern Eskimos is marine mammals, whereas that of the southern Eskimos includes some vegetables and fish (12). [7]

In general, the studies reporting mean TC over 200 mg/dl all reported that their study population were eating a diet resembling the traditional hunter-gatherer diet. In Arctic populations, this diet featured high intake of marine mammals and low intake of carbohydrates.

Conclusion

The vast majority of studies show that Eskimo and Inuit populations have mean serum cholesterol over 200 mg/dl. The only studies showing mean serum cholesterol below 200 mg/dl sampled tuberculosis-ridden populations with short life expectancy. The study showing the lowest mean serum cholesterol used obsolete sample preparation and measurement techniques on stale samples.

The most parsimonious explanation of the data is that TC of 200-230 mg/dl is normal for Eskimos and Inuit, that lower TCs indicate the presence of infectious diseases such as tuberculosis, and that the very low TC of Corcoran & Rabinowitch 1937 may have suffered from sample degradation during the two-and-a-half-month voyage (July 13-Sept 29) before samples could be measured in Montreal.

It would be difficult to attribute the low TC in Corcoran & Rabinowitch 1937 to diet, as the subjects ate flour and other government-provided foods and did not obviously eat a more traditional diet than the Eskimo of later studies. The most salient difference between the Corcoran & Rabinowitch subjects and those of later studies was the high incidence of tuberculosis in 1935. Perhaps the low TC in Corcoran & Rabinowitch was due to tuberculosis, but Davies and Hanson found a mean TC of 182 mg/dl in another tuberculosis-ridden Eskimo population.

The Corcoran & Rabinowitch 1937 paper will be useful to us because it gives us an indication what may happen to measured TC levels when an older measurement method, that of Abell, is applied to stale samples. It appears that such measurements may under-report TC by as much as 1/3 (210 mg/dl to 141 mg/dl).

Related Posts

The posts in this series are:

References

[1] Eaton SB, Konner M, Shostak M. Stone agers in the fast lane: chronic degenerative diseases in evolutionary perspective. Am J Med. 1988 Apr;84(4):739-49. http://pmid.us/3135745. Full text: http://www.direct-ms.org/pdf/EvolutionPaleolithic/EatonStone%20Agers%20Fast%20Lane.pdf

[2] O’Keefe JH Jr, Cordain L, Harris WH, Moe RM, Vogel R. Optimal low-density lipoprotein is 50 to 70 mg/dl: lower is better and physiologically normal. J Am Coll Cardiol. 2004 Jun 2;43(11):2142-6. http://pmid.us/15172426.

[3] Konner M, Eaton SB. Paleolithic nutrition: twenty-five years later. Nutr Clin Pract. 2010 Dec;25(6):594-602. http://pmid.us/21139123. Full text: http://ncp.sagepub.com/content/25/6/594.full.

[5] Makhoul Z et al. Associations of very high intakes of eicosapentaenoic and docosahexaenoic acids with biomarkers of chronic disease risk among Yup’ik Eskimos. Am J Clin Nutr. 2010 Mar;91(3):777-85. http://pmid.us/20089728.

[6] Dyerberg J et al. Fatty acid composition of the plasma lipids in Greenland Eskimos. Am J Clin Nutr. 1975 Sep;28(9):958-66. http://pmid.us/1163480.

[7] Ho KJ et al. Alaskan Arctic Eskimo: responses to a customary high fat diet. Am J Clin Nutr. 1972 Aug;25(8):737-45. http://pmid.us/5046723.

[8] Davies LE, Hanson S. THE ESKIMOS OF THE NORTHWEST PASSAGE: A SURVEY OF DIETARY COMPOSITION AND VARIOUS BLOOD AND METABOLIC MEASUREMENTS. Can Med Assoc J. 1965 Jan 30;92:205-16. http://pmid.us/14246293.

[9] Corcoran AC, Rabinowitch IM. A study of the blood lipoids and blood protein in Canadian Eastern Arctic Eskimos. Biochem J. 1937 Mar;31(3):343-8. http://pmid.us/16746345.

[10] Pett LB, Lupien PJ. Cholesterol levels of Canadian Eskimos. Federation Proc. 17(1958): 488, 1958.

[11] Wilber CG, Levine VE. Fat metabolism in Alaskan Eskimos. Exp Med Surg. 1950 May-Nov;8(2-4):422-5. http://pmid.us/15427668.

[12] Scott EM et al. Serum cholesterol levels and blood pressure of Alaskan Eskimo men. Lancet. 1958 Sep 27;2(7048):667-8. http://pmid.us/13588965.

[13] Rodahl K. Diet and cardiovascular disease in the Eskimos. Trans Am Coll Cardiol. 1955 Apr;4:192-7. http://pmid.us/14373771.

[14] Howard BV et al. Cardiovascular disease prevalence and its relation to risk factors in Alaska Eskimos. Nutr Metab Cardiovasc Dis. 2010 Jun;20(5):350-8. http://pmid.us/19800772.

[15] Young TK et al. Cardiovascular diseases in a Canadian Arctic population. Am J Public Health. 1993 Jun;83(6):881-7. http://pmid.us/8498628.

[16] Rabinowitch IM. Clinical and Other Observations on Canadian Eskimos in the Eastern Arctic. Can Med Assoc J. 1936 May;34(5):487-501. http://pmid.us/20320248. Full text: http://www.ncbi.nlm.nih.gov/pmc/articles/PMC1561651/pdf/canmedaj00512-0065.pdf.

Did Hunter-Gatherers Have Low Serum Cholesterol?

Emily raised a great question in response to last Tuesday’s post:

[W]hat of the reports of hunter gatherers having low cholesterol. Is it the product of fringe environments, or low infectious burden, or what?

Let’s look into this. Do hunter-gatherers in fact have low cholesterol? If so, why?

The Claim

As far as I know, this idea originated with and was promoted by the fathers of Paleo dieting, S. Boyd Eaton and Loren Cordain, and their collaborators.

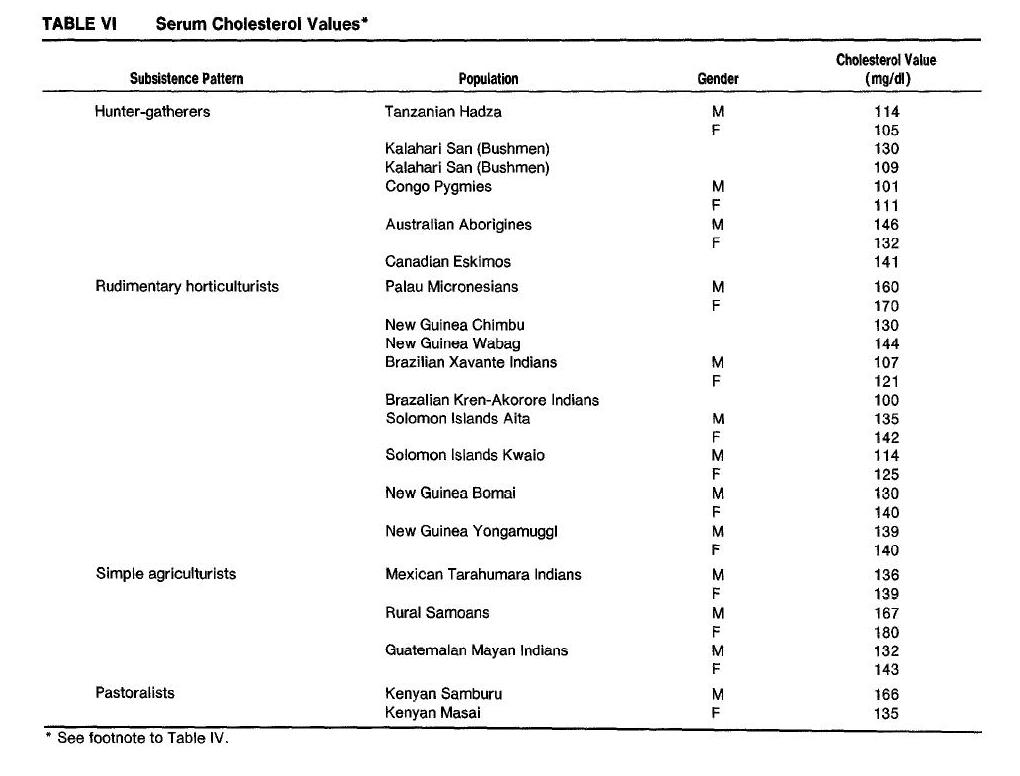
Its first appearance, to my knowledge, was in a 1988 paper by S. Boyd Eaton, Melvin Konner, and Marjorie Shostak called “Stone agers in the fast lane: chronic degenerative diseases in evolutionary perspective” [1]. Here’s their data:

The footnote to Table IV reads as follows:

The published paper has 101 references and takes 11 pages in the journal, yet no supporting references for the cholesterol data were included.

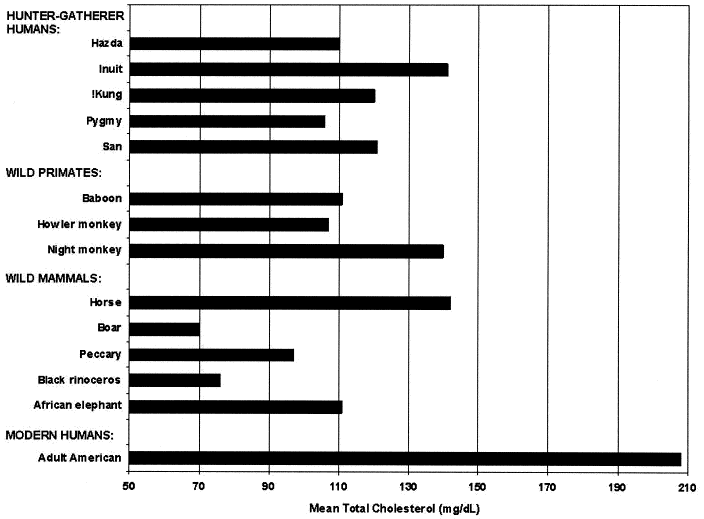
Here is a graph from a 2004 paper by Loren Cordain, William Harris, and some pro-statin medical doctors [2] (thanks Stabby!):

The caption states that total cholesterol (TC) ranges between 70 and 140 mg/dl in hunter-gatherers, and LDL cholesterol (LDL-C) between 35 and 70 mg/dl. However, this claim is unsourced. The paper provides references for assertions that LDL tends to be around half TC, and that modern Americans have TC around 208 and LDL-C around 130, but there are no references for hunter-gatherer cholesterol levels.

The data in this graph seem to be drawn from the Eaton, Konner, and Shostak paper [1]. The Hadza number is the same as the 109.5 mg/dl (2.83 mmol/l) average of the male and female Hadza in [1]; Inuit at 141 mg/dl (3.65 mmol/l) is the same as “Canadian Eskimos” in [1]; !Kung and San (probably the same people) are both listed very close to the 119.5 mg/dl (3.09 mmol/l) average of “Kalahari San (Bushmen)” in [1]; Pygmy looks identical to the 106 mg/dl average of male and female “Congo Pygmies” in [1]. It looks like they just copied from Eaton et al but deleted the Australian Aborigines who in [1] had a male-female average TC of 139 mg/dl (3.59 mmol/l).

Eaton and Konner were sticking to the low hunter-gatherer cholesterol claim in 2010 [3]; they cited only their original 1988 paper [1] when they wrote:

Our review of various health measures in HG and other nonindustrial populations showed that average HG serum total cholesterol was always below 135 mg/dL … [3]

So over 23 years, to judge by these papers, Eaton et al and Cordain et al have yet to cite a peer-reviewed article in support of the proposition that hunter-gatherers had low cholesterol. Where did this idea come from? And is it true?

The Evidence Is Worth Looking Into

The claim that healthy hunter-gatherers had serum cholesterol below 140 mg/dl is quite surprising, given that contemporary populations are healthiest when their serum cholesterol is over 200 mg/dl, and mortality rises and life expectancy falls sharply as serum cholesterol falls below 180 mg/dl. (See Blood Lipids and Infectious Disease, Part I, Jun 21, 2011.)

Are hunter-gatherers – either their diets or their genetics – so different from modern populations? Or is the claim that healthy hunter-gatherers have low serum cholesterol a mistake?

I think this is an interesting question, with implications both for the design of Paleo diets and for our interpretation of serum lipid results. When we discussed HDL, I argued that some dietary methods to raise HDL might benefit us by enhancing immunity (see HDL and Immunity, April 12, 2011; HDL: Higher is Good, But is Highest Best?, April 14, 2011; How to Raise HDL, April 20, 2011). Might a similar strategy for dietary manipulation of LDL be desirable too?

Next Steps

I’ll examine the issue in 3 parts:

  • On Thursday I’ll survey the literature on hunter-gatherer cholesterol. What are their numbers really?
  • Next week I’ll continue the Blood Lipids and Infectious Disease series by looking at the immune functions of LDL cholesterol. What happens to LDL when people get infections? Is there an optimal LDL level?
  • In conclusion of the series I’ll return to the issue of human populations – whether hunter-gatherer, horticultural, pastoral, or modern – and what their cholesterol levels tell us about their health. Why do some populations have low serum cholesterol and other populations have much higher cholesterol?

This might lead us into issues such as: Has there been recent human evolution toward higher cholesterol levels? Are there biological differences in optimal cholesterol levels among different human populations – for instance, Africans and Eurasians, or aboriginal populations and descendants of Neolithic farmers?

Should be fun!

Related Posts

The posts in this series are:

References

[1] Eaton SB, Konner M, Shostak M. Stone agers in the fast lane: chronic degenerative diseases in evolutionary perspective. Am J Med. 1988 Apr;84(4):739-49. http://pmid.us/3135745. Full text: http://www.direct-ms.org/pdf/EvolutionPaleolithic/EatonStone%20Agers%20Fast%20Lane.pdf

[2] O’Keefe JH Jr, Cordain L, Harris WH, Moe RM, Vogel R. Optimal low-density lipoprotein is 50 to 70 mg/dl: lower is better and physiologically normal. J Am Coll Cardiol. 2004 Jun 2;43(11):2142-6. http://pmid.us/15172426.

[3] Konner M, Eaton SB. Paleolithic nutrition: twenty-five years later. Nutr Clin Pract. 2010 Dec;25(6):594-602. http://pmid.us/21139123. Full text: http://ncp.sagepub.com/content/25/6/594.full.

Is Shou-Ching to blame for our rice habit?

I thought I’d interrupt the lipid series to talk about the place of rice in our diet. This is also an opportunity to explain to those who haven’t read the book the logic underlying our diet.

The occasion: Cliff at PaleoHacks questioned our endorsement of white rice:

White rice is touted to be basically pure starch by Paul Jaminet on the basis that Asian people eat it so it must be healthy right?

Not exactly. Cliff goes on to express concern about phytate toxicity and low nutrient density. Rose (in the comments) was concerned about beriberi (thiamin deficiency disease).

There were a lot of great replies, especially Melissa McEwen’s. (Melissa found some statistics on the fraction of phytate destroyed by cooking, and improved Wikipedia’s data on phytic acid content of foods.) I got a laugh out of John Naruwan’s answer (which he intended to be humorous):

My theory on Jaminet’s apparent love of white rice is his Chinese wife. My own wife is Chinese (well, Taiwanese). When I explain that maybe white rice is not so good for optimal health, I get the speech about Chinese people eating rice for thousands of years, blah blah blah. Bottom line: you try telling a Chinese person that rice is anything less than good for you and you happen to be that person’s husband, well, basically you’ll be sleeping on the sofa for a week.

In fact Shou-Ching is as interested in good health as I am. She often makes the point that in traditional Chinese cooking rice was eaten more as a palate cleanser than as a staple calorie source. We like white rice, but if evidence showed it to be unhealthy we’d be equally quick to stop eating it.

And, John – Shou-Ching is so nice, when she gets mad at me she goes out and sleeps on the sofa!

The Logic Behind Our Diet

Although we consider our diet to be a “Paleo” and “Pacific Islander” diet (by the way – read Jamie Scott’s report from Vanuatu if you haven’t already!), we did not construct the diet according to the syllogism, “People (from the Paleolithic, or East Asia, or any other place or time) ate this way, and were healthy, so we should eat that way too.”

Rather, our approach is more reductionist and centered around nutrients and toxins. Our diet aims to simultaneously achieve two ends:

  • Obtain enough of every nutrient to be fully nourished. It shouldn’t be possible to improve health by adding further nutrients.
  • Eat so as to minimize the diet’s toxicity, by eating very little of any one toxin. Since “the dose makes the poison,” tiny quantities of diverse food toxins can be tolerated, but no one toxin should be abundant in the diet.

A third principle is that meals should be tasty and delicious. We believe our innate taste preferences evolved to help us be healthy, and therefore pleasurable meals are healthful meals. (This was our sticking point with Stephan Guyenet’s interpretation of food reward: see Thoughts on Obesity Inspired by Stephan, June 2, 2011.) Apart from healthfulness, however, we consider tastiness of food to be a positive value in its own right. Luckily we believe the most healthful diet is also the tastiest!

The Place of Rice in Our Diet

Any food which is low in toxins can be included in our diet. Low toxicity is the key, because a missing nutrient can be obtained from other foods – or from a multivitamin or supplement. But there are usually no antidotes to a toxic food.

Rice is very low in toxicity. Most rice toxins reside in the bran, so milled white rice is already low in toxins. The great majority of white rice toxins are destroyed in cooking.

As a result, cooked white rice is almost toxin free. Cliff worried about phytic acid, but the amounts in cooked white rice are small – lower than almost all other seeds, nuts, grains, and legumes, and about one-twentieth the level found in such foods as sesame seeds, Brazilnuts, and pinto beans, as Wikipedia (and Melissa) have pointed out.

Phytic acid is also not all that dangerous. It is a mineral chelator, which leads to minerals being excreted rather than absorbed. The primary risk is that it will induce a mineral deficiency. Because phytic acid preferentially binds iron, which can be dangerous, some advocate its supplementation.

We don’t agree with that, but we don’t consider the small amount of phytic acid in rice to be dangerous, especially given that we recommend a mineral-rich diet and supplementation with both a multivitamin and specific key minerals.

Optimize Diet, Not Foods

Nutrient density of an individual food is not an overriding concern. Only the diet needs to be optimized – not individual foods. It’s OK to eat a food that is low in nutrient density if other nutrient-rich foods make up for it.

Our diet derives only about 20% of calories from carbs. Even for rice lovers, rice is unlikely to provide more than half that, or 10% of energy. If rice is half as nutrient dense as alternative “Paleo” starches, it diminishes nutrient intake by only 5%. That’s easy enough to make up by eating more vegetables, liver, and eggs – or by taking a multivitamin.

Many Paleo dieters speak of “cheat” foods, as if it was somehow immoral, or a violation of the diet, to eat them. There are no “cheat foods” on our diet.

For instance, we’ll often eat strawberries with whipped cream sweetened with rice syrup. This is low in nutrients, but also low in toxins. It would not do as the primary food of the day, but as a dessert or snack it is quite healthy.

Glucose is a Nutrient

This is a point many low-carb dieters seem to forget. Macronutrients are nutrients too.

The body needs glucose. Glycoproteins and polysaccharide molecules like glycosaminoglycans are important structural components of the body; certain cell types rely on glucose for energy; and the immune system relies on glucose for generation of reactive oxygen species to kill pathogens.

If no carbs are eaten, the body has to generate glucose from protein. Glucose production may be insufficient or suboptimal. That was the point of our Zero-Carb Dangers series.

Of course, in excess glucose could become a toxin. But the same can be said for protein and polyunsaturated fats. We don’t exclude meat or salmon from the diet because they can be over-eaten. One shouldn’t exclude rice either.

Conclusion

A healthy diet should contain a diversity of foods. This will reduce the diet’s toxicity, improve micronutrient ratios, and increase meal pleasurability.

Rice should not provide a large share of dietary calories – probably not more than 10% – but there is no reason to reject it merely because it is a grain. True, it comes from a bad family. But it’s the good child. Don’t hold its relatives against it.

Can Endurance Exercise Promote Cancer?

I got into a bit of trouble in the comments a few weeks back when I joked that Grete Waitz may have died from marathoning. Steve replied:

Paul, you said “… marathoning (from which Grete Waitz just died at 57)”

Gee. The news said cancer. How confident are you that she died “from” running marathons?

Of course, not confident at all. Maybe if she’d been a sprinter she would have died at 54. Maybe if Lance Armstrong had been a couch potato he would still have had testicular cancer metastasized to his brain and lung at age 25.

A few days ago I got an email. Two highly fit endurance athletes, both of whom have always tended to their health and been careful to eat “healthy” (i.e. vegetable and whole grain rich, meat and fat poor) diets, have contracted cancers in the prime of life and been given less than a year to live. My correspondent asked, “Why?”

Let’s look into this. Is it possible that endurance exercise, especially if combined with a high-carb diet, may promote cancer?

Oxidative Damage to DNA and Cancer

Human DNA is constantly being damaged and repaired. It’s been estimated that over the course of a cell cycle – that is, from the time a cell is formed to the time it divides into two daughter cells – a human cell develops 5,000 single-stranded DNA breaks due to oxidative damage from reactive oxygen species (ROS). The vast majority are repaired by the body’s DNA repair machinery. [1]

However, in typical human cells 0.1% or 5 are not successfully repaired; instead a corresponding break is created in the complementary DNA strand, resulting in a double-strand break. In people with Bloom syndrome, an inherited condition which creates a strong predisposition to cancer, fully 1% or 50 are not successfully repaired. [1]

The double-strand break leads to a re-arrangement or “translocation” of parts of the chromosome. Usually, this does not break the coding region for a protein, but it does break non-coding regions resulting in changes to gene expression.

These sorts of genetic changes are observed both in cancer and in aging. [1] In short, oxidative damage to DNA is considered a risk factor for cancer development.

Oxidative Damage to DNA Has Been Specifically Linked to Endurance Exercise

Diets and activities that increase oxidative stress – for instance, diets deficient in antioxidant minerals – can therefore increase cancer risk. And diets and activities that minimize oxidative stress can minimize cancer risk and facilitate recovery.

Endurance exercise generates oxidative stress. Marathon running “caused a large increase in the tissue content of oxidized glutathione (189%) at the expense of reduced glutathione (-18%).” [2]

Moreover, endurance exercise damages DNA:

Both a systemic inflammatory response as well as DNA damage has been observed following exhaustive endurance exercise….

Extremely demanding endurance exercise has been shown to induce both a systemic inflammatory response [15, 42, 53, 71] as well as DNA damage [21, 36, 58, 62, 80]….

Exercise-induced DNA damage in peripheral blood cells appear to be mainly a consequence of an increased production of reactive oxygen and nitrogen species (RONS) during and after vigorous aerobic exercise [58]. Besides oxidative stress, other factors such as metabolic, hormonal and thermal stress in addition to the ultra-structural damage of muscle tissue are characteristic responses to prolonged strenuous exercise, that can lead to the release of cytokines, acute phase proteins and to the activation or inhibition of certain lines of the cellular immune system [15, 29]. [3]

There seems to be a big difference between moderate exercise and exercise to exhaustion. Moderate exercise actually protects DNA by upregulating DNA repair:

Sato et al. showed that acute mild exercise as well as chronic moderate training does not result in DNA damage, but rather leads to an elevation in the sanitization system of DNA damage [66]. [3]

However, endurance exercise leads to increased DNA damage:

Increased levels of DNA strand breaks were observed after exhaustive treadmill running in subjects of different training status [22, 45]….

In conclusion, there is growing evidence that strenuous exercise can lead to DNA damage that with few exceptions [36] is predominantly observed not before 24 h after the resolution of exercise [21, 44, 45, 80]. [3]

In addition, strenuous endurance exercise induces hormonal and other changes which might promote cancer. An Ironman triathlon has significant effects on hormones and inflammatory markers, some of which persist for more than 19 days post-race:

Briefly, as described in details elsewhere [42], there were significant (P<0.001) increases in total leukocyte counts, MPO, PMN elastase, cortisol, CK activity, myoglobin, IL-6, IL-10 and hs-CRP, whereas testosterone significantly (P<0.001) decreased compared to pre-race. Except for cortisol, which decreased below pre-race values (P<0.001), these alterations persisted 1 d post-race (P<0.001, P<0.01 for IL-10). Five days post-race CK activity, myoglobin, IL-6 and hs-CRP had decreased, but were still significantly (P<0.001) elevated. Nineteen days post-race most parameters had returned to pre-race values, with the exception of MPO and PMN elastase, which had both significantly (P<0.001) decreased below pre-race concentrations, and myoglobin and hs-CRP, which were slightly, but significantly higher than pre-race [42]. [3]

In the opinion of the authors of this review, the biggest problem is production of reactive oxygen and nitrogen species (RONS) by damaged immune cells:

The most conclusive picture that emerges from the available data is that oxidative stress seems to be the main link between exercise-induced inflammation and DNA damage…. DNA damage in peripheral immuno-competent cells, indeed, most likely resulted from an increased generation of RONS due to initial systemic inflammatory responses or the delayed inflammatory processes in response to muscle damage (Fig. 1). [3]

What About High-Carb Diets?

Do high-carb diets contribute?

During strenuous exercise mitochondria produce oxidation products:

The mitochondrial electron transport system can trigger the formation of superoxide leading to increased production of H2O2 by superoxide dismutase [49], [50]. [4]

In a normal person at rest, about 1-2% of the oxygen utilized by mitochondria ends up in superoxide. [4]

Before we go further let’s take a brief detour into mitochondrial chemistry: specifically, something called the electron transport chain.

Here’s a stylized view:

Source: Wikipedia.

The main point for our purposes is that there are two points of entry into the chain, one that goes through complex I and one that bypasses it.

Glucose metabolism favors entry via complex I, while fatty acid metabolism is relatively more favorable to entry via complex II. Quantitatively, glucose metabolism produces 5 NADH molecules (entering at complex I) for every one succinate molecule (entering at complex II), while fatty acid metabolism produces only 2 NADH for every one succinate.

High-carb dieting tends to habituate the body to metabolism of glucose. Therefore, it increases utilization of complex I.

This is significant because complex I is vulnerable to production of excess oxidative stress under some circumstances.

In principle, every mitochondrial complex has the potential to operate cleanly with minimal production of superoxide. However, if mitochondrial function is in any way impaired, so that operation of a complex is inhibited, then ROS production can rise substantially.

If for some reason electrons cannot flow properly through the electron transport chain, then they leave as superoxide:

One factor which may sensitise cells to increased DNA damage is impaired mitochondrial function [74]…. Reduced electron flow through the mitochondrial respiratory chain, particularly through the inhibition of complex I or complex III, favours the enhanced production of superoxide and H2O2 [75]. Together, with the age-dependent increase in oxidative stress and decline in NAD+ and ATP content, we found a tendency to the reduction in the activity of the respiratory complexes with age in all organs. Sipos et al. (2003) showed that mitochondrial formation of H2O2 due to complex I inhibition is more clinically relevant than ROS production due to inhibition of complex III and IV in situ [76]. [4]

What exactly did Sipos et al. find?  They state:

ROS formation was not detected until complex III was inhibited by up to 71 +/- 4%, above that threshold inhibition, decrease in aconitase activity indicated an enhanced ROS generation. Similarly, threshold inhibition of complex IV caused an accelerated ROS production. By contrast, inactivation of complex I to a small extent (16 +/- 2%) resulted in a significant increase in ROS formation, and no clear threshold inhibition could be determined. [5]

Basically, superoxide can be generated in complexes I, III, and IV. However, in complexes III and IV, there is a high threshold of inhibition of electron transport before any superoxide is produced. In complex I, there is no threshold:  even very slight inhibition will generate ROS. This means that during practical living, the great majority of excess ROS is produced from complex I.

This means that high-carb dieting, which increases utilization of complex I, will tend to generate oxidative stress if there is any inhibition of complex I.

But in endurance exercise, there is inhibition of complex I. To name just one pathway, exercise increases levels of the hormone DHEA, and DHEA inhibits complex I. [6]

It looks like high-carb diets and endurance exercise may be a bad combination.

Are Whole Grains Especially Bad?

There may be specific problems with grain toxins. For instance, wheat germ agglutinin, a wheat toxin that is very effective at distributing itself through the body through transcytosis, is able to damage mitochondria:

WGA induced a loss of transmembrane potential, disruption of the inner mitochondria membrane, and release of cytochrome c and caspase-9 activation after 30 min of cell interaction. [7]

At high doses in test tubes this can lead to cell death. It’s conceivable that at physiological levels WGA damage to mitochondria might mildly inhibit complex I and increase oxidative stress.

Of course, any deficiency in antioxidant minerals zinc and copper, which dismutate superoxide to hydrogen peroxide which is then disposed of by glutathione peroxidase (a selenium containing enzyme), would increase oxidative stress. Wheat contains phytic acid which chelates minerals and reliance on wheat as a calorie source may impair antioxidant status.

Conclusion

I don’t want to exaggerate the risks of endurance sports. With the exception of melanoma [8], there isn’t a clear increase in cancer incidence among marathon runners. And if this post seemed a bit tortuous, it’s because there’s no simple “smoking gun” pathway connecting endurance exercise to cancer.

On the other hand, endurance exercise is probably not as healthy, in terms of cancer risk, as shorter-duration activities. Also, the risk may rise substantially on high-carb or wheat-based diets. There are at least a few plausible mechanisms, not all of which I’ve discussed here, that might connect endurance exercise on grain-based high-carb low-fat diets to cancer.

References

[1] Vilenchik MM, Knudson AG. Endogenous DNA double-strand breaks: production, fidelity of repair, and induction of cancer. Proc Natl Acad Sci U S A. 2003 Oct 28;100(22):12871-6. http://pmid.us/14566050.

[2] Cooper MB et al. The effect of marathon running on carnitine metabolism and on some aspects of muscle mitochondrial activities and antioxidant mechanisms. J Sports Sci. 1986 Autumn;4(2):79-87. http://pmid.us/3586108.

[3] Neubauer O et al. Exercise-induced DNA damage: is there a relationship with inflammatory responses? Exerc Immunol Rev. 2008;14:51-72. http://pmid.us/19203084.

[4] Braidy N et al. Age related changes in NAD+ metabolism oxidative stress and sirt1 activity in wistar rats. PLoS One. 2011 Apr 26;6(4):e19194. http://pmid.us/21541336.

[5] Sipos I et al. Quantitative relationship between inhibition of respiratory complexes and formation of reactive oxygen species in isolated nerve terminals. J Neurochem. 2003 Jan;84(1):112-8. http://pmid.us/12485407.

[6] Safiulina D et al. Dehydroepiandrosterone inhibits complex I of the mitochondrial respiratory chain and is neurotoxic in vitro and in vivo at high concentrations. Toxicol Sci. 2006 Oct;93(2):348-56. http://pmid.us/16849397

[7] Gastman B et al. A novel apoptotic pathway as defined by lectin cellular initiation. Biochem Biophys Res Commun. 2004 Mar 26;316(1):263-71. http://pmid.us/15003540.

[8] Ambros-Rudolph CM et al. Malignant melanoma in marathon runners. Arch Dermatol. 2006 Nov;142(11):1471-4. http://pmid.us/17116838.