Category Archives: Carbohydrates

Higher Carb Dieting: Pros and Cons

Last week’s post (Is It Good to Eat Sugar?, Jan 25, 2012) addressed what I see as the most problematic part of the thought of the health writer Ray Peat – his support for sugar consumption.

Apart from this difference, “an extreme amount of overlap is evident,” Danny Roddy notes, in our views and Peat’s. Both perspectives oppose omega-6 fats, support saturated fats, favor eating sufficient carbs to normalize metabolism, support eating nourishing foods like bone broth, and oppose eating toxic foods like wheat.

If there is another difference between our ideas and Peat’s, it’s that “Peat-atarians” often eat more carbs. Danny puts it:

Paul and Peat have similar recommendations for carbohydrate consumption. Paul’s recommendations hover around 150 grams while Peat usually recommends 180-250 grams, but he himself eats closer to ~400 grams.

So I thought it might be worth looking at the issue of overall carb consumption.

Carbs for Hypothyroidism

In Is There a Perfect Human Diet? (Jan 18, 2012) we noted that diseases can change the optimal diet. In some diseases it’s better to lower carb consumption, but in others it’s better to increase carb consumption. The example we gave is hepatitis; hepatitis B and C viruses can exploit the process of gluconeogenesis to promote their own replication, so high-carb diets which avoid gluconeogenesis tend to slow down disease progression.

Another disorder that might benefit from more carb consumption is hypothyroidism. A number of people with hypothyroidism have benefited from Peat-style carb consumption. Here is ET commenting on last week’s post:

As someone following the PHD with a good dash of Peat, I really enjoy this post and the comments. Thank you Paul….

Paul says that “I’m not persuaded that it’s a desirable thing to keep liver glycogen filled at all times, but for some health conditions it may be good to tend that way, like hypothyroidism.” Well, according to Chris Kresser, 13 of the top 50 selling US drugs are either directly or indirectly related to hypothyroidism. If going by either the low body temperature/low pulse diagnostic, and/or some kind of pattern on the serum tests (Anti-TG, TPO, TSH, free T-3, free T4, total T3, total T4), we are talking a significant proportion of the population, especially women, being hypothyroid in some form….

Many with low T3 have a conversion problem from T4 in the liver (80% of T3 is converted from T4 in the liver and kidneys – only a small portion is coming from the thyroid gland).

Is it a good idea to NOT try to fill the liver glycogen in such a pattern? For those who have lived with the consequences of low T3 (adrenaline rush, waking up in the middle of the night, fatigue, tendency to orange-yellowish color i the face etc.), and had improvements on a more Peat like diet, I do not think so.

The way to fill liver glycogen, of course, is by eating more carbs.

I’ve previously noted that increased carb consumption upregulates the levels of T3 thyroid hormone (Carbohydrates and the Thyroid, Aug 24, 2011):

T3, the most active thyroid hormone, has a strong effect on glucose utilization. T3 stimulates glucose transport into cells, and transport is the limiting factor in glucose utilization in many cell types. In hyperthyroidism, a condition of too much T3, there are very high levels of glucose utilization. Administration of T3 causes elevated rates of glycolysis regardless of insulin levels.

The body can reduce T3 levels by converting T4 into an inactive form called reverse T3 (rT3) rather than active T3. High rT3 levels with low T3 levels lead to reduced glucose transport into cells and reduced glucose utilization throughout the body.

This means that eating more carbs raises T3 levels, and eating fewer carbs lowers T3 levels.

For a hypothyroid person, then, eating more carbs is an alternative tactic for increasing thyroid hormone activity. It may provide symptomatic relief similar to that achieved by supplementing thyroid hormone directly.

Perhaps the two are complementary tactics that should be done together. Taking thyroid hormone pills will increase glucose utilization, creating a need to eat more carbs. A mix of the two tactics may be optimal.

UPDATE: Mario points out that most cases of hypothyroidism in advanced countries are due to Hashimoto’s, an autoimmune disease probably triggered by infections or gut dysbiosis, and eating more carbs will tend to flare any gut dysbiosis and thus aggravate the thyroiditis. Meanwhile, supplemental thyroid hormone tends to reduce antibody activity.

Carbs for Mood

Another interesting comment came from Jim Jozwiak:

Paul, this discussion gets to the crux of what I do not understand about the Perfect Health Diet. You are speaking as if refilling liver glycogen is a good thing, and it undoubtedly is, because mood is so much better when there is sufficient liver glycogen because then the brain is confident of its power supply. Also, you acknowledge that safe starch would eventually replenish liver glycogen after muscle glycogen is topped off. So why not eat enough starch to replenish liver glycogen? It is not so difficult to figure out how much that would be. Have some sugar, feel what replenished liver glycogen is like, then titrate safe starch gradually meal-by-meal to get the same effect. When I do it, and I am not an athlete, I get 260 grams of non-fiber carb per day, which is considerably more than you usually recommend. Have you tried this experiment and found the result unsatisfactory in some way?

Jim has experimented to find the amount of carbs that optimize his mood, and found it to be 260 g (1040 calories). On a 2400 calorie diet, typical for men, this would be 43% carbs.

If Peat typically recommends 180 to 250 g carbs, as Danny says, then on a 2000 calorie reference diet that would be 36% to 50% carbs.

Those numbers are strikingly similar to another statistic: The amount of carbs people actually eat in every country of the world.

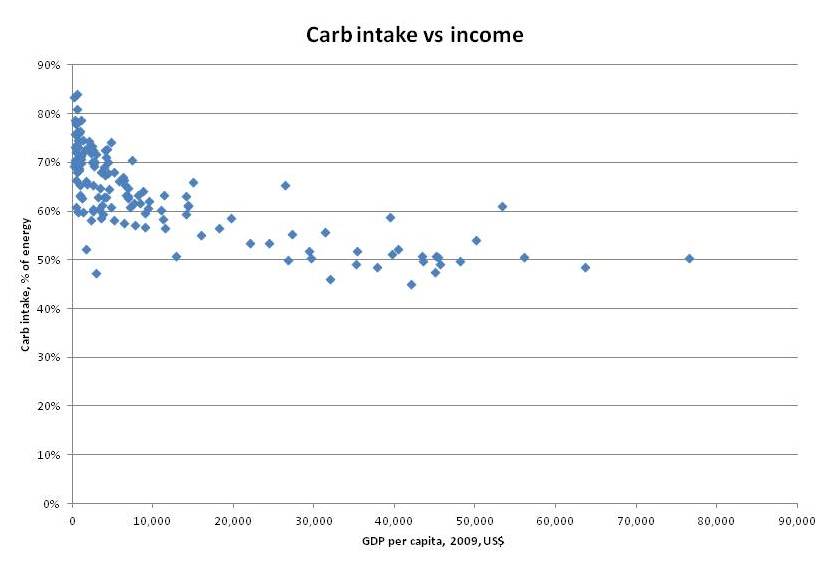
Here is a scatter plot of carb consumption vs per capita income by country. Dietary data comes from the FAO, income is represented by GDP per capita from the IMF:

At low incomes people eat mainly carbs, because the agricultural staples like wheat, rice, corn, and sorghum provide the cheapest calories.

As incomes rise, carb consumption falls, but it seems to approach an asymptote slightly below 50% carbs. The lowest carb consumption was France at 45%, followed by Spain, Australia, Samoa, Switzerland, Iceland, Italy, Austria, Belgium, and Netherlands.

We can guess that if money were no object, and people could eat whatever they liked, most people would select a carb intake between 40% and 50%.

This is precisely the range which Jim found optimized his mood.

The Longevity vs Fertility and Athleticism Trade-off

I won’t enumerate studies here, but animal studies indicate that higher carb and protein intakes promote fertility and athleticism, while restriction of carbohydrate and protein promotes longevity.

In our book, we calculate the daily glucose requirements of the human body at around 600 to 800 calories, or 30% to 40% of energy on a 2000-calorie diet.

So a 30-40% carb diet is a neutral diet, which probably places minimal stress on the body.

A 40-50% diet is a carb-overfed diet, which probably promotes fertility and athleticism.

A 20-30% diet is a mildly carb-restricted diet, which probably promotes longevity.

Do we see diminished longevity with higher carb consumption in human epidemiological data? I think so.

It’s useful to compare European countries, since they are genetically and culturally similar. There is a correlation between carbohydrate intake and longevity. Here is a list of life expectancy among 46 European countries. Neglecting little countries like Monaco, San Marino, and Andorra, that are not in my carb database, the countries with the longest life expectancy are also the ones with the lowest carb consumption: Italy first, France second, Spain third, Switzerland fourth, and Iceland sixth are all countries with carb intake below 50%. Sweden, at 50.8% carbs, placed fifth in longevity.

Did Evolution Hardwire a Preference for Carbs?

We know that the brain has an innate food reward system which tries to get people to eat a certain diet. What carbohydrate intake is it likely to select for?

Experiments on the food preferences of insects and rodents give us clues. The paper “Macronutrient balance and lifespan,” by Simpson and Raubenheimer, cited some time ago by Dennis Mangan, summarizes evidence from animals for the influence of macronutrients on lifespan. A good example is the fruit fly; protein has the dominant effect on lifespan, with low protein favoring longevity and high protein favoring fertility. The flies eat so as to maximize fertility:

The response surface for lifetime egg production peaked at a higher protein content than supported maximal lifespan (1:4 P:C, Figure 1A). This demonstrates that the flies could not maximize both lifespan and egg production rate on a single diet, and raises the interesting question of what the flies themselves prioritized – extending lifespan or maximizing lifetime egg production. Lee et al. [3] answered this by offering one of 9 complementary food choices in the form of separate yeast and sugar solutions differing in concentration. The flies mixed a diet such that they converged upon a nutrient intake trajectory of 1:4 P:C, thereby maximizing lifetime egg production and paying the price of a diminished lifespan.

This seems to be the evolutionary preference in mammals as well as flies. When unlimited food is available, animals tend to overfeed slightly on carb and protein, sacrificing lifespan for increased fertility and athleticism.

Jim reported improved mood on a 43% carb diet. Is it due to the filling of liver glycogen raising metabolism? Due to a sensation of enhanced fertility, libido, and athleticism? Or simply due to greater satisfaction of the brain’s reward system?

Yet another factor may also be involved.

Might Stress Be Mistaken for Enhanced Energy?

Peat favors sucrose as a carb source, which is why Danny Roddy recommended orange juice and Travis Culp soda. I argued in last week’s post that it would be better to eat a starchier diet so that the carb breakdown would be at least 70% glucose, less than 30% fructose and galactose.

Eating a higher-carb diet fills up liver glycogen, removing the most rapid fructose disposal pathway. This makes a high-carb sucrose-based diet rather stressful for the body; it has to dispose of fructose rapidly to avoid toxicity, but has limited ability to do so.

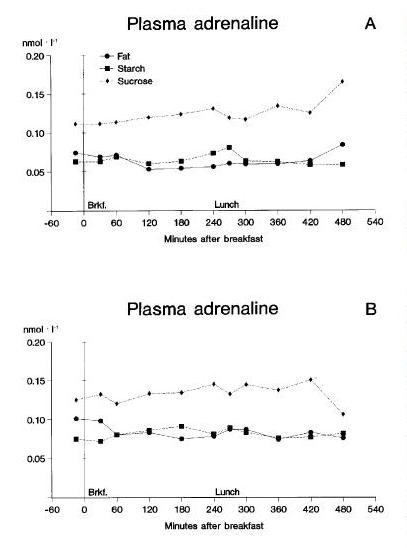
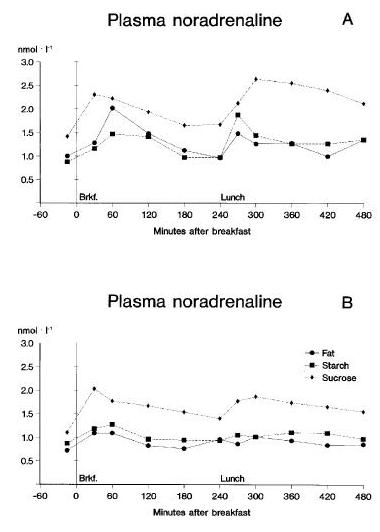
We can see the stressfulness of sucrose by its effects on the “fight-or-flight” stress hormones adrenaline (epinephrine) and noradrenaline (norepinephrine). Here is a study that fed high-fat, high-starch, and high-sucrose diets for 14 days to healthy non-obese subjects, and measured the hormonal response [1; full text]. This paper was discussed by the blog Proline (hat tip: Vladimir Heiskanen). The results:


On high-fat and high-starch diets, adrenaline and noradrenaline levels are low; they are consistently elevated — almost doubled — on the high-sucrose diet.

This makes sense; as Wikipedia notes,

epinephrine and norepinephrine are stress hormones that underly the fight-or-flight response; they increase heart rate, trigger the release of glucose from energy stores, and increase blood flow to skeletal muscle.

These hormones trigger the release of glucose from liver glycogen, thus freeing up room for fructose disposal.

Note that this result contradicts an assertion by Danny Roddy:

I consider the ability to refill glycogen (minimizing adrenaline & cortisol release) to be an important factor in health.

Refilling glycogen is not the same thing as minimizing adrenaline release. The requirement to dispose of fructose may trigger adrenaline release.

The reason I bring this up is not to renew the starch vs sugar discussion; but rather to ask if this “fight-or-flight” response to sugar consumption may not be partially responsible for the perceived mood and energy improvements on a Peat-style diet.

Indeed, one of the peculiar aspects of Ray Peat’s health advice is his recommendation to increase pulse rates well above normal levels. In his article on hypothyroidism, Peat states:

Healthy and intelligent groups of people have been found to have an average resting pulse rate of 85/minute, while less healthy groups average close to 70/minute.

I would have thought 60 beats per minute was normal, and when I was more athletic my pulse was typically 48 beats per minute.

One of the effects of adrenaline and noradrenaline is to speed up the pulse rate. If Peat really does eat 400 g of carbs per day, predominantly from sucrose, then he may be achieving his high pulse rate from an “adrenaline rush” that helps dispose of an excess of fructose.

If, indeed, this is a source of improved sense of well-being on Peat-style diets, it may be a double-edged sword. Chronic stimulation of the “fight-or-flight” hormones to aid in fructose disposal may have long-run negative consequences.

UPDATE: I’m reminded of this video, showing the adrenaline-promoting effects of sucrose consumption:


Starch would not have had the same effect, and would surely be healthier in the long run.

Summary

It is possible that higher carb intake may increase thyroid hormone levels, fertility, and athleticism, and enhance mood in some people. These gains do not come without cost. Notably, they probably involve a sacrifice of longevity.

If the benefits of higher carb intake are sought, it is best to achieve them by eating starches primarily, not sugar.

Conclusion

In our book, we recommend a slightly low-carb diet of 20-30% of calories. If we were re-writing the book now, we would probably be a bit less specific about what carb intake is best. Rather, we would say that a carb intake around 30-40% is neutral and fully meets the body’s actual glucose needs; and discuss the pros and cons of deviating from this neutral carb intake in either direction.

For most people, I believe a slightly carb-restricted intake of 20-30% of calories is optimal. Most people are not currently seeking to have children or engaging in athletic competition. There is good reason to believe that mild carb restriction maximizes lifespan, and most people desire long life. As we’ve noted, supercentenarians generally eat low-carb, high-fat diets.

But the spirit of our book is to educate, and let everyone design the diet that is best for them. And there is room for difference of opinion about the optimal carb intake.

References

[1] Raben A et al. Replacement of dietary fat by sucrose or starch: effects on 14 d ad libitum energy intake, energy expenditure and body weight in formerly obese and never-obese subjects. Int J Obes Relat Metab Disord. 1997 Oct;21(10):846-59. http://pmid.us/9347402. Full text: http://www.nature.com/ijo/journal/v21/n10/pdf/0800494a.pdf.

Is It Good to Eat Sugar?

A few “Peat-atarians” – followers of the iconoclastic health writer Ray Peat – have accused us of being too skeptical of fructose. They think we should promote sugar consumption.

Here’s Travis Culp:

I think fructose is only conditionally problematic and that the consumption of it alongside glucose at a time of low liver glycogen is highly advantageous. In fact, I would go so far as to say that (somewhat slowly) drinking a can of soda upon waking (as disgusting as that is) would not result in any real glycation, insulin resistance, elevated TGs etc…. I think it’s beneficial to eat something really sugary upon waking …

Here’s Danny Roddy:

Peat has stated that … fructose … “powerfully” refills glycogen …

I would consider the ability to refill glycogen (minimizing adrenaline & cortisol release) to be an important factor in health …

It’s true that the ability to refill glycogen is essential for health; some genetic glycogen storage disorders are fatal in early childhood. But everyone who lacks a glycogen storage disorder has the ability to refill glycogen from multiple sources. In addition to fructose, glucose sugars and starches refill glycogen, as does milk sugar (a compound of glucose and galactose).

So the question is which combination of dietary sugars (a) is best at refilling glycogen and (b) makes the healthiest diet, all things considered?

Sugar Composition of the Diets

Both Danny and Travis framed their arguments as criticisms of our diet. They are really arguing that a Peat-style sugary diet is healthier than a PHD-style moderate-starch diet.

So before going further, let’s look at the sugar content of the diets we’re comparing.

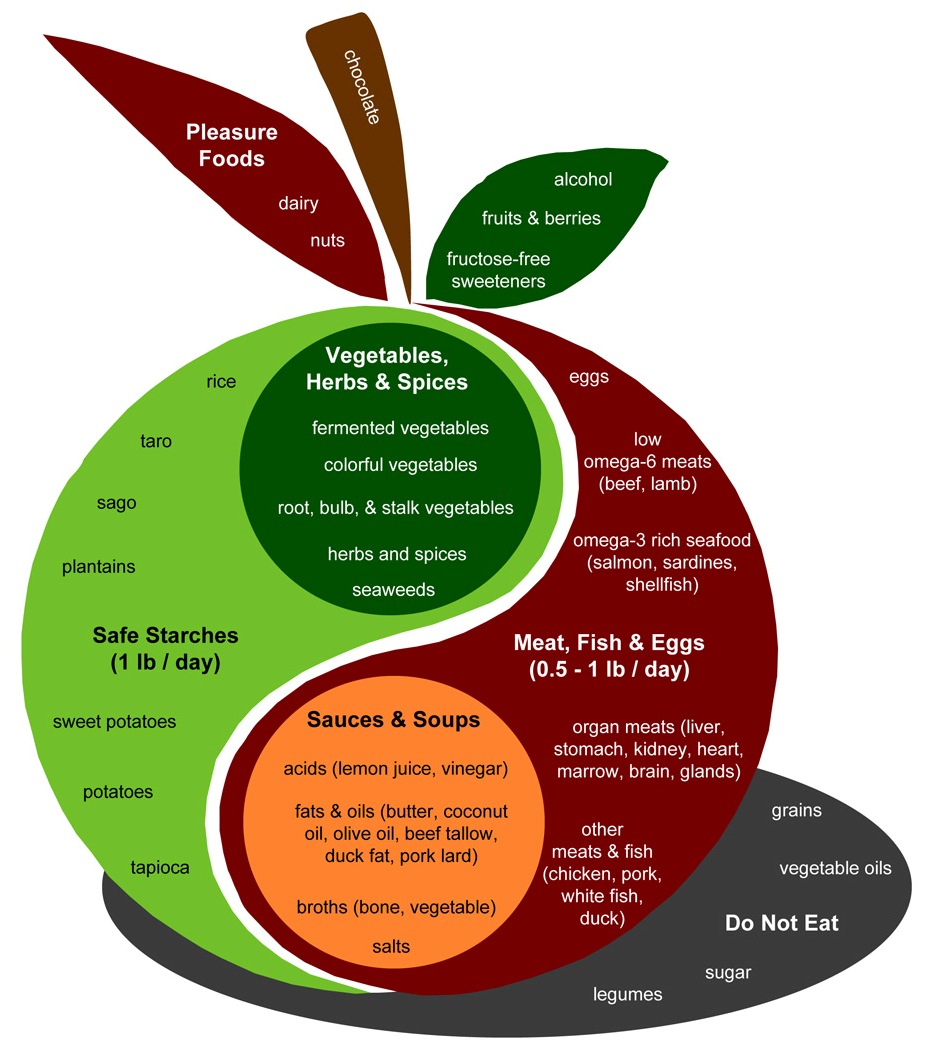
First, note that PHD is not a zero-fructose diet. As an examination of the PHD Food Plate shows, PHD includes many fructose-containing plant foods – fruits, berries, and vegetables such as beets, onions, carrots, and squashes – plus “pleasure foods” like chocolate.

Also, PHD is not a zero-dairy diet, so for many practitioners it will include some milk sugars which are half galactose and half glucose.

In my diet personally, probably about 55% of carb calories come from starches, 30% from fruits, berries, and sugary vegetables, and 15% from dairy products such as yogurt. In terms of simple sugars, this translates to about 77% glucose, 15% fructose, and 8% galactose.

Not every Perfect Health Dieter will have the same sugar proportions; there is no obligation to consume dairy, and the relative proportions of starchy and sugary plants will vary according to taste. But let’s take mine as characteristic PHD proportions.

In a Peat-style diet, in contrast, the breakdown of sugars is near 50% glucose and 50% fructose.

So we aren’t comparing fructose against glucose, but a 77% glucose 15% fructose diet against a 50% glucose 50% fructose diet.

Why the Focus on Refilling Glycogen?

Why do the defenders of sugar focus on its ability to refill glycogen?

The reason is that fructose is treated by the body as a poison. Dietary fructose is shunted to the liver for disposal by conversion to glycogen, fat, lactate, or pyruvate.

Fructose is treated like a poison because it is dangerous. High doses of fructose have observable harmful effects even in short-term studies. Fructose does no good to the liver while it’s there, in fact fructose combined with polyunsaturated fats very effectively creates liver disease. Fructose in any other organ does harm; for instance, fructose promotes cancer growth.

Given fructose’s rapid disposal, any benefits from fructose have to be attributable to the glycogen or other products it is turned into. If fat, lactate, or pyruvate (a glucose product) provided benefits, dietary fats or starches would do the same, without the risk of fructose toxicity or fats getting stuck in the liver due to choline and methionine deficiency. So if fructose is to have benefits, it has to be via glycogen.

Here, then, is the challenge Peat-atarians face. Fructose has many proven harms. It has only one possible benefit: its ability to help re-fill liver glycogen. Peat-atarians have to show two things:

  1. That a diet with Peat-like sugar proportions – roughly 50% fructose, 50% glucose –is better than a diet with PHD-like sugar proportions – 15% fructose, 8% galactose, 77% glucose – at refilling liver glycogen.
  2. That better re-filling of liver glycogen improves the healthfulness of the diet.

How Do Sugars Perform at Refilling Glycogen?

Danny provides no citations for his claim that fructose “powerfully” refills glycogen. But Danny’s commenters help him out.

Daz, drawing upon a New York Times report, offers two studies [1] [2]. Cliff offers several more [3] [4]. Let’s see what these tell us.

The first study, “Fructose and galactose enhance postexercise human liver glycogen synthesis” [1], looks at athletes depleted of liver glycogen by intense cycling, and assessed the effectiveness of three sugar drinks at replenishing liver glycogen. The three drinks were:

  • 2/3 maltodextrin, 1/3 fructose;
  • 2/3 maltodextrin, 1/3 glucose;
  • 2/3 maltodextrin, 1/3 galactose.

Maltodextrin digests to glucose, so all three drinks are majority glucose. The athletes drink 275 calories of these drinks per hour for 6.5 hours after exercise. Galactose is non-toxic, but like fructose tends to be taken up by the liver.

Liver glycogen was measured every two hours with carbon-13 magnetic resonance imaging. Here were the results:

So 67% glucose / 33% galactose did the best, 67% glucose 33% fructose was close behind, and 100% glucose lagged.

Why does the 100% glucose drink underperform? One reason is that fructose and galactose, but not glucose, are preferentially targeted to the liver:

A factor of potentially larger magnitude in enhancing liver glycogen synthesis is the differential postabsorptive fates of fructose and glucose. Glucose is a relatively poor direct substrate for liver glycogen synthesis (24,27). Much of it is released from the liver into the systemic circulation to be stored as muscle glycogen (3,7). In contrast, fructose is primarily taken up by the liver … [1]

The second paper, “Superior endurance performance with ingestion of multiple transportable carbohydrates” [2], did not measure liver glycogen replenishment; instead, it gave its cyclists sugary drinks every 15 minutes throughout an intense 2-hr cycling test, and compared performance. Three different drinks were used: a 67% glucose 33% fructose drink, a 100% glucose drink, and a water-only control group. Performance was best with the 67% glucose 33% fructose drink, intermediate with the glucose drink, and worst with the water drink. The results suggest that the 67% glucose 33% fructose drink was better for liver glycogen replenishment, and that liver glycogen replenishment aided the cyclists’ performance.

The third paper, “Effect of different post-exercise sugar diets on the rate of muscle glycogen synthesis” [3], isn’t available to me electronically, so we’ll have to work from the abstract. It looked at muscle glycogen, measured using biopsies (ouch!), rather than liver glycogen.

It first assessed the effect of different amounts of glucose. It found that 0.7 g/kg body weight of glucose given every 2 hours would maximize the rate of muscle glycogen synthesis. For an 80 kg man, that works out to 56 g or 224 calories of glucose per two-hour period, or 112 calories per hour. Above this amount, the rate of muscle glycogen synthesis is unchanged.

It then compared three formulations at this same 0.7 g/kg body weight dose: 100% glucose, 100% sucrose (50% glucose, 50% fructose), and 100% fructose. Muscle glycogen synthesis rates were:

  • 5.8 mmol/kg/hr with 100% glucose
  • 6.2 mmol/kg/hr with 50% glucose, 50% fructose
  • 3.2 mmol/kg/hr with 100% fructose

If we fit a quadratic curve to these points, it predicts a peak rate of glycogen synthesis with 70% glucose, 30% fructose:

Athletes Agree: More Glucose Than Fructose

Of course, endurance athletes know that it’s beneficial to replenish glycogen during endurance events like marathons and triathlons.

Some authorities, including Tim Noakes, an exercise physiologist who has run over 70 marathons, believe that liver glycogen rather than muscle glycogen is the gating factor in marathon performance. From “The Science of Carbohydrate Loading” by David Peterson:

Remember also that muscle glycogen is committed to be used by muscle and cannot assist in maintaining blood sugar levels. Therefore should no additional carbohydrate be ingested during prolonged exercise, the task of maintaining blood glucose levels rests firmly on the liver’s glycogen stores and gluconeogenesis (the manufacturing of glucose from plasma amino acids). Oxidation of blood glucose at 70-80% VO2 max is about 1.0 g/min or about 60 g/hour. Therefore it can be predicted that even with full glycogen stores, a less conditioned athlete’s liver will be depleted of its carbohydrate within an hour and three quarters of continuous moderate intensity exercise. (Interestingly, the daily carbohydrate requirements of the brain and nervous system alone are enough to deplete the liver glycogen stores within 24 hours.) Once liver glycogen levels begin to drop and exercise continues the body becomes increasingly hypoglycemic (low blood sugar) mainly because blood glucose is depleted faster than it is replaced by gluconeogenesis. Professor Tim Noakes considers liver glycogen depletion and subsequent hypoglycemia to be the primary factors affecting fatigue and performance during extended duration races and especially in instances where muscle glycogen levels are low as well.

So marathoners and other endurance athletes will want to replenish liver glycogen as rapidly as possible during a race. What mix of sugars do they use?

The popular product is carbohydrate gels that can be swallowed at the same time water is taken. Here are the top carbohydrate gels sold on Amazon:

So the sugar mix ranges from 67% glucose to 100% glucose. No product uses 50% fructose.

Presumably, athletes have done a great deal of personal experimentation and know that these ratios do, indeed, optimize the speed of glycogen replenishment.

When athletes have no need for speed, as when they are carb loading before a marathon, then they eat starches like pasta and bread, not sugar. So to maximize total glycogen status, regardless of speed of filling, a carb mix close to 100% glucose works just fine.

Glycemic Control

The fourth paper, “Acute fructose administration decreases the glycemic response to an oral glucose tolerance test in normal adults” [4], is about how a bit of fructose affects the glycemic response to an oral glucose tolerance test.

It showed that a 9% fructose 91% glucose test (7.5 g fructose, 75 g glucose) produced a lower glucose area under the curve and higher insulin response than a 100% glucose test. Here’s the glucose response:

In general higher insulin and lower glucose is healthier than the reverse, so this is considered an improvement.

Summary of the Data

What these papers show is:

  • Glycogen replenishment proceeds the fastest with a mix of sugars consisting of about 70% glucose and 30% fructose or galactose.
  • Although this wasn’t tested, we can guess that a mix of fructose and galactose would be more effective than fructose alone, since it seems that utilizing multiple carbohydrate pathways is what drives the speedier glycogen replenishment. So the fastest glycogen replenishment might occur with something like 70% glucose 15% fructose 15% galactose.
  • Muscle glycogen replenishment is maximized with a carbohydrate intake of 100 calories per hour.
  • Athletes agree with the research, using carb gel packs that contain typically 30-40 g carbs with a composition of 67% to 100% glucose, 0% to 33% fructose.
  • Glycemic response to a large dose of carbohydrate may be improved by eating a 9% fructose 91% glucose mix.

From these data, I infer that for glycogen replenishment in liver or muscle, a PHD-style carb mix of 77% glucose, 15% fructose, 8% galactose is probably equal or superior to a Peat-style carb mix of 50% glucose, 50% fructose.

Conclusion

For athletes in the midst of a race, or in need of rapid recovery for a second race on the same day, speedy glycogen replenishment may be the endpoint to optimize. If so, they should eat a sugar drink composed of roughly 70% glucose and 30% fructose and galactose.

This is closer to PHD diet ratios than to Danny Roddy’s recommendation of orange juice or Travis Culp’s recommendation of soda!

But for others, speed of glycogen replenishment is hardly likely to be the parameter to optimize. There are unlikely to be significant benefits for non-athletes from replenishing glycogen 6.5% faster, as was found in the muscle glycogen study [3].

Speedier glycogen replenishment is almost the only known benefit to fructose consumption. It’s possible that low fructose doses, about 9% of carb calories (perhaps 2-3% of total calories), may improve glycemic control. This is a lower fructose fraction than is found in PHD, and far below the fructose fraction recommended by Danny and Travis.

Given the known risks of fructose consumption, especially with chronic intake at high doses or in conjunction with polyunsaturated fats, it seems prudent to err on the low side. It seems to me that the Peat-atarians have failed to provide any evidence at all in favor of a higher fructose intake than is provided by the fruits, berries, and sugary vegetables recommended by the Perfect Health Diet, save for athletes in the midst of a race or post-race recovery.

References

[1] Décombaz J et al. Fructose and galactose enhance postexercise human liver glycogen synthesis. Med Sci Sports Exerc. 2011 Oct;43(10):1964-71. http://pmid.us/21407126.

[2] Currell K, Jeukendrup AE. Superior endurance performance with ingestion of multiple transportable carbohydrates. Med Sci Sports Exerc. 2008 Feb;40(2):275-81. http://pmid.us/18202575.

[3] Blom PC et al. Effect of different post-exercise sugar diets on the rate of muscle glycogen synthesis. Med Sci Sports Exerc. 1987 Oct;19(5):491-6. http://pmid.us/3316904.

[4] Moore MC et al. Acute fructose administration decreases the glycemic response to an oral glucose tolerance test in normal adults. J Clin Endocrinol Metab. 2000 Dec;85(12):4515-9. http://pmid.us/11134101.

Safe Starches Symposium: Dr Ron Rosedale

Jimmy Moore is graciously continuing the conversation about safe starches with a post from Dr Ron Rosedale. For those trying to keep track, here’s how the discussion has gone:

Today, I’ll reply to Dr Rosedale.

Dr Rosedale argues that glucose is toxic, so we should want to have less of it in our bodies; and that low-carb diets deliver less of it. He cites a lot of papers on the relationship between blood glucose levels and health, and uses blood glucose levels as a proxy for the level of glucose in the body.

Two basic matters are at issue: (1) What blood glucose level is best for health? (2) Which diet will generate those optimal blood glucose levels?

Let’s look at what the evidence shows.

What Blood Glucose Level is Best for Health?

In my main reply, I had written:

What is a dangerous level of blood glucose?

In diabetics, there seems to be no detectable health risk from glucose levels up to 140 mg/dl, but higher levels have risks. Neurons seem to be the most sensitive cells to high glucose levels, and the severity of neuropathy in diabetes is correlated with how high blood glucose rises above 140 mg/dl in response to a glucose tolerance test. [1] In people not diagnosed with diabetes, there is also some evidence for risks above 140 mg/dl. [2]

Dr Rosedale seemed to feel that this was the weakest point in my argument, and directed his fire here. My statement was a description of what the scientific literature shows, and the adjective “detectable” carries a lot of weight here. To refute my statement, you would have to find study subjects whose blood glucose never goes above 140 mg/dl, and yet show health impairments attributable to glucose.

Dr Rosedale argues there is no threshold separating safe from harmful levels of glucose, because glucose acts as a toxin at all concentrations:

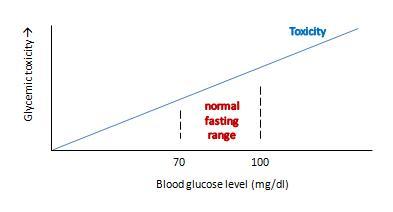
I will spend a fair amount of time and show a fair number of studies to show that there is no threshold. Very simply, the higher the blood sugar rise, the more damage is done in some linear upward slope.

I emailed Ron to make sure that he really did mean there was no threshold, so that glycemic toxicity begins at 0 mg/dl. He replied:

I mean the former; that glucose will cause some damage when above 0 mg/dl … obviously a moot point and theoretical when glucose very low and incompatible with life and likely a minute amount of damage when that low.  At any level of glucose compatible with life some more meaningful degree of glycation, hormonal response and genetic expression will take place.   We will always want/need to repair the damage done to stay alive, but with age the repair mechanisms become damaged also.  Eventually damage outdoes repair and we “age”, acquire chronic disease, and die.

Ron’s view can be graphed like this:

This view makes sense as a matter of molecular chemistry: the number of glycation reactions may be proportional to the concentration of glucose, and if glycation products are health damaging toxins then toxicity may be proportional to glucose levels.

The trouble with this is that it doesn’t really get at what we want to know: what blood glucose level optimizes human health?

If we change the y-axis so that it doesn’t measure glycemic toxicity, but rather overall health of the human organism, then the shape of the curve is going to change in two major ways:

  • First, in translating toxicity to its impact on health, we have to account for Paracelsus’s rule: “the dose makes the poison.” The body can readily repair small doses of a toxin with no ill effect – possibly even a hormetic benefit – but large doses of a toxin multiply damage exponentially and can prove fatal. So the impact of a toxin on health will not rise linearly, but non-linearly with a steeper slope as one moves to the right.
  • Second, we have to account for the fact that glucose has a role as a nutrient. As Ron himself says, having too little blood glucose is “incompatible with life.” So low blood glucose – depriving us of the benefits of normal levels of this nutrient – is a catastrophic negative for health. This means that the left side of the curve needs radical adjustment.

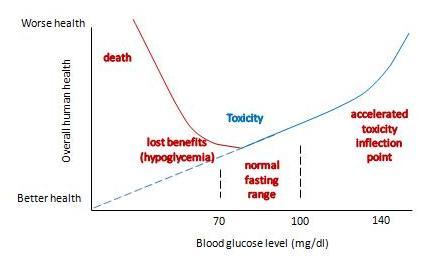
With these two changes, our graph becomes something like this:

It now has a U-shape. I’ve drawn the inflection point where toxicity starts rising rapidly at around 140 mg/dl, and the inflection point on the other side where hypoglycemia causes substantial health damage at around 60 mg/dl. But the precise numbers don’t matter much; the point is that there is a U-shape, and somewhere in that U is a bottom where health is optimized.

What do we know about the precise shape of that U, and the location of the bottom?

We can’t intuit the shape of the bottom of the U using theoretical speculations. Theory doesn’t allow us to balance risks of hypoglycemia against toxicity on such a fine scale. The bottom of the U could be very flat, and it might not matter much whether blood glucose levels are 80 or 100 mg/dl. Or the bottom of the U could be tilted, so that the optimum is either at the low end, near 80 mg/dl, or the high end, near 100 mg/dl.

Empirical evidence is limited. Most studies relating blood glucose levels to health have been done on diabetics eating high-carb diets. There are few studies on healthy people, very few testing low-carb diets, and most are insufficiently powered to determine the precise shape of the bottom of the U.

Dr. Rosedale cites a good selection of studies in his response, and let’s review a representative subset. I was familiar with most of the studies; indeed some were cited in our book’s discussion of the dangers of hyperglycemia.

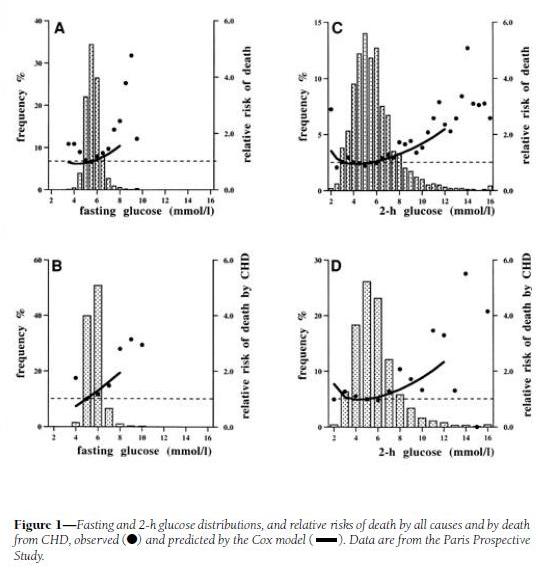
His first cite is “Is there a glycemic threshold for mortality risk?” from Diabetes Care, May 1999, http://pmid.us/10332668. Here is their data:

Look at the black dots, which are the actual data, not the fitted curves which are model-dependent; and at panels A and C, which treat all-cause mortality, not B and D, which are specific for coronary heart disease.

For both fasting and 2-h postprandial blood glucose, the black dots are lowest between about 4.5 and 6.0 mmol/l, which translates to 81 to 108 mg/dl. However, note that there is very little rise in mortality – only about 10% higher relative risk – in 2-h glucose levels of 7 mmol/l, which is 126 mg/dl. Since the postprandial peak is rarely at 2-h (45 min is a common peak), most of these people may well have been experiencing peak levels above 140 mg/dl.

My interpretation: I would say that this study demonstrates that mortality is a U-shaped function of blood glucose levels, but it doesn’t tell us the shape of the bottom of the U. It is consistent with the idea that significant health impairment occurs only with excursions of blood glucose above 140 mg/dl or below 60 mg/dl.

Dr Rosedale’s second cite is actually to a commentary: “‘Normal’ blood glucose and coronary risk” in the British Medical Journal, http://pmid.us/11141131, commenting on a paper by Khaw et al, “Glycated haemoglobin, diabetes, and mortality in men in Norfolk cohort of european prospective investigation of cancer and nutrition (EPIC-Norfolk),” http://pmid.us/11141143.

This study used glycated hemoglobin, HbA1c, which can serve as a measure of average blood glucose over the preceding ~3 weeks. Here is the data:

This supports the “blood sugar should be as low as possible” thesis, since lower HbA1c levels were associated with lower mortality. However, this study has a few flaws:

  • It includes diabetics. Diabetics have poor glycemic control, and episodes of hypoglycemia as well as hyperglycemia, so HbA1c levels (which represent average blood sugar levels) may be a poor proxy for the levels of glycemic toxicity. Also, diabetics are usually on blood-glucose lowering medication, which may distort the blood sugar – mortality relationship.
  • It lumps the population together in very large cohorts. Effectively there were only three cohorts, since the highest HbA1c cohort had only 2% of the sample; the other three cohorts contained 27%, 36%, and 36% of the study population respectively.

We can get a finer grip on what happens by looking at studies that lack these flaws. Here’s one: “Low hemoglobin A1c and risk of all-cause mortality among US adults without diabetes,” Circulation, 2010, http://pmid.us/20923991.

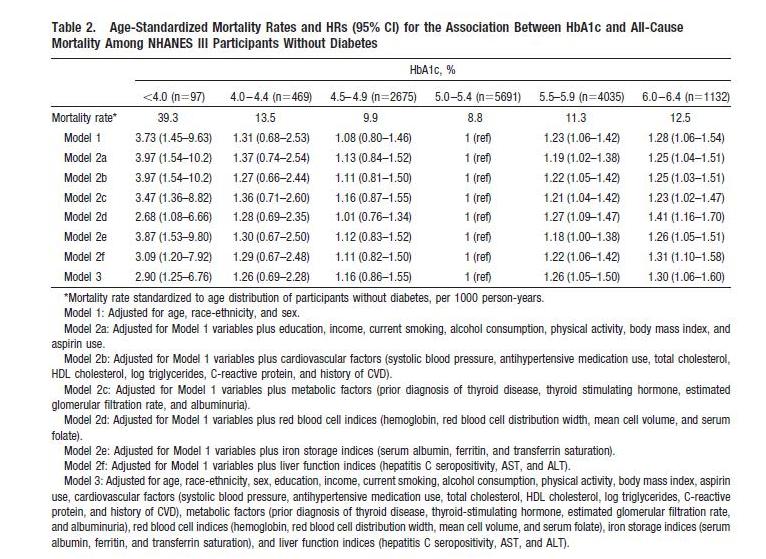
This study is an an analysis of NHANES III; it excludes diabetics and has 3 cohorts, not 1, with HbA1c below 5%. Here’s their data:

The U-shaped mortality curve is very clear. In raw data and all models, the lowest mortality is with HbA1c between 5.0 and 5.4. Mortality increases with every step down in HbA1c: in Model 1, mortality is 8% higher with HbA1c between 4.5 and 4.9, 31% higher between 4.0 and 4.4, and 273% higher below 4.0.

Via Ned Kock of Health Correlator comes a formula for translating HbA1c to average blood glucose levels:

Average blood glucose (mg/dl) = 28.7 × HbA1c – 46.7

Average blood glucose (mmol/l) = 1.59 × HbA1c – 2.59

So the minimum mortality HbA1c range of 5.0 to 5.4 translates to an average blood glucose level of 96.8 to 108.3 mg/dl (5.36 to 6.00 mmol/l).

This result is almost identical to the finding in Dr Rosedale’s first cite, from which Dr Rosedale quoted: “the lowest observed death rates were in the intervals centered on 5.5 mmol/l [99mg/dl] for fasting glucose.”

My interpretation:  Once again, we find that there is a U-shaped mortality curve, and minimum mortality occurs with average or fasting blood glucose in the middle of the normal range – in the vicinity of 100 mg/dl or 5.5 mmol/l.

Let’s finish our examination of this issue with a quick look at Dr Rosedale’s third cite. That paper, “Post-challenge blood glucose concentration and stroke mortality rates in non-diabetic men in London: 38-year follow-up of the original Whitehall prospective cohort study,” Diabetologia, http://pmid.us/18438641, is a familiar one; it was cited in our book (p 36, fn 35).

This study looked at blood glucose levels 2 hours after swallowing 50 grams of glucose, and then followed the men for 38 years to observe mortality rates. CarbSane makes an important observation: this study used whole blood rather than plasma to assay blood glucose. Whole blood has more volume (due to inclusion of cells) but the same glucose, and so less glucose per deciliter. According to this paper, standard (plasma) values are about 25 mg/dl higher, so 95 mg/dl in whole blood actually corresponds to a plasma value of about 120 mg/dl.

Here is the data:

There is no significant difference in mortality among any group with post-challenge whole blood glucose up to 5.29 mmol/l (95 mg/dl), corresponding to 120 mg/dl or 6.7 mmol/l in standard measurements.

The study was designed to look at high blood glucose levels: there were 4 cohorts in the top 10% of blood glucose levels, but the bottom cohort in blood glucose had fully 31% of the sample. This cohort consisted of everyone with 2-hr whole blood glucose levels below 68 mg/dl, or plasma glucose below about 90 mg/dl. Mortality in this large group was indistinguishable from that in the next two groups, who had plasma glucose between 90 and 120 mg/dl.

My interpretation: This study wasn’t designed to observe the lower end of the U. At the higher end, it is consistent with the other studies: mortality rises with 2-hr plasma glucose above 120 mg/dl.

Summary: Optimal Blood Glucose Levels

All of the papers cited by Dr Rosedale are consistent with this story:

  1. Mortality and health have a U-shaped relationship with blood glucose.
  2. Optimum health occurs at blood glucose levels around 100 mg/dl – at normal levels, not exceptionally low levels.
  3. The impaired health seen with fasting or 2-hr blood glucose levels of 110 or 120 mg/dl may be largely attributable to the portion of the day in which those people experience blood glucose levels over 140 mg/dl.

I should note that Dr Rosedale acknowledges that high-normal blood glucose is better than low blood glucose for some aspects of health, like fertility:

Safe starch proponents say that raising blood glucose and raising insulin is a very natural phenomenon and needn’t be avoided. However, if we evolved in a certain way and with certain physiologic responses to the way we eat, it was not for a long, healthy, post-reproductive lifespan. It was for reproductive success. The two are not at all synonymous, in fact often antagonistic.

He’s saying that higher blood glucose favors “reproductive success,” while lower blood glucose favors “post-reproductive lifespan.” I guess one has to choose one’s priorities. Not everyone will choose maximum lifespan.

But suppose Dr Rosedale is right, and that low blood glucose levels are most desirable for at least some persons. I’m willing to stipulate, for the sake of argument, that optimal health for some persons may occur at below-normal blood glucose levels – say, 80 mg/dl. That brings us to the second issue: which diet will produce these low blood glucose levels?

Which Diet Minimizes Blood Glucose Levels?

If the key to health is achieving below-normal blood glucose levels, then low-carb diets are in trouble.

In general, very low-carb diets tend to raise fasting blood glucose and 2-hr glucose levels in response to an oral glucose tolerance test.

This is a well-known phenomenon in the low-carb community. When I ate a very low-carb diet, my fasting blood glucose was typically 104 mg/dl. Peter Dobromylskyj of Hyperlipid has reported the same effect: his fasting blood glucose is over 100 mg/dl. From one of Peter’s posts:

Back in mid summer 2007 there was this thread on the Bernstein forum. Mark, posting as iwilsmar, asked about his gradual yet progressively rising fasting blood glucose (FBG) level over a 10 year period of paleolithic LC eating. Always eating less than 30g carbohydrate per day. Initially on LC his blood glucose was 83mg/dl but it has crept up, year by year, until now his FBG is up to 115mg/dl….

I’ve been thinking about this for some time as my own FBG is usually five point something mmol/l whole blood. Converting my whole blood values to Mark’s USA plasma values, this works out at about 100-120mg/dl.

Peter notes that low-carb dieters will generally perform poorly on glucose tolerance tests, but that increasing carb intake to about 30% of calories is sufficient to produce a normal response to a glucose challenge:

The general opinion in LC circles is that you need 150g of carbohydrate per day for three days before an oral glucose tolerance test.

This is at the high end of the 20% to 30% of energy (400 to 600 calories on a 2000 calorie diet) that is the Perfect Health Diet recommendation for carbs.

The Kitavans eat more than 60% of calories as carbohydrate, mostly from starches. Their fasting blood glucose averages 3.7 mmol/l (67 mg/dl) (http://pmid.us/12817903).

Studies confirm that high-carb diets tend to lower fasting glucose and to lower the blood glucose response to a glucose challenge. CarbSane forwarded me some illustrative studies:

  • “High-carbohydrate, high-fiber diets increase peripheral insulin sensitivity in healthy young and old adults,” http://pmid.us/2168124. Switching healthy adults to a higher carb diet reduced fasting blood glucose from 5.3 to 5.1 mmol/L (95.5 to 91.9 mg/dl) and reduced fasting insulin from 66 to 49.5 pmol/l.
  • “Effect of high glucose and high sucrose diets on glucose tolerance of normal men,” http://pmid.us/4707966. On diets with glucose as the only carb source, 2-hr plasma glucose after a glucose challenge was 184 mg/dl on a 20% carb diet, 183 mg/dl on a 40% carb diet, 127 mg/dl on a 60% carb diet, and 116 mg/dl on an 80% carb diet. The 80% carb diet was the only one on which blood glucose never went above 140 mg/dl.

This last study did not report fasting glucose, but did track blood glucose for 4 hours after the glucose challenge. If we take the 4-hr blood glucose reading as representative of fasting glucose, we find that dieters eating 60% or 80% carb diets had fasting glucose of 76 and 68 mg/dl, respectively.

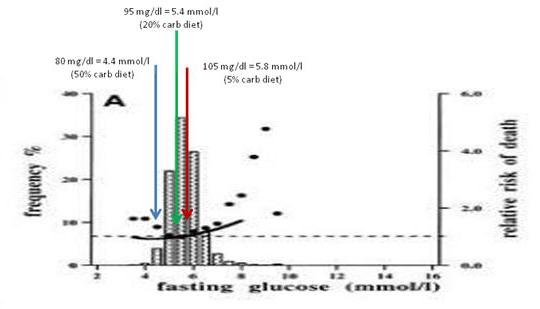
My interpretation of the evidence from multiple sources: A plausible conclusion is that a high-carb diet produces a low fasting glucose (let’s say, 80 mg/dl), a PHD type 20% carb diet an intermediate fasting glucose (95 mg/dl), and a very low-carb diet a high fasting glucose (say, 105 mg/dl).

Just for fun, I decided to see where these fasting glucose levels show up on the mortality plot from Balkau et al:

The 20% carb diet lines up pretty well with the mortality minimum, and both high-carb and very low-carb diets wind up at bins with slightly elevated mortality.

Now, I don’t believe we can infer from data on high-carb dieters what the relationship between blood glucose levels and mortality will be in low-carb dieters. It was Dr Rosedale, not me, who introduced this study into evidence.

But if we believe that lowest mortality really does occur with 2-hr post-challenge blood glucose around 100 mg/dl and fasting blood glucose below 100 mg/dl, as argued by the studies Dr Rosedale cited, and that this result applies to low-carb dieters, then I think the evidence is clear. One must eat some carbohydrates – at least 20-30% of energy.

This is the standard Perfect Health Diet recommendation. It seems that Dr Rosedale is supporting my diet, not his!

What About Diabetics?

Perhaps the boldest passage in Dr Rosedale’s reply was this:

We are all metabolically damaged to some extent. None of us has perfect insulin and leptin sensitivity….  It is for that reason that I say that we all have diabetes, some more than others, and should all be treated as such.

Well, if we all have diabetes, more or less, then I guess I have to consider whether our regular diet – which recommends about 20% of energy (400 calories) as carbs – is healthy for diabetics.

Now, before I begin this discussion, let me say that I don’t claim that this is optimal for diabetics. I think it is still an open question what the optimal diet for diabetics is, and different diabetics may experience a different optimum. I have often said that diabetics may benefit from going lower carb (and possibly higher protein) than our regular dietary recommendations. However, Dr Rosedale is here saying that even a healthy non-diabetic should eat a diet that is appropriate for diabetics. I want to see whether our regular diet meets that standard.

How do diabetics do on a 20% carb diet? Here’s some data that I found in a post by Stephan Guyenet at Whole Health Source. It’s from a 2004 study by Gannon & Nuttall (http://pmid.us/15331548) and the graph is from a later paper by Volek & Feinman (http://pmid.us/16288655/). Over a 24 hour period, blood glucose levels were tracked in Type II diabetics on their usual diets (blue and grey triangles) and after 5 weeks on a 55% carb – 15% protein – 30% fat (yellow circles) or 20% carb – 30% protein – 50% fat diet (blue circles):

The low-carb diet was a little higher in protein and lower in fat than we would recommend, but very close overall to our recommendations and spot-on in carbs.

What happened to blood glucose? It came close to non-diabetic levels. Fasting blood glucose dropped to 7 mmol/l (126 mg/dl), roughly the level at which diabetes is diagnosed. Postprandial blood glucose elevations were modest – peaking below 160 mg/dl which is about 20 mg/dl higher than in normal persons. Average daily blood glucose looks to be around 125 mg/dl.

What would have happened on a zero-carb diet? Fasting blood glucose probably would still have been elevated, near 126 mg/dl; this is common in diabetics because the loss of pancreatic beta cells creates a glucagon/insulin imbalance that leads to elevated fasting blood glucose. This blood glucose level would have been maintained throughout most of the day, with the postprandial peaks and troughs flattening. Average daily blood glucose level would have been similar to that on the 20% carb diet.

So the big benefit, in terms of glycemic control for diabetics, comes from reducing carbs from 55% to 20%. Further reductions in carb intake do not reduce average 24 hour blood glucose levels, but may reduce postprandial glucose spikes.

In fact, we have some Type II diabetics eating Perfect Health Diet style. Newell Wright reports good results:

I am a type II diabetic and a Perfect Health Diet follower, so I want to chime in with my experience….

I switched from the Atkins Induction diet to the Perfect Health Diet. I have been eating rice, potatoes, bananas, and other safe starches ever since, as well as fermented dairy products, such as plain, whole milk yogurt. I have also slowly lost another seven pounds. I enthusiastically recommend the book, Perfect Health Diet by Paul and Shou-Ching Jaminet.

Today, my fasting blood glucose reading was 105. Note that since following the Perfect Health Diet, my fasting blood glucose reading has gone down. Previously, I was suffering from the “dawn phenomenon.” My blood glucose levels overall were well below 140 one hour after a meal and 120 two hours after a meal. Only my fasting BG reading was out of whack, usually between 120 and 130, first thing in the morning.

For dinner tonight, I had a fatty pork rib, green beans, and a small baked potato with butter and sour cream. For dessert, I had a half cup of vanilla ice cream. One hour after eating, my blood glucose level was 128 and two hours after, it was 112.

So not only am I losing weight on the Perfect Health Diet, my blood glucose levels have actually improved, thanks to the increased carbs counteracting the dawn phenomenon, just as Dr. Kurt Harris (another proponent of safe starches) said it would.

So for me, as a type II diabetic, this “safe starches” exclusion is pointless…. [D]espite the type II diabetes, I am doing just fine on the Perfect Health Diet, thank you. I reject the diabetic exclusion of safe starches.

Note that Newell’s fasting blood glucose went down from 125 to 105 mg/dl when he raised his carb intake from Atkins Induction to Perfect Health Diet levels, and postprandial glucose levels on PHD were no higher than his fasting levels on Atkins Induction. It looks like he reduced blood glucose levels by adding starches to his diet.

To repeat: I’m not claiming that our regular diet, providing 20% of energy from “safe starches,” is optimal for diabetics. I don’t know what the optimal diabetes diet is, and it may be different for different diabetics. But I think there is plentiful evidence that even for diabetics, our “regular” diet is not a bad diet. And for some, it might be optimal.

Summary: Putting It All Together

It looks like 20% of energy is a sort of magic number for carbs. It:

  • Averts glucose deficiency symptoms while achieving normal insulin sensitivity and glycemic control on oral glucose tolerance tests;
  • Avoids significant hyperglycemic toxicity even in diabetics.

Why does this magic number, which happens to be the Perfect Health Diet recommendation for carb intake, do so well?

Perhaps a chart will make the science a little clearer.

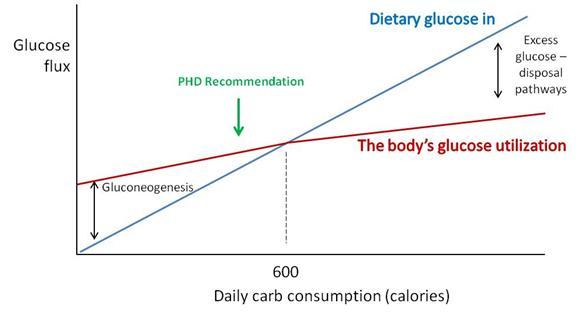
“Dietary glucose in” (blue) represents the amount of carbs obtained from diet. “The body’s glucose utilization” (maroon) is how much glucose will be put to useful purposes at a given daily carb consumption. Glucose utilization does not vary as strongly as glucose intake; at low intakes a deficit is made up by gluconeogenesis (manufacture of glucose from protein) and at high intakes an excess of glucose is destroyed by thermogenesis or conversion of glucose to fat.

Where the blue and maroon lines cross, dietary glucose in matches the body’s glucose utilization. For most sedentary adults, this level will be around 600 carb calories per day. We recommend eating close to or slightly below this point (“PHD Recommendation”).

There are dangers in straying too far from this intersection point:

  • Eating too few carbs creates a risk of health impairment due to insufficient glucose or protein.
  • Eating too many carbs results in unnecessary exercise of glucose disposal pathways, and possible unhealthy fluctuations in blood glucose levels if those disposal pathways fail.

Hitting just below the intersection is a safe, low-stress point which will work well for most people.

For diabetics, the excess glucose disposal pathways are broken. However, this is not a major problem if you have no excess glucose to dispose of. Eating up to 20% of calories from carbs doesn’t require the use of disposal pathways – glucose can be stored as glycogen and then released as needed, so the effect of dietary glucose is primarily to reduce the amount of gluconeogenesis. Suppressing gluconeogenesis requires some residual insulin secretion ability, so Type I diabetics cannot achieve this, but most Type IIs can.

The upshot: A 20% carb diet meets the body’s glucose needs without much risk of hyperglycemic toxicity even in diabetics.

The Issue of Thyroid Hormones and Anti-Aging

The most distinctive element of Dr. Rosedale’s diet is its emphasis on longevity as the supreme measure of health, and its emphasis on calorie restriction (especially, carb and protein restriction) and metabolic suppression as the means to long life.

Our book, Perfect Health Diet, relied strongly on evidence from evolutionary selection to guide us toward the optimal diet.

Dr. Rosedale rejects evolutionary selection as a helpful criterion, since evolution did not necessarily select for longevity:

[I]f we evolved in a certain way and with certain physiologic responses to the way we eat, it was not for a long, healthy, post-reproductive lifespan. It was for reproductive success. The two are not at all synonymous, in fact often antagonistic. We have no footsteps to follow as far as the best way to eat for long healthy post reproductive life. We can only use the best science pertaining to the biology of aging and apply it to proper nutrition. That is what I feel I am doing.

We actually share much of Dr Rosedale’s perspective on what influences longevity; it is for longevity that we recommend slightly under-eating carb and protein compared to what evolution selects for. However, we don’t go as far in that direction as Dr Rosedale does.

We have written of the suppression of T3 thyroid hormone levels which is part of the body’s strategy for conserving glucose in times of scarcity, and how this is a risk factor for “euthyroid sick syndrome.” See Carbohydrates and the Thyroid, Aug 24, 2011.

Dr Rosedale acknowledges this and believes it to be beneficial:

I believe that Jaminet and most others misunderstand the physiologic response to low glucose, and the true meaning of low thyroid. Glucose scarcity (deficiency may be a misnomer) elicits an evolutionary response to perceived low fuel availability. This results in a shift in genetic expression to allow that organism to better survive the perceived famine…. As part of this genetic expression, and as part and parcel of nature’s mechanism to allow the maintenance of health and actually reduce the rate of aging, certain events will take place as seen in caloric restricted animals. These include a reduction in serum glucose, insulin, leptin, and free T3.

The reduction in free T3 is of great benefit, reducing temperature, metabolic damage and decreasing catabolism…. We are not talking about a hypothyroid condition. It is a purposeful reduction in thyroid activity to elicit health. Yes, reverse T3 is increased, as this is a normal, healthy, physiologic mechanism to reduce thyroid activity.

Note that Dr Rosedale acknowledges that his glucose-scarce diet reduces body temperature. Many Rosedale dieters have had this experience. Darrin didn’t like it:

This comment from Rosedale support may be of interest to you;

“The best place to measure is under the tongue. Ideal basal temperature is what you have when you first wake up in the morning, and on the Rosedale diet should be upper 96’s lower 97’s. We have found that when someone starts our diet, their basal temperature will go down about 1-2 degrees Fahrenheit which is a great improvement”.

Personally, i did not feel good on a lower body temp when i was low carb (sub 50g) & have been working hard (following phd diet & supps) to get my body temp back up. i would say my basal/morning oral temp is now around the 97.5F on average (up from around 96.5F average pre PHD).

Low body temperatures are associated with a variety of negative health outcomes. For instance, low body temperature is immunosuppressive, leads to poor outcomes in infections, and is a significant independent predictor for death in medical patients. Fever is curative for most infections, low body temperature is a risk factor for infections. Readers of our book know that we think infections are a major factor in aging and premature death. Whether a diet so restricted in carbs that it significantly lowers body temperature is really optimal for longevity is, I think, open to question.

There is a plausible case to be made for the Rosedale diet as a diet that sacrifices certain aspects of current health in the hope of extending lifespan. It cannot however claim to be the optimal diet for everyone. It is certainly not optimized for fertility, athleticism, or immunity against infections.

Conclusion

I am sympathetic to the broad perspective that underlies Dr Rosedale’s diet. Both our diets are low-carb, low-protein, and high-fat, and studies of longevity are the biggest factor motivating the recommendation to eat a fat-rich diet.

However, Dr Rosedale takes low-carb and low-protein dieting to an extreme that I think is not well supported by the evidence.

Dr Rosedale’s direct attempt at refuting our diet consists mainly of two claims:

  • Lower blood glucose is better than higher blood glucose.
  • The way to lower blood glucose is by eating fewer carbs.

Neither claim is supported. Mortality is a U-shaped function of blood glucose and blood glucose levels around 90 to 100 mg/dl are healthiest, not low blood glucose levels. Moreover, the diet that delivers the lowest blood glucose levels is a high-carb, insulin-sensitizing diet, such as the Kitavans eat, not a low-carb diet.

If I truly believed Dr Rosedale’s argument for lower blood glucose, he would have persuaded me to eat a high-carb Kitavan-style diet. However, I am not persuaded.

I believe that:

  • Optimal blood glucose levels are in the 90 to 100 mg/dl range. High-carb diets cause below-optimal levels of blood glucose, especially during fasts. (Indeed, high-carb dieters routinely experience hunger and irritability during long fasts.) Very low-carb diets cause elevated blood glucose due to the body’s efforts to conserve glucose by suppressing utilization. Excessive suppression of glucose utilization is unhealthy.
  • A 20% carb diet, while not optimal for every single person, is healthy for nearly everyone. Twenty percent may be the best single prediction of the optimal carb intake for the population as a whole. Even diabetics can do well eating 20% carbs.

And that is why we recommend moderate consumption of safe starches.

How to Minimize Hyperglycemic Toxicity

In my reply to Jimmy Moore’s safe starches symposium (see Jimmy Moore’s seminar on “safe starches”: My reply, Oct 12), I didn’t quite have time to fully address the issue of hyperglycemic toxicity.

As J Stanton commented, it would have been good to note that we recommend consuming “safe starches” as parts of meals, not as isolated snacks, and to discuss how meal design mitigates risk of hyperglycemic toxicity:

I’ve written entire articles on the fact that fat content is the primary driver of glycemic index. It’s silly to demonize white potatoes due to high GI when a couple pats of butter – or simply consuming it as part of a PHD-compliant high-fat meal – will drop it far more than substituting a sweet potato.

I thought I’d delve into the factors affecting blood glucose response to meals, and how to minimize the rise in blood sugar. It’s a topic of general interest, since hyperglycemia might have a mild detrimental health effect in nearly everyone; but of special importance to diabetics, since controlling blood sugar is so crucial to their health.

Glycemic Index of Safe Starches

The glycemic index (GI) is “defined as the area under the two hour blood glucose response curve (AUC) following the ingestion of a fixed portion of carbohydrate (usually 50 g).” Pure glucose in water is used as the reference and defines a GI of 100.

Our recommended “safe starches” are significantly lower in GI than glucose.

White rice is typically listed with a GI of 70 or 72, but it varies by strain: Bangladeshi rice has a GI of 37, American brown rice of 50, Japonica (a white short-grained rice) of 48, Basmati rice of 58, Chinese vermicelli of 58, American long-grain rice of 61, risotto rice of 69, American white rice is 72, short-grain white rice is 83, and jasmine rice 89 (source).

Potatoes are a high-GI food but again the GI is highly variable. Baked white potatoes with the skin have a GI of 69, peeled their GI is 98. Yams have GI of 35 to 77 depending on how they are prepared, sweet potatoes of 44 to 94 (source).

With some foods the GI varies strongly with ripeness. Plaintains when unripe have a GI of 40 but when ripe the GI can reach 90 (source).

Taro has a GI of 48 to 56. That’s similar to many fruits, such as bananas which have a GI of 47 to 62. Tapioca has a GI of 70 if steamed, but can exceed 80 if boiled (source).

Gentle Cooking Lowers the Glycemic Index

As a rule, gentle cooking of starchy plants leads to a lower glycemic index and high cooking temperatures lead to a higher glycemic index.

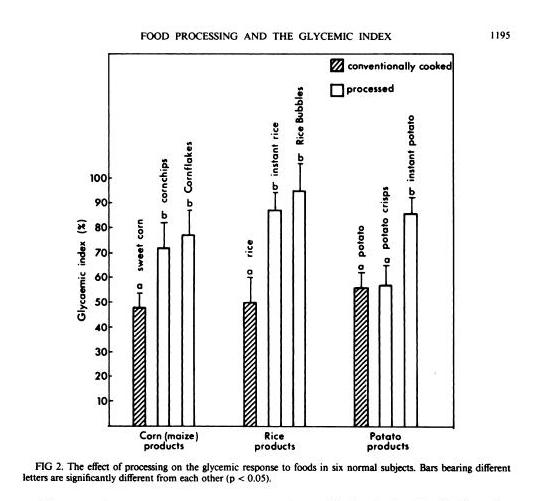
In general, industrially processed foods, which are often processed at very high temperatures to speed them through factories, have high GIs. A study in the American Journal of Clinical Nutrition [1] compared home-cooked corn, rice, and potato with processed foods based on them (instant rice, Rice Bubbles, corn chips, Cornflakes, instant potato, and potato crisps), and the processed foods had consistently higher GIs:

Another study in the British Journal of Nutrition [2] looked at 14 starchy plants prepared in different ways and found that roasting and baking raised the GI:

GI value of some of the roasted and baked foods were significantly higher than foods boiled or fried (P<0.05). The results indicate that foods processed by roasting or baking may result in higher GI. Conversely, boiling of foods may contribute to a lower GI diet.

Perhaps cooking methods that dry out the plant increase the GI.

Meals Have Lower GI

GI is calculated by eating a single food and only that food.

But what happens when you eat a meal? You’re no longer eating one food, but a mixture of foods. The baked potato may come with meat and vegetables, and with butter on top.

You might think that a weighted average of the GI of the various foods might give a good indication of the GI of the meal. Then, since fat, meat, and vegetables have a low GI, you’d expect GI of the meal to be much lower.

It turns out that the GI of meals is low – in fact, it is even lower than the average GI of the foods composing the meal.

That is the result of a new study in the American Journal of Clinical Nutrition [3]. Three meals were prepared combining a starch (potato, rice, or spaghetti) that digested to 50 g (200 calories) glucose with vegetables, sauce, and pan-fried chicken. The GIs of the meals were consistently lower than the values predicted using a weighted average of GIs of the meal components:

Meal Actual GI Predicted GI
Potato 53 63
Rice 38 51
Spaghetti 38 54

So eating a starch as part of a meal reduces GI to the range 38 to 53 – below the levels of many fruits and berries.

Fat Reduces GI

J Stanton has noted that adding a little fat to a starch is very effective in lowering its GI. In a post titled “Fat and Glycemic Index: The Myth of Complex Carbohydrates,” JS states that:

  • Flour tortillas have a GI of 30, compared to a GI of 72 for wheat bread, because tortillas are made with lard.
  • Butter reduces the glycemic index of French bread from 95 to 65.
  • A Pizza Hut Super Supreme Pizza has a GI of 30, whereas a Vegetarian Supreme has a GI of 49.

JS suggests that the reason fat does this is that it lowers the gastric emptying rate, and cites a study which showed that adding fat to starches could increase the gastric emptying time – the time for food to leave the stomach – by 50%. [4]

What’s interesting to me here is that what we really care about is not the glycemic index, but the peak blood glucose level attained after a meal. It is blood glucose levels above 140 mg/dl only that are harmful, and the harm is proportional to how high blood glucose levels rise above 140 mg/dl. So it’s the spikes we want to avoid.

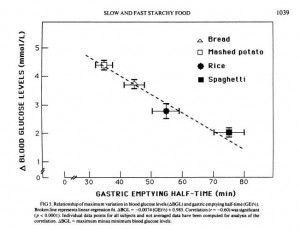
But another paper shows that gastric emptying rate is even more closely tied to peak blood glucose level than it is to glycemic index. From [5]:

So combining a starch with fat may reduce peak blood glucose levels even more than it reduces the glycemic index; which is a good thing.

Dairy reduces GI

Dairy is effective at reducing GI:

[D]airy products significantly reduced the GI of white rice when consumed together, prior to or after a carbohydrate meal. [6]

It is not likely that dairy fat alone was responsible, because whole milk worked better than butter. However, low-fat milk only reduced the GI of rice by 16%, while whole milk reduced it by 41%. So clearly dairy fats are part of the recipe, but not the whole story; whey protein may also matter.

Fiber Reduces GI

Fiber is another meal element that reduces the rise in blood sugar after eating.

Removing fiber from starchy foods increases their glycemic index [7]; adding fiber decreases it. For instance, adding a polysaccharide fiber to cornstarch reduced its GI from 83 to 58; to rice reduced its GI from 82 to 45; to yogurt from 44 to 38. [8]

So it’s good to eat starches with vegetables – the foods richest in fiber.

Acids, Especially Vinegar, Reduce GI

Traditional cuisines usually make sauces by combining a fat with an acid. Frequently used sauce acids are vinegars and citric acid from lemons, limes, or other citrus fruits.

It turns that sauce acids can substantially reduce the GI of meals. The best attested is vinegar. From a study in the European Journal of Clinical Nutrition [6]:

In the current study, the addition of vinegar and vinegared foods to white rice reduced the GI of white rice. The acetic acid in vinegar was thought to be responsible for the antihyperglycemic effect. The amount of acetic acid to be effective could be as low as that found in sushi (estimated to be about 0.2–1.5 g/100 g). The antihyperglycemic effect of vinegar is consistent with other studies performed earlier (Brighenti et al, 1995; Liljeberg & Bjorck, 1998). Although vinegar could lower GI vales, the mechanism has rarely been reported. Most studies accounted the mechanism to be due to a delay in gastric emptying. In animal studies, Fushimi (Fushimi et al, 2001) showed that acetic acid could activate gluconeogenesis and induce glycogenesis in the liver after a fasting state. It could also inhibit glycolysis in muscles. [6]

Other acids also work. Pickled foods, which are sour due to lactic acid released by bacteria, reduce the glycemic index of rice by 27% if eaten before the rice and by 25% if eaten alongside the rice [6].

Wines, especially red wines, are somewhat acidic. I haven’t seen a study of how drinking wine with a meal affects glycemic index, but it is known observationally that wine drinkers have better glycemic control and, often, long lives. [9]

So What’s the Healthiest Way to Eat “Safe Starches”?

One way to limit the likelihood of reaching dangerous blood sugar levels after a meal is by eating a relatively “low carb” diet. We recommend that sedentary people eat about 400 to 600 carb calories per day. This limits the amount eaten at any one sitting to about 200 calories / 50 g, which is the amount of a typical glucose tolerance test. It is an amount the body is well able to handle.

But the manner in which carbs are eaten may be just as important as the amount.

Let’s look again at the Perfect Health Diet Food Plate:

The design of a PHD meal is found in the body of the apple. Assuming two meals a day, the recipe is to combine:

  • A safe starch (roughly ½ pound, which translates to 150 to 300 carb calories);
  • A meat, fish, or egg (¼ to ½ pound);
  • A sauce made up of fats and acids such as lemon juice or vinegar;
  • Vegetables, preferably including fermented vegetables with their healthy acids;
  • (Optionally) some dairy or a glass of wine.

This is precisely the recipe which science has found minimizes the elevation of blood glucose after meals.

It seems reasonable to expect that a meal designed in this fashion will have a glycemic index around 30. The odds of 200 carb calories with a glycemic index of 30 generating blood sugar levels that are dangerous – 140 mg/dl or higher – in healthy people is very low. Even in diabetics, it may be uncommon.

So, yes, Virginia. There is a Santa Claus, and you can eat safe starches and avoid hyperglycemia too!

References

[1] Brand JC et al. Food processing and the glycemic index. Am J Clin Nutr. 1985 Dec;42(6):1192-6. http://pmid.us/4072954.

[2] Bahado-Singh PS et al. Food processing methods influence the glycaemic indices of some commonly eaten West Indian carbohydrate-rich foods. Br J Nutr. 2006 Sep;96(3):476-81. http://pmid.us/16925852.

[3] Dodd H et al. Calculating meal glycemic index by using measured and published food values compared with directly measured meal glycemic index. Am J Clin Nutr. 2011 Oct;94(4):992-6. http://pmid.us/21831990.

[4] Thouvenot P et al. Fat and starch gastric emptying rate in humans: a reproducibility study of a double-isotopic technique. Am J Clin Nutr 1994;59(suppl):781S.

[5] Mourot J et al. Relationship between the rate of gastric emptying and glucose and insulin responses to starchy foods in young healthy adults. Am J Clin Nutr. 1988 Oct;48(4):1035-40. http://pmid.us/3048076.

[6] Sugiyama M et al. Glycemic index of single and mixed meal foods among common Japanese foods with white rice as a reference food. Eur J Clin Nutr. 2003 Jun;57(6):743-52. http://pmid.us/12792658. Full text: http://www.nature.com/ejcn/journal/v57/n6/full/1601606a.html.

[7] Benini L et al. Gastric emptying of a solid meal is accelerated by the removal of dietary fibre naturally present in food. Gut. 1995 Jun;36(6):825-30. http://pmid.us/7615267.

[8] Jenkins AL et al. Effect of adding the novel fiber, PGX®, to commonly consumed foods on glycemic response, glycemic index and GRIP: a simple and effective strategy for reducing post prandial blood glucose levels–a randomized, controlled trial. Nutr J. 2010 Nov 22;9:58. http://pmid.us/21092221.

[9] Perissinotto E et al. Alcohol consumption and cardiovascular risk factors in older lifelong wine drinkers: the Italian Longitudinal Study on Aging. Nutr Metab Cardiovasc Dis. 2010 Nov;20(9):647-55. http://pmid.us/19695851.