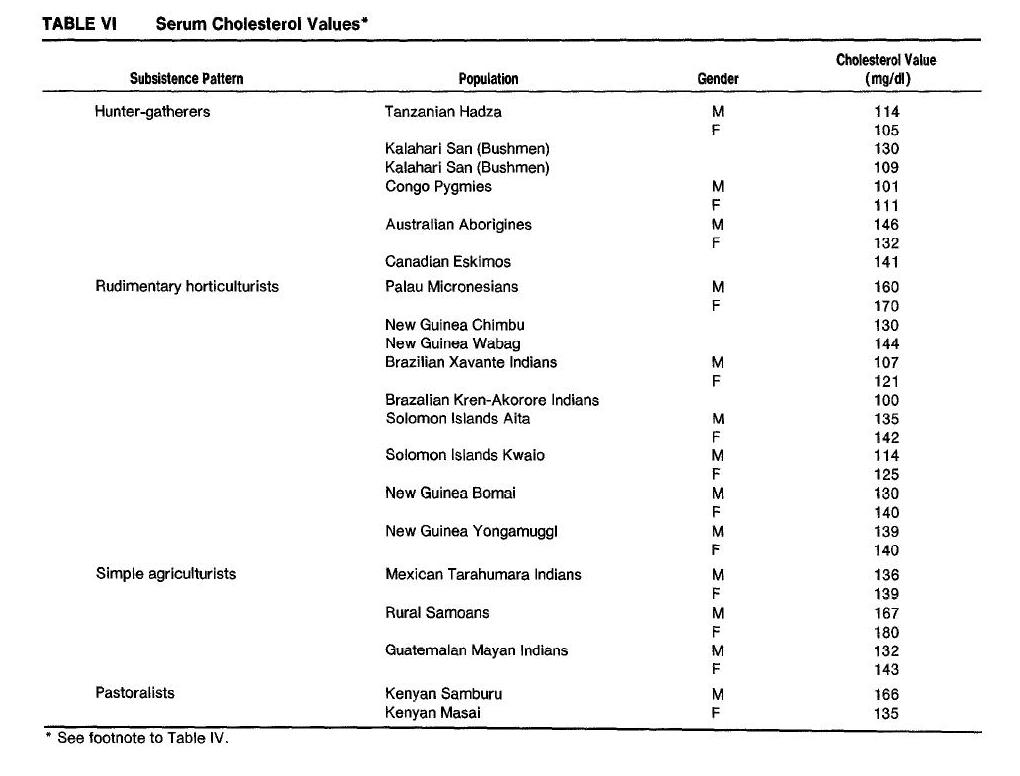
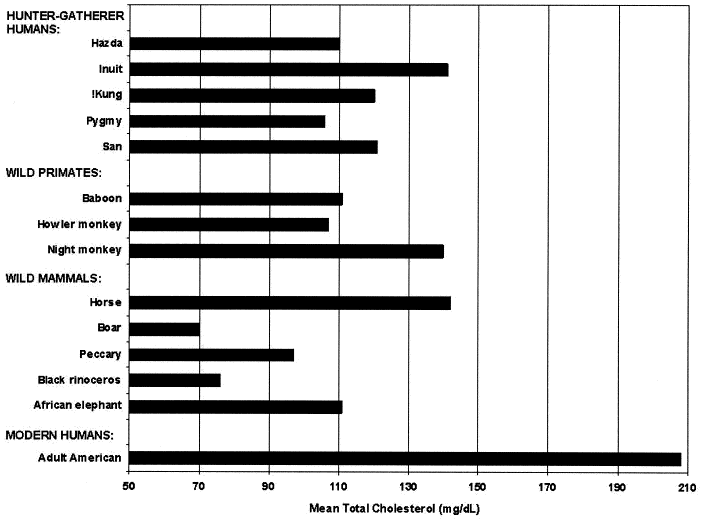
We’re investigating the surprising claim, set forth by S. Boyd Eaton, Melvin Konner, and Marjorie Shostak 1988 [1] and reiterated by Loren Cordain and collaborators in 2004 [2] and Boyd and Konner 2010 [3], that hunter-gatherers had total serum cholesterol below 135-140 mg/dl (3.49-3.62 mmol/l), and that this was healthy. A summary of their claims can be found in Tuesday’s post (Did Hunter-Gatherers Have Low Serum Cholesterol?).
The original Eaton et al paper [1] listed Hadza, Kalahari San (Bushmen), Congo Pygmies, Canadian Eskimos, and Australian Aborigines as hunter-gatherer populations with low cholesterol. So I’m going to survey cholesterol levels in those groups, and maybe a few others.
I had intended to cover all groups in one post, but I found that doing the topic justice requires more elaborate discussion. Therefore, I’ll give each group its own blog post, starting with the Eskimos and Inuit.
A word of caution: Please do not jump to conclusions until the series is complete. I will withhold most of my analysis until the end of the series. For now I am just presenting data, assessing its quality, and including relevant facts about the health of the study population.
Summary of the Data
Searches on “Eskimo cholesterol” and “Inuit cholesterol” turned up a lot of papers. I didn’t look at all of them but I looked at most of the pre-1988 papers (which Eaton et al could have cited) and a sampling of recent ones.
Here is a table summarizing what I found. Papers are ordered from oldest to newest:
Cholesterol Levels of Eskimo & Inuit Populations
| Paper [ref] | Mean TC | Notes |
| Corcoran & Rabinowitch 1935 [9] | 141 mg/dl | Stale samples, obsolete technique, small sample size; tuberculosis common |
| Wilber & Levine 1950 [11] | 218 mg/dl | |
| Rodahl 1955 [13] | 215 mg/dl | |
| Pett & Lupien 1958 [10] | 204 mg/dl | |
| Scott et al 1958 [12] | 214 mg/dl | |
| Davies & Hanson 1965 [8] | 182 mg/dl | Diseased (tuberculosis), life expectancy 32 years |
| Ho et al 1972 [7] | 221 mg/dl | |
| Dyerberg et al 1975 [6] | 216 mg/dl | |
| Young et al 1993 [15] | 205 mg/dl | Average of 4 age and gender cohorts |
| Howard et al 2010 [14] | 211 mg/dl | TC calculated from LDL 125, HDL 62, triglycerides 118 |
| Makhoul et al 2010 [5] | 223 mg/dl |
Results are remarkably consistent. Nine of the eleven papers reported mean total cholesterol (TC) between 204 mg/dl and 223 mg/dl. Let’s look more closely.
Studies that Reported Low Serum Cholesterol
The TC of 141 mg/dl reported by Corcoran & Rabinowitch 1937 [9] among Hudson Bay and Baffin and Devon Island Eskimos is precisely the number quoted for Canadian Eskimos by Eaton, Konner and Shostak [1]. Presumably this was their source for that number.
How solid is the number? Corcoran & Rabinowitch acquired samples from only 27 non-fasting Eskimo men. The measurement method was archaic and the samples were not fresh:
None of the tests was completed during the voyage. The work then was confined to collection of the blood samples and their necessary treatment to preserve the different constituents to be examined. All analyses were made on oxalated plasma. [9]
Corcoran & Rabinowitch note the unreliability of lipid measurements from the 1930s:
A survey of the literature shows wide variations of the different lipoid constituents of blood, both in fasting experiments and following ingestion of food, in animals and in man, and whether the analyses were made upon whole blood, red blood cells, plasma or serum. Correlation of these data is difficult because of the variety of technical methods with which they were obtained. [9]
Possible evidence for deterioration of the samples is the fact that, although twenty of the twenty-seven Eskimos were eating zero-carb diets, no ketones were found in any sample:
Also suggestive of an unusual mechanism for the utilization of fat is the absence of ketosis in these natives, whereas the urines of both [Stefansson and Andersen during the Bellevue All-Meat Trial] contained acetone. The explanation of this absence of ketosis is not entirely clear. [9]
My guess is the ketones had evaporated before measurement, or were otherwise degraded.
I might add that in 1935, when the Corcoran & Rabinowitch samples were collected, the Eskimo had already begun to deviate from the hunter-gatherer lifestyle. Rabinowitch 1936 [16] reports:
These Eskimos are employed by the Police, and live in huts for a great part of the year. Their food and clothing are also to some extent the products of civilization … The food supplied by the Police must be supplemented by the natural foods of their environment- seal, etc. These Eskimos still spend much time hunting. [16]
Rabinowitch observed flour in about half the Eskimo tents he visited, and was told at Lake Harbour, which may have had the lowest flour consumption of the sites he visited, that the average annual flour consumption was 130 pounds for a family of three Eskimos. [16]
Infectious disease, notably tuberculosis, was common:
Tuberculosis was common in the Straits and Bay. At Chesterfield Inlet, of 62 persons examined 22 had some respiratory disturbance; and of these 12 had coughs with no detectable adventitious sounds in the lungs; 2 had what appeared to be bronchitis only; and 8 had active pulmonary tuberculosis. In addition to these 8 cases, active glandular tuberculosis (cervical) was found in 4 children. At Port Burwell, of 31 natives examined 8 had coughs with no detectable adventitious sounds; 2 had what appeared to be bronchitis; and 5 adults had active pulmonary tuberculosis. Two children had masses of confluent glands in the neck. There was one case of tuberculosis of bone (phalanx); there was no reason to suspect lues in this case. At Coral Harbour there was a child with tuberculosis of a knee joint. Two cases of active pulmonary tuberculosis were found at Lake Harbour. At Wolstenholme one child was found with a mass of confluent glands in the neck. [16]
They also had parasites and worms:
From reports of the Institute of Parasitology of McGill University by Drs. TWM Cameron and IW Parnell it is obvious that the Eskimo is exposed to a variety of parasitic infections. These authors have found that at least three-quarters of all the animals examined, birds, duck, geese, etc., harboured parasites. The polar bear, walrus, and weasel were found free, but most of the seals were infected with Ascarides and intestinal flukes. The Eskimo lives in intimate contact with his dogs, and carcasses and feces of these animals are heavily parasitized with hookworm, Ascarides, flukes, and tape worms. Ascarides, taenia and hookworm were found as far north as Craig Harbour, and hares from Ellesmere Island were heavily infected with worms. Nail scrapings of Eskimos were found high in content of Oxyuris vermicularis…. Our pathologist, Dr LJ Rhea, in his search for parasites found 6 cases of eosinophilia amongst 34 blood smears. [16]
The other paper showing a mean population TC below 200 mg/dl was Davies & Hanson 1965 [8], who found a mean TC of 182 mg/dl. I liked this paper because it gave a lot of textual background concerning the health and diet of the 727 Canadian Northwest Passage Eskimos studied. Some quotes from this study:
[Seventy to ninety percent] live at sealing or fishing camps and visit the trading posts twice yearly or more often, depending on distance.
Ten to 25% of their food is obtained from trading posts …
[L]ife expectancy of the Eskimo is about 32 years … [8]
Health was poor, as you’d expect from the short life expectancy. Infectious disease was a serious problem. Many had had tuberculosis or brucellosis; chronic coughs were common. Many had abnormal blood cell counts, such as eosinophilia, neutrophilia, and lymphocytosis. Some had diabetes, despite low-carb diets; I suspect the combination of alcohol and omega-3 fats (also low vitamin D) to have been the culprit. However, iodine status was excellent and hypothyroidism was extremely rare.
My guess is that these Eskimos were bringing a lot of tobacco, alcohol, and infectious disease back from those trading posts.
Considering that 75% to 90% of their food was acquired in the traditional way, a life expectancy of 32 years is not exactly a ringing endorsement of the healthfulness of the Eskimo/Inuit diet. The poor health of this group of Eskimos may have contributed to their relatively low TC of 182 mg/dl.
Studies that Reported High Serum Cholesterol
The other nine studies reported mean serum TC between 204 and 223 mg/dl. These levels fall in the minimum mortality region of O Primitivo’s database and are suggestive of good health.
I particularly like one recent paper, Makhoul et al 2010 [5], because it sampled Yup’ik Eskimo eating the traditional diet, and included scatter plots showing each individual’s cholesterol numbers. They write:
Because of their traditional diet, which is based largely on fish and other marine foods (20), Yup’ik Eskimos have a mean intake of EPA and DHA that is >20 times the current mean intake of the general US population (3.7 compared with 0.14 g/d in men and 2.4 compared with 0.09 g/d in women) (21). Studies of Yup’ik Eskimos offer a unique opportunity to examine how a broad range of EPA and DHA intakes (22) affect chronic disease biomarkers. [5]
Some Eskimos in their sample got as much as 15% of calories from EPA+DHA. Their cholesterol levels:
TC is mostly between 200 and 240 mg/dl, LDL between 100 and 160, and HDL between 50 and 70. Cholesterol increased as fish oil intake increased – evidence that cholesterol gets higher as the diet becomes more traditional.
Other studies also found that the more traditional the Eskimo diet, the higher were total cholesterol levels. Here is the discussion in Ho et al 1977 [7], who found mean total cholesterol of 221 mg/dl in Arctic Eskimos:
This value was in general agreement with that obtained from other mass samplings of Arctic Eskimos (8-11) but was slightly higher than those values obtained from the Eskimos living on the Pacific Coast of Alaska, as reported by Scott et al. (9). [PJ: Scott et al, my reference [12], found mean TC of 214 mg/dl.] A generalization was made by Scott and co-workers from their study on 842 Eskimos that northern Alaskan Eskimos have higher serum cholesterol levels than southern Eskimos. The reason for this difference might well be related to the differences in their diets, as the main staple of northern Eskimos is marine mammals, whereas that of the southern Eskimos includes some vegetables and fish (12). [7]
In general, the studies reporting mean TC over 200 mg/dl all reported that their study population were eating a diet resembling the traditional hunter-gatherer diet. In Arctic populations, this diet featured high intake of marine mammals and low intake of carbohydrates.
Conclusion
The vast majority of studies show that Eskimo and Inuit populations have mean serum cholesterol over 200 mg/dl. The only studies showing mean serum cholesterol below 200 mg/dl sampled tuberculosis-ridden populations with short life expectancy. The study showing the lowest mean serum cholesterol used obsolete sample preparation and measurement techniques on stale samples.
The most parsimonious explanation of the data is that TC of 200-230 mg/dl is normal for Eskimos and Inuit, that lower TCs indicate the presence of infectious diseases such as tuberculosis, and that the very low TC of Corcoran & Rabinowitch 1937 may have suffered from sample degradation during the two-and-a-half-month voyage (July 13-Sept 29) before samples could be measured in Montreal.
It would be difficult to attribute the low TC in Corcoran & Rabinowitch 1937 to diet, as the subjects ate flour and other government-provided foods and did not obviously eat a more traditional diet than the Eskimo of later studies. The most salient difference between the Corcoran & Rabinowitch subjects and those of later studies was the high incidence of tuberculosis in 1935. Perhaps the low TC in Corcoran & Rabinowitch was due to tuberculosis, but Davies and Hanson found a mean TC of 182 mg/dl in another tuberculosis-ridden Eskimo population.
The Corcoran & Rabinowitch 1937 paper will be useful to us because it gives us an indication what may happen to measured TC levels when an older measurement method, that of Abell, is applied to stale samples. It appears that such measurements may under-report TC by as much as 1/3 (210 mg/dl to 141 mg/dl).
Related Posts
The posts in this series are:
- Did Hunter-Gatherers Have Low Serum Cholesterol?, Jun 28, 2011
- Serum Cholesterol Among the Eskimos and Inuit, Jul 1, 2011
- Serum Cholesterol Among African Hunter-Gatherers, Jul 5, 2011
- Serum Cholesterol Among Hunter-Gatherers: Conclusion, Jul 7, 2011
- Low Serum Cholesterol in Newborn Babies, Jul 7, 2011
References
[1] Eaton SB, Konner M, Shostak M. Stone agers in the fast lane: chronic degenerative diseases in evolutionary perspective. Am J Med. 1988 Apr;84(4):739-49. http://pmid.us/3135745. Full text: http://www.direct-ms.org/pdf/EvolutionPaleolithic/EatonStone%20Agers%20Fast%20Lane.pdf
[2] O’Keefe JH Jr, Cordain L, Harris WH, Moe RM, Vogel R. Optimal low-density lipoprotein is 50 to 70 mg/dl: lower is better and physiologically normal. J Am Coll Cardiol. 2004 Jun 2;43(11):2142-6. http://pmid.us/15172426.
[3] Konner M, Eaton SB. Paleolithic nutrition: twenty-five years later. Nutr Clin Pract. 2010 Dec;25(6):594-602. http://pmid.us/21139123. Full text: http://ncp.sagepub.com/content/25/6/594.full.
[5] Makhoul Z et al. Associations of very high intakes of eicosapentaenoic and docosahexaenoic acids with biomarkers of chronic disease risk among Yup’ik Eskimos. Am J Clin Nutr. 2010 Mar;91(3):777-85. http://pmid.us/20089728.
[6] Dyerberg J et al. Fatty acid composition of the plasma lipids in Greenland Eskimos. Am J Clin Nutr. 1975 Sep;28(9):958-66. http://pmid.us/1163480.
[7] Ho KJ et al. Alaskan Arctic Eskimo: responses to a customary high fat diet. Am J Clin Nutr. 1972 Aug;25(8):737-45. http://pmid.us/5046723.
[8] Davies LE, Hanson S. THE ESKIMOS OF THE NORTHWEST PASSAGE: A SURVEY OF DIETARY COMPOSITION AND VARIOUS BLOOD AND METABOLIC MEASUREMENTS. Can Med Assoc J. 1965 Jan 30;92:205-16. http://pmid.us/14246293.
[9] Corcoran AC, Rabinowitch IM. A study of the blood lipoids and blood protein in Canadian Eastern Arctic Eskimos. Biochem J. 1937 Mar;31(3):343-8. http://pmid.us/16746345.
[10] Pett LB, Lupien PJ. Cholesterol levels of Canadian Eskimos. Federation Proc. 17(1958): 488, 1958.
[11] Wilber CG, Levine VE. Fat metabolism in Alaskan Eskimos. Exp Med Surg. 1950 May-Nov;8(2-4):422-5. http://pmid.us/15427668.
[12] Scott EM et al. Serum cholesterol levels and blood pressure of Alaskan Eskimo men. Lancet. 1958 Sep 27;2(7048):667-8. http://pmid.us/13588965.
[13] Rodahl K. Diet and cardiovascular disease in the Eskimos. Trans Am Coll Cardiol. 1955 Apr;4:192-7. http://pmid.us/14373771.
[14] Howard BV et al. Cardiovascular disease prevalence and its relation to risk factors in Alaska Eskimos. Nutr Metab Cardiovasc Dis. 2010 Jun;20(5):350-8. http://pmid.us/19800772.
[15] Young TK et al. Cardiovascular diseases in a Canadian Arctic population. Am J Public Health. 1993 Jun;83(6):881-7. http://pmid.us/8498628.
[16] Rabinowitch IM. Clinical and Other Observations on Canadian Eskimos in the Eastern Arctic. Can Med Assoc J. 1936 May;34(5):487-501. http://pmid.us/20320248. Full text: http://www.ncbi.nlm.nih.gov/pmc/articles/PMC1561651/pdf/canmedaj00512-0065.pdf.











Recent Comments