Note to Abby: I did get distracted. Lemon juice next week.
In Friday’s post, I offered Jaminet’s Corollary to the Ewald Hypothesis. The Ewald hypothesis states that since the human body would have evolved to be disease-free in its natural state, most disease must be caused by infections. A consequence of the Ewald hypothesis is that, since microbes evolve very quickly, they will optimize their characteristics, including their virulence, depending on the human environment. If human-human transmission is easy, microbes will become more virulent and produce acute, potentially fatal disease. If transmission is hard, microbes will become less virulent, and will produce mild, chronic diseases.
Jaminet’s corollary is that such an evolution has been happening over the last hundred years or so, caused by water and sewage treatment and other hygienic steps that made transmission more difficult. The result has been a decreasing number of pathogens that induce acute deadly disease, but an increasing number that induce milder, chronic, disabling disease.
Indeed, most of the diseases we now associate with aging – including cardiovascular disease, cancer, autoimmune diseases, dementia, and the rest – are probably of infectious origin and the pathogens responsible may have evolved key characteristics fairly recently. Many modern diseases were probably non-existent in the Paleolithic and may have substantially changed character in just the last hundred years.
I predict that pathogens will continue to evolve into more successful symbiotes with human hosts, and that chronic infections will have to become the focus of medicine.
Is there evidence for Jaminet’s corollary? I thought I’d spend a blog post looking at gross statistics.
When did hygienic improvements occur?
Since the evolution of pathogens should have begun when water and sewage treatment were adopted, it would be good to know when that occurred.
Historical Statistics of the United States, Millennial Edition, volume 4, p 1070, summarizes the history as follows:
[I]n the nineteenth century most cities – including those with highly developed water systems – relied on privy vaults and cesspools for sewage disposal…. Sewers were late to develop because at least initially privy vaults and cesspools were acceptable methods of liquid waste disposal, and they were considerably less expensive to build and operate than sewers.
Sewers began to replace privy vaults and cesspools as running water became more common and its use grew. The convenience and low price of running water led to a great increase in per capita usage. The consequent increase in the volume of waste water overwhelmed and undermined the efficacy of cesspools and privy vaults. According to Martin Melosi, “the great volume of water used in homes, businesses, and industrial plants flooded cesspools and privy vaults, inundated yards and lots, and posed not just a nuisance but a major health hazard” (Melosi 2000, p 91).
Joel Tarr also notes the impact of the increasing popularity of water closets over the later part of the nineteenth century (Tarr 1996, p 183). Water closets further increased the consumption of water, thus contributing to the discharge of contaminated fluids.
The data is not really adequate to tell when the biggest improvements were made. The most relevant data series, Dc374 and Dc375, begin only in 1915. They show that investments in sewer and water facilities were high before World War I, fell during the war and post-war depression, were very high again in the 1920s, and fell again after the Great Depression. It’s likely that the peak in water and sewage improvements occurred before 1930. In constant dollar terms, investment in water facilities peaked in 1930 at 610 million 1957 dollars and didn’t reach that level again until 1955. Investment in sewer facilities peaked at 734 million 1957 dollars in 1936 – probably due to Depression-era public works spending – and didn’t reach those levels again until 1953.
It seems likely that hygienic improvements were being undertaken continuously from the late 1800s and were probably completed in most of the US by the 1930s; in rural areas by the 1960s. Systems to deliver tap water were built mostly in the last quarter of the 19th century and first half of the 20th. The first flush toilets appeared in 1857-1860 and Thomas Crapper’s popularized toilet was marketed in the 1880s.
Mortality
Historical Statistics of the United States, Millennial Edition, volume 1, p 385-6, summarizes the trends in mortality as follows:
Recent work with the genealogical data has concluded that adult mortality was relatively stable after about 1800 and then rose in the 1840s and 1850s before commending long and slow improvement after the Civil War. This finding is surprising because we have evidence of rising real income per capita and of significant economic growth during the 1840-1860 period. However, … urbanization and immigration may have had more deleterious effects than hitherto believed. Further, the disease environment may have shifted in an unfavorable direction (Fogel 1986; Pope 1992; Haines, Craig and Weiss 2003).
Of course, urbanization and a worsening of the disease environment would be expected to coincide: with lack of hygienic handling of sewage, cities were mortality sinks throughout medieval times and that would have continued into the 19th century. Under the Ewald hypothesis, we would expect microbes to have become more virulent as cities became more densely populated in the 1840s and 1850s.
We have better information for the post-Civil War period. Rural mortality probably began its decline in the 1870s becaue of improvements in diet, nutrition, housing, and other quality-of-life aspects on the farm. There would have been little role for public health systems before the twentieth century in rural areas. Urban mortality probably did not begin to decline prior to 1880, but thereafter urban public health measures – especially construction of central water distribution systems to deliver pure water and sanitary sewers – were important in producing a rapid decline of infectious diseases and mortality in the cities that installed these improvements (Melosi 2000). There is no doubt that mortality declined dramatically in both rural and urban areas after about 1900 (Preston and Haines 1991).
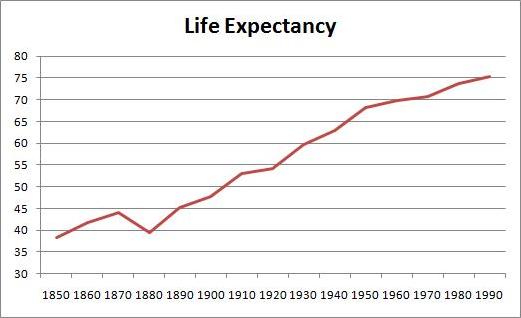
The greatest improvements in mortality occurred between 1880 and 1950. Here is life expectancy at birth between 1850 and 1995 (series Ab644):
Life expectancy was only 39.4 years in 1880, but increased to 68.2 years by 1950 – an increase of 28.8 years. In the subsequent 40 years, life expectancy went up only a further 7.2 years.
Causes of Death
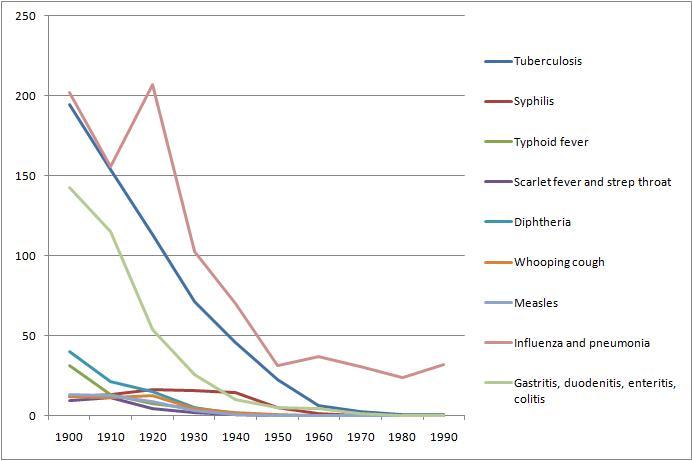
From Table Ab929-951 of volume 1, we can get a breakdown of death rates by cause from 1900 to 1990. Here are death rates from various infectious diseases:
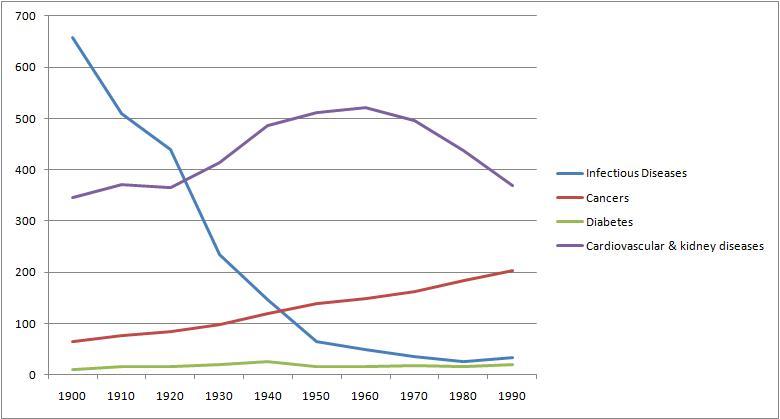
And here for comparison are death rates from cancer, cardiovascular and renal diseases, and diabetes:
Overall, death rates have declined, consistent with rising life expectancy. However, death rates from chronic diseases have actually increased, while death rates from acute infections have, save for influenza and pneumonia, gone pretty much to zero.
Conclusion
Death rates from acute infections plummeted in the period 1880 to 1950 when hygienic improvements were being made. By and large, these decreases in infectious disease mortality preceded the development of antimicrobial medicines. Penicillin was discovered only in 1928, and by then mortality from infectious diseases had already fallen by about 70%.
We can’t really evaluate the Jaminet corollary from this data, other than to say that the data is consistent with the hypothesis. Nothing here rules out the idea that pathogens have been evolving from virulent, mortality-inducing germs into mild, illness-inducing germs.
Sometime later this year, I’ll look for evidence that individual pathogens have evolved over the last hundred years. It should be possible to find evidence regarding the germs for tuberculosis and influenza, since those continue to be actively studied.
There is great concern over the evolution of antibiotic resistance among bacteria. This data suggests that antibiotic resistance will not generate a return to the high mortality rates of the 19th century. Those mortality rates were high not due to a lack of antibiotics, but due to a lack of hygiene that encouraged microbes to become virulent.
As long as we keep our hands and food clean and our running water pure, we can expect mortality rates to stay low. Our problem will be a growing collection of chronic diseases.
Our microbes will want to keep us alive — that is good. But they will increasingly succeed at making us serve them as unwilling hosts. We will be increasingly burdened by parasites.
Diet, nutrition, and antimicrobial medicine are our defenses. Let’s use them.


Recent Comments