Monthly Archives: August 2011 - Page 2

Podcast with Chris Kresser and Danny Roddy

I’d like to thank Chris and Danny for a very enjoyable podcast. Thanks to the great hosts and the great questions submitted by the audience, I think it came out really well.

Chris gave our book a great recommendation even before it was published and really introduced us to the blogosphere; we’ll always be grateful for that.

A little note about our posting schedule: We didn’t do a food post on Sunday because Shou-Ching is away at a conference. Food posting will be back next Sunday. Also, I’ll be continuing our Low Carb Diet and Thyroid series shortly; it should be a very interesting series.

Thanks, Chris and Danny!

Around the Web; Shark-Whale-Man Friendship Edition

Chris Kresser, Danny Roddy, and I recorded a podcast yesterday, and it should be up at TheHealthySkeptic.org or ChrisKresser.com on Tuesday. Chris and Danny are great hosts and we had some fascinating questions to play with, so it was a lot of fun.

Here’s what interested me this week:

[1] Interesting posts: JS Stanton of gnolls.org has been doing a great series on satiety, hunger, and obesity. Part IV went up this week. JS points out that the obese have damaged mitochondria and reduced ability to oxidize fat. These defects often persist after weight has been lost:

Normal subjects are burning 7% carbs and 78% fat at rest, whereas formerly obese subjects are burning 49% carbs and 34% fat at rest!

Don’t miss JS’s ongoing exploration of the implications.

Jamie Scott looks at the question: do high-fat diets cause intestinal inflammation?

Barry Groves finds a paper showing via functional MRI that fatty meals improve mood.

Melissa McEwen shows that a diet that includes some carbs, fiber or butyrate, and omega-3 fats is very good for the gut, whereas a high-protein low-carb low-fiber diet is harmful. She has a cool picture:

In another post, Melissa informs us that Lierre Keith has become an advocate of terrorism. Eeek! I regret that we mentioned The Vegetarian Myth in our appendix for vegetarians.

Seth Roberts also linked to a paper showing that high-protein diets are bad for the colon, due to toxic protein metabolites.

Emily Deans informs us that a substantial fraction of people develop hypoglycemia when they eat a small amount of carbs following a fast; and that hypoglycemia is associated with violent behavior.

Mike the Mad Biologist advises: “WASH YOUR DAMN HANDS!”

The Scientist notes that vinegar can do us a lot of good: it helps resolve inflammation and tightens the intestinal barrier. These are among the reasons we include beneficial acids, like lemon juice and vinegar, in our Food Plate.

Chris Masterjohn notes that history affects how you’ll respond to a diet:

[I]f I eat a diet very low in muscle meats and rich in organ meats for a few months, I can go two months on a practically vegan diet, with maybe some oysters and clams here and there, and feel terrific.  How we feel right now is not just influenced by what we ate today, but how we ate the last week, three months ago, six months ago, three years ago, and so on.

Nutritional deficiencies can take months or years to show an effect.

Stephan Guyenet added a section on genetic defects that produce obesity to his contra Taubes post. These experiments show that leptin pathways, not insulin pathways, are crucial; Stephan also quotes two papers arguing that since the genes in question are highly expressed in the brain, the brain is likely a crucial organ in obesity.

In another post, Stephan summarizes two early papers indicating the existence of a fat mass setpoint that regulates appetite. One of the papers says:

In the present experiment, the subjects reduced their intake voluntarily and were always in good spirits, while in the previous experiment, the subjects had to continually fight off their hunger and would spend the night dreaming of food.

And Stephan comments:

That, ladies and gents, is the difference between someone who is at his setpoint and someone who is not.

This may be the most informative sentence Stephan has written so far. If hunger is the manifestation of a setpoint above current body weight, and lack of hunger the manifestation of a setpoint below current body weight, then the Perfect Health Diet seems to immediately reduce the setpoint to something close to normal weight for many people, because so many have reported hunger-free weight loss on our diet. As a result of this experience, Stephan’s post actually convinces me more than ever that the body’s nutritional status is a central influence upon appetite, and that being well nourished may be the key to weight loss. It also gives us easier experiments with which to test these theories: what reduces hunger better, a highly nourishing diet that is high in food reward, or a less nourishing diet that is bland and low in reward?

[2] Everything’s just ducky:

[3] Hospital epidemics: Hospitals are great places for microbes – lots of sick people eating bad food – and I expect we’ll see more stories like this one:

A strain of Klebsiella pneumoniae bacteria is sweeping a Dutch hospital, killing 28 people so far. The Dutch National Institute for Public Health and the Environment (RIVM) yesterday announced a set of genes for specific diagnosis of the strain, developed by scientists who mined the bacterium’s genome.

Dutch media reports that Maasstad hospital in Rotterdam has been reporting K. pneumoniae infections since late 2010. Since then, at least 80 patients have been infected and the hospital estimates that more than 2,000 may have been exposed to the bacteria.

The strain is resistant to many antibiotics, and also contains the gene for Oxa-48, an enzyme that allows it to resist the carpabenem antibiotics typically used to treat broad-spectrum antibiotic resistant Klebsiella.

We urgently need to relax the regulatory burdens on antibiotic development: see The FDA Is On The Side of the Microbes, Aug 11, 2010.

[4] Some beautiful photos: Taken by a Wisconsin law professor while hiking the Gaspé peninsula in Canada. Photos here. We’ve never hiked there, perhaps it’s time for a trip.

[5] Shou-Ching’s photo art:

[6] Not the weekly video: This lady, the dancer Lunga, must be one of Todd Hargrove’s better pupils:

[7] Video of the week: Stories of human-animal friendship can circulate for years on the Internet. A few years ago there was a story, published on April Fool’s Day in the French magazine Le magazine des voyages de pêche, claiming that a great white shark who had been freed from a net by a fisherman had then followed him for years making displays of affection.

The magazine photos may be seen in this video and the story of the hoax here.

But occasionally, there is a true story of human-animal cooperation and goodwill. Here’s one:

Low Carb High Fat Diets and the Thyroid

Last year we ran a series on “Zero-Carb Dangers,” which are health problems that can appear if carb intake – or carb+protein intake, since protein can to some degree make up for a deficit of glucose – are too low. Anthony Colpo has recently argued that hypothyroidism should be added to the list of potential zero-carb dangers; and that low-carb high-fat diets in general might create a risk of hypothyroidism. Similar arguments have been made by Matt Stone and others. Our resident thyroid expert, Mario Renato Iwakura, decided to look more deeply into the matter. What does the literature say? Here’s Mario.

There have been anedoctal reports on low carb forums about people becoming hypothyroid after following a low carb, high fat diet. Anthony Colpo recently wrote a blog post about carbohydrate, fat and protein intake and their effects on thyroid hormone levels, concluding that a high fat or high protein diet is detrimental and that a high carbohydrate diet is good for the thyroid [1].

What I will try do demonstrate here is that the sole conclusion we can draw from the literature, including the studies cited by Anthony and others, is that a high polyunsaturated fat (PUFA) diet is detrimental to thyroid health. There is no evidence that a diet, such as the Perfect Health Diet, that is high in saturated and monounsaturated fat, low in PUFA, and provides sufficient, moderate levels of protein and carbohydrate, has any detrimental effect on the thyroid. On the contrary, I believe that such a diet is optimal for thyroid health.

What Has Been Tested: High PUFA Diets

Colpo’s post is extensive and covered most, but not all, relevant studies published to date about the subject. Many of those studies have problems like short duration or calorie restriction. But in almost all, with the exception of one study by Jeff Volek and collaborators [2], the fat used in the high fat diet was predominantly polyunsaturated fat from vegetable oils. An example is the Vermont long term study [3]:

“The long-term study of fat overfeeding included four subjects studied before and after overeating fat for 3 mo. The excess fat in these diets averaged 895 kcal/d consisting of margarine, corn oil, a corn oil colloidal suspension, and fat enriched soups and cookies.  The ratio of saturated to unsaturated fatty acids in these diets was ~1:2.5.”

This ratio is precisely that found in corn oil. So, this diet’s fat  was probably 13.5% saturated, 29% monounsaturated, and 57.5% polyunsatured.

Or in Ullrich et al 1985 [4]:

“One diet was high in polyunsaturated fat (HF), with 10%, 55%, and 35% of total calories derived from protein, fat, and carbohydrate, respectively.”

Polyunsaturated Fat and the Thyroid.

Let’s look at the literature, starting with two studies not cited by Anthony.

In 1995, Vasquez et al tested four very low calorie diets, with variable amounts of carbs, fats and protein, in 48 obese women for 28 days [5]. All diets were in liquid form, and fat was predominantly PUFA. The composition of the four diets was:

50P/10C 50P/76C 70P/10C 70P/86C
Energy (kcal) 590 590 615 615
Protein (% cal) 35.5 33.7 45.8 43.0
Fat (% cal) 57.8 15.1 48.1 4.1
Carb (% cal) 6.7 51.2 6.1 52.9
T3 Day 0 2.0 2.2 1.6 1.8
T3 Day 28 1.1 1.7 1.0 1.4
Variation -45% -23% -37% -22%

T3 thyroid hormone levels decreased on all of these severely calorie restricted diets. However, when PUFA was high (50P/10C and 70P/10C) the decrease in T3 was much larger than when PUFA was low (50P/76C and 70P/86C).

In a 1992 paper, Vasquez et al compared two very low calorie diets (600kcal/day), one ketogenic and the other nonketogenic [6]. The fat sources were soybean oil and refined and stabilized vegetable oils.

Ketogenic Nonketogenic
Protein 35% 34%
Fat 58% 15%
Carbs 9% 51%
T3 Day 0 1.4 1.5
T3 Day 28 0.8 1.3
Variation -43% -13%

The various studies cited by Colpo also show decreases in T3 levels in diets high in PUFA. In Ullrich et al 1985 [4], a study of healthy young adults, although TSH, T4, and rT3 did not change significantly, T3 levels on a high polyunsaturated diet decreased more than on a high protein diet:

“The triiodothyronine (T3) declined more (P less than .05) following the HF diet than the HP diet (baseline 198 micrograms/dl, HP 138, HF 113). Thyroxine (T4) and reverse T3 (rT3) did not change significantly. Thyroid-stimulating hormone (TSH) declined equally after both diets”

In the Vermont study [3], where the low carb diet was high in PUFA fat, that was the case too:

“During maintenance eating, levels of T3 (triiodothyronine) were higher on the high-carb diet. When subjects on the low-carb diet began eating the higher-carb mixed weight gain diet, their T3 levels rose. T3 levels among those who went from the high-carb maintenance diet to the mixed diet remained unchanged. In contrast to T3, serum concentrations of T4 were unchanged by overeating or changes in dietary composition.” [1]

Low-PUFA High-Fat Diets and the Thyroid: Lack of Direct Evidence

Unfortunately we don’t have human studies comparing diets high in saturated fat and polyunsaturated fat and their effect on thyroid hormones synthesis. Neither do we have studies showing what happen to T3 levels after a high saturated/monosaturated fat diet is eaten. We will have to rely on indirect evidence.

Indirect Evidence: Calories Required to Maintain Weight.

There is a connection between thyroid activity and obesity. Reduced thyroid activity reduces energy expenditure (“calories out”) and promotes weight gain; normal thyroid function tends to promote normal weight. So we can use the vast number of obesity studies as indirect evidence for the effects of different types of diet on the thyroid.

Anthony emphasized this relationship in his post, noting findings of the Vermont study on overfeeding:

“Again, that both groups gained weight should come as no surprise. However, the group overfed the mixed diet required more calories (2,625 kcal/m2 per day) to maintain their new heavier weights than did the group overfed fat (1,840 kcal/m2 per day). Baseline differences in metabolism between the two groups were ruled out, as there was no difference in total calories required to maintain initial lean weights.”

So the high-PUFA diet promoted weight gain: it caused excess weight to be retained at a lower calorie intake. This is consistent with reduced thyroid activity.

Is this effect due to a high-fat diet generally, or to high-PUFA diets only? Some insight into this question may be found in a blog post by Stephan Guyenet [7]. Rats fed isocaloric diets in which the fat source was varied among three groups – a beef tallow group (primarily saturated fat, 3% PUFA), an olive oil group (primarily unsaturated, 10-15% PUFA), and a safflower oil group (78% PUFA) – had highly variable weight gains. The olive oil group gained 7.5% more weight than the beef tallow group, and the safflower oil group 12.3% more weight.  This is exactly the same pattern found in the Vermont overfeeding study in man: reduced energy expenditure as the consumption of PUFA increases.

Since 1945, it has been known that men fed a high carbohydrate and then a high saturated fat diet needed about the same amount of calories to mantain their weight in cold temperature [18]. Here is the data, expressed in terms of the percentage of baseline calorie intake that the men had to eat to maintain their weight:

The high-fat diet consisted largely of butter and cream; the high-carbohydrate diet of extra sugar. When eating the butter and cream, subjects had to eat more calories to maintain weight than when eating the sugary diet – 202% of baseline calorie intake vs 191%. Every subject had to increase calories when eating high-fat. This suggests higher thyroid hormone levels on the high-saturated fat diet than on a high-carb diet.

The Volek Study

Anthony cited a study by Jeff Volek and others [2] on body composition and hormonal responses to a carbohydrate-restricted diet and said that:

Upon commencement of the low-carbohydrate diet a small calorie deficit and a significant increase in protein intake occurred, resulting in a mean 3.3 kilogram fat loss and a 1.1 kilogram lean mass gain. There was a significant increase in total T4 (+10.8%), but for some reason the researchers did not directly measure T3 nor rT3. They instead tested T3 uptake, an indirect measure of thyroxine binding globulin (TBG) in the blood, which tells us little of any real value about changes in actual thyroid hormone levels. The researchers also measured IGF-1, glucagon, total and free testosterone, sex hormone-binding globulin (SHBG), insulin-like growth factor-I (IGF-I), and cortisol. The only significant change noted was a reduction in insulin following the low-carbohydrate diet.

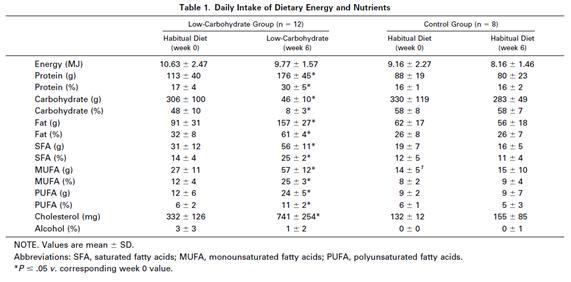
The Volek study is very interesting because it was not calorie restricted (only carbohydrate was restricted) and was done in normal-weight man. The amount of polyunsaturated fat increased a little (from 6 to 11% of calories), but was still low; saturated and monosaturated fats were the main fats of the low carb-high fat diet. Although he did not directly measured T3 nor rT3 we have indirect evidence that they were not impaired.

One very well known fact is that hypothyroid patients, even when taking T4 hormones, usually struggle to lose fat. This occurs because, when thyroid hormones are low, especially when T3 (triidothyronine) is low [8], the basal metabolism is decreased. If the LCHF diet was impairing the thyroid these healthy normal weight men, who had been advised to eat enough calories to maintain their weight during the intervention, should have struggled to lose fat mass. In fact they lost 3.3 kg (7.3 pounds) in 6 weeks on an 8% reduction in calorie intake. The control group did not lose any weight despite an 11% reduction in calorie intake.

More, testosterone levels usually decrease when thyroid hormones are low [9][10]. IGF-1 levels are also decreased in hypothyroidism [11][12]. Glucagon levels are higher in hypothyroid patients [13]. Sex hormone-binding globulin (SHBG) is low in hypothyroidism [14][15][16]. But none of these parameters changed during the LCHF diet.

So this diet which was low in carb (8% of calories) and moderately high in protein (30%) and PUFA (11%) does not seems to affect the thyroid if saturated and monosaturated fat (50% of calories) are the main fat of the diet. Let’s compare the fatty acid profile of the Volek diet with that of human milk:

Saturated Monounsaturated Polyunsaturated
Volek diet 41% 41% 18%
Human milk 47.5% 40.5% 12%

Not too much difference. Perhaps PUFA intake needs to be higher than 11% of calories or 18% of fat to impact the thyroid.

Effects of high fat and thyroid responses to cold.

In 1945, Mitchell et al published two articles comparing the effects of proteins versus carbohydrates and fat versus carbohydrate on man’s tolerance to cold exposure [18][19]. Carbohydrate does better than protein, but worse than fat, at maintaining internal temperature as measured by rectal temperature.

On the first experiment, five men consumed a high protein diet (41% P, 40% F, 19% C) and five a high carbohydrate diet (11% P, 41% F, 48% C) for 5.5 months. Food intake was adjusted to mantain a constant body weight.

The effect of decrement in rectal and mean skin temperature during eight hour exposure to cold with light clothing:

Rectal Temp Skin Temp
High Protein 1.63 5.21
High Carb 1.05 3.65
Significance P=0.017 P=0.0096

On the second experiment, five men consumed a high fat diet (10% P, 73% F, 17% C) and five a high carbohydrate diet (10% P, 23% F, 67% C) for 56 days. Food intake was adjusted to maintain a constant body weight. The excess fat of the high fat group was provided by butter and cream.

Decrement in rectal temperature from the first two hour to the last two hours of 6 hours exposures to -20º F (-29º C), with variable number of intervening meals:

Number of intervening meals Difference 

0 and 1 meal

Difference 

0 and 2 meals

None One Two
High Carb 0.71 0.72 0.68 -0.01 0.02
High Fat 0.60 0.36 0.33 0.24 0.27
Significance None P=0.034 P=0.018 P=0.083 

P=0.051*

P=0.11 

P=0.009*

* These probabilities pertain only to the high fat diet

What is clear here, is that 6 hours exposures to -20º F decreased rectal temperature equally in both groups if no meal was ingested. Eating a high carb meal between the intervention did not produced any alteration. But, eating a high fat meal cut the decrement in rectal temperature in half.

Thyroid hormones are responsible for basal metabolic rate and heat production.

So, if a high saturated fat diet maintains body temperature better than a high carbohydrate diet when the body is subjected to cold, it would seem fair to assume that the thyroid functions better on this high saturated fat diet.

Conclusion

A diet with sufficient but not excess protein, moderate carbohydrate comprising a minority of calories, and high intake of saturated and monounsaturated fat but low intake of polyunsaturated fat would seem to be optimal for thyroid function. But this is the Perfect Health Diet!

References:

[1] Anthony Colpo. Is a Low Carb Diet Bad For Your Thyroid?.  http://anthonycolpo.com/?p=1743

[2] Volek JS et al. Body composition and hormonal responses to a carbohydrate-restricted diet. Metabolism. 2002 Jul;51(7):864-70. http://pmid.us/12077732

[3] Danforth E Jr et al. Dietary-induced alterations in thyroid hormone metabolism during overnutrition. J Clin Invest. 1979 Nov;64(5):1336-47. http://pmid.us/500814

[4] Ullrich IH et al. Effect of low-carbohydrate diets high in either fat or protein on thyroid function, plasma insulin, glucose, and triglycerides in healthy young adults. J Am Coll Nutr. 1985;4(4):451-9. http://pmid.us/3900181

[5] Vazquez JA et al. Protein metabolism during weight reduction with very-low-energy diets: evaluation of the independent effects of protein and carbohydrate on protein sparing. Am J Clin Nutr. 1995 Jul;62(1):93-103. http://pmid.us/7598072

[6] Vazquez JA et al. Protein sparing during treatment of obesity: ketogenic versus nonketogenic very low calorie diet. Metabolism. 1992 Apr;41(4):406-14. http://pmid.us/1556948

[7] Whole Health Source. Vegetable Oil and Weight Gain. http://wholehealthsource.blogspot.com/2008/12/vegetable-oil-and-weight-gain.html

[8] Danforth E Jr, Burger A. The role of thyroid hormones in the control of energy expenditure. Clin Endocrinol Metab. 1984 Nov;13(3):581-95. http://pmid.us/6391756

[9] Cavaliere H et al. Serum levels of total testosterone and sex hormone binding globulin in hypothyroid patients and normal subjects treated with incremental doses of L-T4 or L-T3. J Androl. 1988 May-Jun;9(3):215-9. http://pmid.us/3403362

[10] Kumar A et al. Hypoandrogenaemia is associated with subclinical hypothyroidism in men. Int J Androl. 2007 Feb;30(1):14-20. Epub 2006 Jul 24. http://pmid.us/16879621

[11] Akin F et al. Growth hormone/insulin-like growth factor axis in patients with subclinical thyroid dysfunction. Growth Horm IGF Res. 2009 Jun;19(3):252-5. Epub 2008 Dec 25. http://pmid.us/19111490

[12] Soliman AT et al. Linear growth, growth-hormone secretion and IGF-I generation in children with neglected hypothyroidism before and after thyroxine replacemen. J Trop Pediatr. 2008 Oct;54(5):347-9. Epub 2008 May 1. http://pmid.us/18450819

[13] Stanická S et al. Insulin sensitivity and counter-regulatory hormones in hypothyroidism and during thyroid hormone replacement therapy. Clin Chem Lab Med. 2005;43(7):715-20. http://pmid.us/16207130

[14] Dittrich R et al. Thyroid hormone receptors and reproduction. J Reprod Immunol. 2011 Jun 3. http://pmid.us/21641659

[15] Krassas GE et al. Thyroid function and human reproductive health. Endocr Rev. 2010 Oct;31(5):702-55. Epub 2010 Jun 23. http://pmid.us/20573783

[16] Carani C et al. Multicenter study on the prevalence of sexual symptoms in male hypo- and hyperthyroid patients. J Clin Endocrinol Metab. 2005 Dec;90(12):6472-9. Epub 2005 Oct 4. http://pmid.us/16204360

[17] Bandini LG et al. Metabolic differences in response to a high-fat vs. a high-carbohydrate diet, Obes Res. 1994 Jul;2(4):348-54. http://pmid.us/16358395

[18] Mitchell HH, Glickman N, et al. The tolerance of man to cold as affected by dietary modification; carbohydrate versus fat and the effect of the frequency of meals. Am J Physiol. 1946 Apr;146:84-96. http://pmid.us/21023298

[19] Mitchell HH, Glickman N, et al. The tolerance of man to cold as affected by dietary modifi-cation; proteins versus carbohydrate and the effect of variable protective clothing. Am J Physiol. 1946 Apr;146:66-83. http://pmid.us/21023297

[20] Smith RE et al. Metabolism and cellular function in cold acclimation. Physiol Rev. 1962 Jan;42:60-142. http://pmid.us/13914396


About the Food Plate

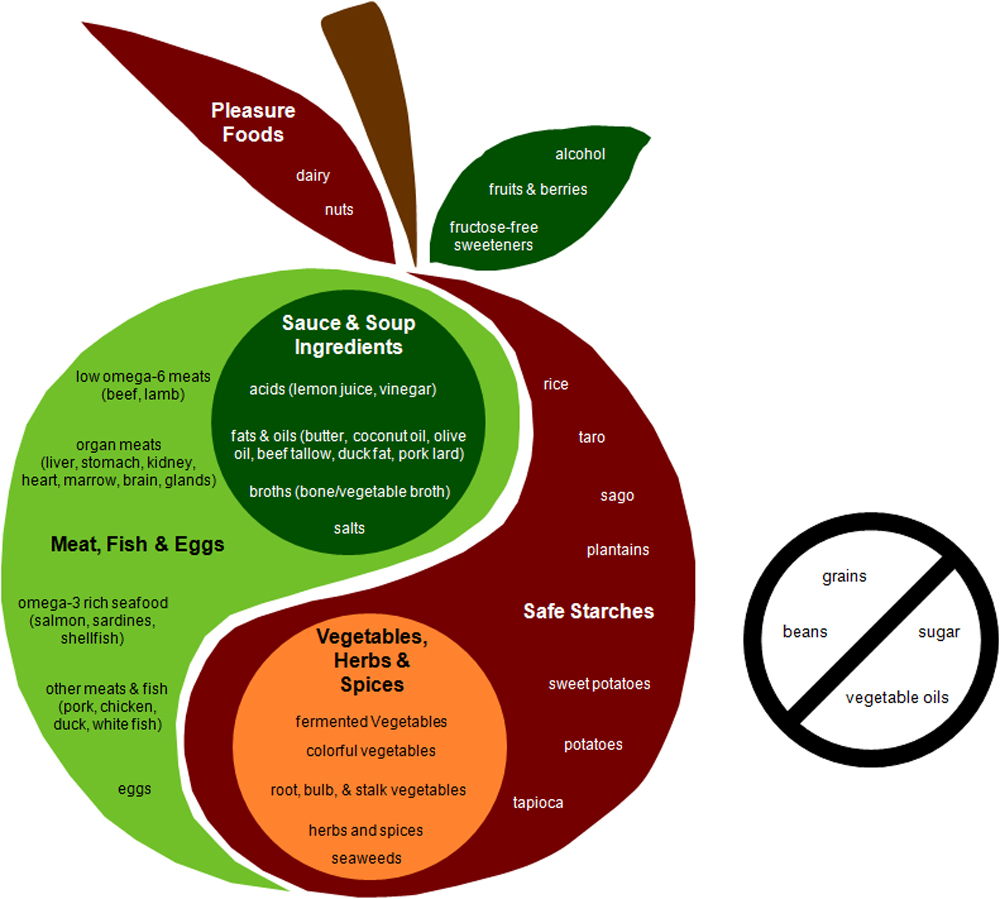
Thanks to everyone who gave us advice on the Perfect Health Diet food plate:

It’s very helpful to hear your thoughts. I thought I’d respond here.

Supplements

Garymar asks “where are the supplements?” Perhaps this was tongue in cheek, but it’s a fair question. To be honest it never occurred to us to put supplements in, as the graphic was meant to address the question “How do I construct a meal [or a day’s food]?”

That said, I notice the Harvard Healthy Eating Pyramid features a multivitamin plus vitamin D. Moreover the base of their pyramid has “Daily Exercise & Weight Control” sections! So there is a precedent.

On the other hand, they consider beef, rice, and potatoes foods to “Eat Sparingly,” and wheat as foundational, so I’m not sure they’re a good model.

YinYang

Kirk thought our diet is unbalanced toward fat, and so a symbol indicating balance was inappropriate. However, foods and macronutrients are different things; fat can come from plants (coconut oil, olive oil) as well as animals. Moreover, the plate is oriented toward meal construction, ie food, not nutrients.

Michelle, for one, was unsure how to relate macronutrients to food:

I am a reader who never quite caught on to how much of every macronutrient I should be eating in order to be PHD compliant.

Upon reading the book, I could not picture how much “400-600 carb calories” were, or “200 protein calories”.

One purpose of the food plate is to help solve this problem. Kirk himself took the correct inference from the diagram:

To my eye, the proposed diagram insinuates there should be equal servings of meat/fish/eggs/sauces/soups as balanced with servings of vegs/herbs/spices/safe-starches.

Yes! Because the plant foods we recommend have 100 to 600 calories per pound, while the animal foods and fats have 600 to 3,500 calories per pound, a diet that obtains most calories from animal foods can still get most of its matter from plant foods. As Gary pointed out:

On a high fat diet, the quantity of fat looks small compared to the quantity of vegetables.

Our diet really is fairly balanced between the food groups.

Our thanks to those who stuck up for the symbol, including Pam (“I like the yin-yang symbol a lot! i believe this is meant for portion (volume) right?”) and especially Ellen, who is an authority:

I like the use of the Taiji symbol…. I did not think it was meant to convey equal amounts of each food group as much as the *concept* of balance (and change) over all. This, in spite of having studied (with Master Jou among others) and taught Taji.

Artistry

Beth had a number of great suggestions. One was to merge the “Do Not Eat” foods into the apple by putting them in the apple’s shadow. In fact, we do have an apple with a shadow, and that might work well.

Erp suggested a snake (carrying the apple as in Genesis) or a worm coming out of the apple to represent forbidden foods. Sorry, erp, doesn’t sound appetizing!

Howard suggested we use the Zone Diet plate as a model. This is interesting because it actually has 3 plates, showing a 3-part strategy for constructing a meal. This “dynamic” imagery is something to consider.

Paul A had an excellent suggestion:

Nitpicky comment: wouldn’t it be more intuitive to have meats in the red section and plants in the green?

Yes. Another aspect we hadn’t thought of: in Chinese theory, most plant foods are considered “yin” (thus belonging on the left) and meat, fish and eggs as “yang” (on the right).

Next question: If we’re moving Safe Starches to the left and Meats to the right, would this be interpreted as a “farewell to Paleo”?

Are the “Pleasure Foods” too small?

Bethany asked if dairy was such a small part of the diet? The same could be asked for fruits and berries. (Mallory said, “I like fruits more than your plate does.” So do we, Mallory!) Or even for the “fructose-free sweeteners,” such as rice syrup, which are as fundamentally benign as the safe starches they are derived from.

Maybe we need to add more leaves to the apple stem. Especially if we take up erp’s suggestion to devote the stem to the chocolate food group!

On a related matter, Dale asked why sugar was excluded:

I like it … except for the no sugar part. People are going to eat it anyway so why not be sensible and suggest it in moderation?

Well, we support fruit, berries, and starch-derived sweeteners such as rice syrup. We’ve got ways to satisfy a sweet tooth. Is there really a rationale for including table sugar in a diet? I’m sure everyone will eat sucrose from time to time, but why should we endorse it?

Right Amount and Kind of Information?

Ellen thought we could include more information:

This might be too wordy, but perhaps you could indicate the range under the sections, i.e. meat, eggs, fish (1/2 to 1 lb/day).

MarkES (“a simple visual of food proportions when people look at their own plates”) and Erik (“I also agree with some of the other posters that there are too many words”) wanted less information. Mike Gruber was in the same camp:

Just a quick visual comparison between your chart and the competition leaves me with the impression that yours has too many words … will people read them? A chart is supposed to summarize something, and the more briefly the better.

This is an issue with no perfect solution. I don’t think we can put all information in the apple, and there will usually be some companion text that provides deeper explanations. But I don’t think we need to go quite so kindergartenish as the USDA Food Plate.

Michelle thought we might have missed the most important point of all:

[O]ur message at home is Eat Real Food, & Avoid Food Toxins. I’m not sure a glance at the PHD food plate would help them make sense of what to eat, in practical terms.

Hmmm. I had hoped the text made clear what desirable “Real Foods” and forbidden “Toxin-Rich Foods” were. Is there a better way to communicate the use of real foods? Perhaps little food images would work better than text.

A possible defect of including representative foods in text is that someone might mistakenly infer that un-named foods are forbidden. Hilary asks:

Should lime juice be included? Should yams be included on the list of safe starches?

Those are fine foods, but I don’t want the apple-plate to contain a laundry list of foods. The listed foods are representative — similar foods may also be eaten.

Conclusion

You’ve certainly given us food for thought — and ideas for desirable revisions. Thanks much!