Yearly Archives: 2011 - Page 7

Around the Web; Green Meadows Farm Edition

We had a delightful tour today at Green Meadows Farm in Hamilton, Massachusetts; I’ll write more about it tomorrow. Thanks to Andrew and Diana Rodgers for showing us around.

Also on Sunday October 23, Paul will be on Cary Nosler’s Wide World of Health radio show at 4 pm Eastern / 1 pm Pacific. It’s possible to listen live on the Talk 650 KSTE web site.

[1] Perfect Ego-Gratifying Book Review: Over at Health Correlator, Ned Kock has reviewed our book. Ned is one of the smartest and most interesting bloggers in the Paleosphere, so we were delighted that he liked our book. In his first paragraph, he links “Perfect Health Diet” to “Facebook”, and later he speaks of Shou-Ching and me in the same breath with well-known scientists:

Their main PhD disciplines are somewhat similar to Einstein’s and Curie’s; which is an interesting coincidence. What the Jaminets have written about nutrition is probably analogous, in broad terms, to what Einstein and Curie would have written about nutrition if they were alive today.

If they were alive today, they’d be 132 and 144 years old respectively, and everyone would be intensely interested in their nutitional tips!  So we take that as high praise indeed.

Ned’s wasn’t the only pleasing review we got this week; Dr. Srdjan Andrei Ostric wrote a generous endorsement of our book. I was also pleased that one of Dr Ostric’s readers did NOT directly compare me to her emotionally abusive ex.

[2] Interesting posts this week:

Andrew Badenoch of Evolvify downgrades potatoes and rice to “sneaky untrustworthy bastards” and bok choy to “I’m not making out with you if you eat that.” This was in response to that interesting miRNA study I mentioned in a previous Around the Web. Richard Nikoley offered his thoughts.

One of Richard’s commenters hopes we’ll critique the study. It’s not an easy study to critique because it’s the first of its kind; everything about it is interesting, but very likely not all the results will be reproducible. Also, it’s premature to draw any conclusions about how it affects diet, since all plant and animal cells contain microRNA, and there’s nothing special about the miRNAs of rice or potato. If rice miRNAs can survive cooking and digestion and cross cellular membranes and affect gene expression, so will miRNAs from every other plant and animal food. That would imply that we evolved with a background level of dietary miRNAs in our cells. The implications for diet are hard to fathom, except that it probably strengthens the case for eating in an ancestral manner, since an ancestral diet would deliver a mix of miRNAs we evolved to handle.

Emily Deans summarized yesterday’s talks at TEDx Cambridge. A line that caught my eye:

Lustig seems to feel that fructose, MCTs, and BCAAs are damaging to the mitochondria and lead to insulin resistance (thus he is anti-corn fed beef, as corn-fed beef is higher in BCAAs than grassfed, apparently.)

I’m pro BCAAs. Is that a reason to favor corn-fed beef?

Two PaleoHackers, Kamal and Aravind, tried to reduce food reward and lost weight. Stephan Guyenet recounts their story.

J Stanton has another blockbuster exposition on food reward, which contains a challenge to Stephan’s recommendations for weight loss: eating food you like decreases quantity of food consumed more than eating bland food.

Lucas Tafur reports that some mouth bacteria can digest gluten, making wheat safer for their hosts.

Mike Gruber’s triglycerides went down after he added starches and supplements in line with Perfect Health Diet recommendations. Was it the starch, or the micronutrients?

Melissa McEwen compares overeating to porn addiction and discusses Paleomedicine.

Oetzi the Iceman had Lyme disease. Folks with Lyme infections are more likely to be diagnosed with psychiatric disease. Oetzi was discovered in a reclining posture. Coincidence?

Dr Steve Parker links to Vitruvius at The Sagacious Iconoclast, who explains how Paleolithic man might have made cheese: “transport milk in mammal stomach vessels containing natural rennet, in the heat, thousands of years ago, and voila: curds and whey.”

In the New York Times, a woman has survived a dangerous cancer by retreating to national parks. She’s not the only one; the combination of sunshine, exercise, and nature seems to have a strong anti-cancer effect.

Darrin Carlson wrote on The Five Failings of Paleo. You might have seen the piece reprinted at Free the Animal.

John Durant is manly, in a Jack Sparrow Dances with Wolves kind of way.

Jamie Scott says: Make your own antioxidants.

Mark Sisson says: For healthy mitochondria, eat fat.

Dr BG fostered a kitty, and reflects on human evolution.

Nourished Kitchen has tips for a healthier Halloween.

Let’s see, there was the Permian-Triassic Extinction, the Cretaceous-Tertiary Extinction – the 1883 Extinction?

[3] Cute animal photo:

Via Yves Smith.

[4] A mini-debate on protein and longevity:  In the comment thread to Ned Kock’s review of our book, Ned has an excellent counterargument about protein and longevity:

Here is another counterpoint to the notion that increased protein intake leads to decreased longevity. A BMI of 25 is generally associated with the lowest mortality: http://bit.ly/fWdsPC

Now, we know that as people age they generally tend to lose body mass (contrary to popular opinion), primarily due to loss of lean body mass, which seems to outpace body fat gain.

Increased protein consumption seems to counter that, and this appears to be related to both bone and muscle retention, contributing to a higher BMI.

So it is not unreasonable to conclude that the relatively high BMI of 25 is associated with retention of lean body mass with age, even as body fat gradually increases as well, leading to the perception that the fat are the ones living the longest.

Of course I am not talking about 600 g/d of protein. These seniors seem to have done quite well in terms of bone retention at around 85-90 g/d: http://bit.ly/f1Pi3T

In another comment Ned mentions receiving from O Primitivo a link to a paper that looks fascinating.

[5] The End of Human Progress: Via Joshua Newman, an aphorism from Ben Franklin:

I have always thought that one man of tolerable abilities may work great changes, and accomplish great affairs among mankind, if he first forms a good plan, and, cutting off all amusements or other employments that would divert his attention, make the execution of that same plan his sole study and business.

A corollary from Paul Jaminet:

Humanity will stagnate until the Internet becomes boring.

[6] Autism Updates:

Weston A Price might have something to say about possible nutritional factors behind this finding: Autistic children have an altered facial structure, characterized by wider eyes, a broader upper face, wider mouth and philtrum, but shorter middle region of the face including cheeks and nose.

There seems to be a connection between maternal gestational diabetes and autism. A Rice University professor discusses the link:

[7] Not the Weekly Video: Why Paleolithic man didn’t bicycle:

[8] Shou-Ching’s Photo Art:

[9] Weekly video: Never trust an animal that wears a tuxedo!

Via Bix.

How to Minimize Hyperglycemic Toxicity

In my reply to Jimmy Moore’s safe starches symposium (see Jimmy Moore’s seminar on “safe starches”: My reply, Oct 12), I didn’t quite have time to fully address the issue of hyperglycemic toxicity.

As J Stanton commented, it would have been good to note that we recommend consuming “safe starches” as parts of meals, not as isolated snacks, and to discuss how meal design mitigates risk of hyperglycemic toxicity:

I’ve written entire articles on the fact that fat content is the primary driver of glycemic index. It’s silly to demonize white potatoes due to high GI when a couple pats of butter – or simply consuming it as part of a PHD-compliant high-fat meal – will drop it far more than substituting a sweet potato.

I thought I’d delve into the factors affecting blood glucose response to meals, and how to minimize the rise in blood sugar. It’s a topic of general interest, since hyperglycemia might have a mild detrimental health effect in nearly everyone; but of special importance to diabetics, since controlling blood sugar is so crucial to their health.

Glycemic Index of Safe Starches

The glycemic index (GI) is “defined as the area under the two hour blood glucose response curve (AUC) following the ingestion of a fixed portion of carbohydrate (usually 50 g).” Pure glucose in water is used as the reference and defines a GI of 100.

Our recommended “safe starches” are significantly lower in GI than glucose.

White rice is typically listed with a GI of 70 or 72, but it varies by strain: Bangladeshi rice has a GI of 37, American brown rice of 50, Japonica (a white short-grained rice) of 48, Basmati rice of 58, Chinese vermicelli of 58, American long-grain rice of 61, risotto rice of 69, American white rice is 72, short-grain white rice is 83, and jasmine rice 89 (source).

Potatoes are a high-GI food but again the GI is highly variable. Baked white potatoes with the skin have a GI of 69, peeled their GI is 98. Yams have GI of 35 to 77 depending on how they are prepared, sweet potatoes of 44 to 94 (source).

With some foods the GI varies strongly with ripeness. Plaintains when unripe have a GI of 40 but when ripe the GI can reach 90 (source).

Taro has a GI of 48 to 56. That’s similar to many fruits, such as bananas which have a GI of 47 to 62. Tapioca has a GI of 70 if steamed, but can exceed 80 if boiled (source).

Gentle Cooking Lowers the Glycemic Index

As a rule, gentle cooking of starchy plants leads to a lower glycemic index and high cooking temperatures lead to a higher glycemic index.

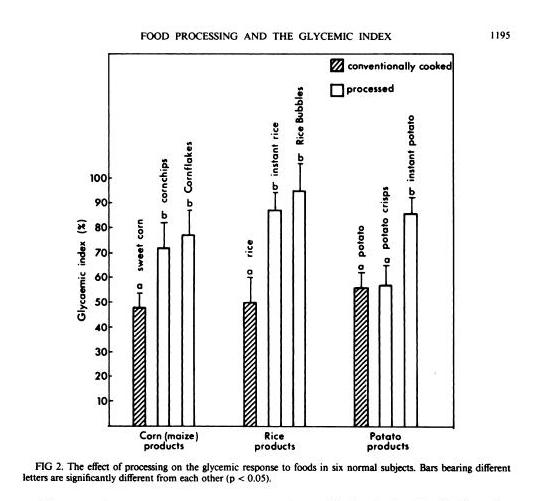
In general, industrially processed foods, which are often processed at very high temperatures to speed them through factories, have high GIs. A study in the American Journal of Clinical Nutrition [1] compared home-cooked corn, rice, and potato with processed foods based on them (instant rice, Rice Bubbles, corn chips, Cornflakes, instant potato, and potato crisps), and the processed foods had consistently higher GIs:

Another study in the British Journal of Nutrition [2] looked at 14 starchy plants prepared in different ways and found that roasting and baking raised the GI:

GI value of some of the roasted and baked foods were significantly higher than foods boiled or fried (P<0.05). The results indicate that foods processed by roasting or baking may result in higher GI. Conversely, boiling of foods may contribute to a lower GI diet.

Perhaps cooking methods that dry out the plant increase the GI.

Meals Have Lower GI

GI is calculated by eating a single food and only that food.

But what happens when you eat a meal? You’re no longer eating one food, but a mixture of foods. The baked potato may come with meat and vegetables, and with butter on top.

You might think that a weighted average of the GI of the various foods might give a good indication of the GI of the meal. Then, since fat, meat, and vegetables have a low GI, you’d expect GI of the meal to be much lower.

It turns out that the GI of meals is low – in fact, it is even lower than the average GI of the foods composing the meal.

That is the result of a new study in the American Journal of Clinical Nutrition [3]. Three meals were prepared combining a starch (potato, rice, or spaghetti) that digested to 50 g (200 calories) glucose with vegetables, sauce, and pan-fried chicken. The GIs of the meals were consistently lower than the values predicted using a weighted average of GIs of the meal components:

Meal Actual GI Predicted GI
Potato 53 63
Rice 38 51
Spaghetti 38 54

So eating a starch as part of a meal reduces GI to the range 38 to 53 – below the levels of many fruits and berries.

Fat Reduces GI

J Stanton has noted that adding a little fat to a starch is very effective in lowering its GI. In a post titled “Fat and Glycemic Index: The Myth of Complex Carbohydrates,” JS states that:

  • Flour tortillas have a GI of 30, compared to a GI of 72 for wheat bread, because tortillas are made with lard.
  • Butter reduces the glycemic index of French bread from 95 to 65.
  • A Pizza Hut Super Supreme Pizza has a GI of 30, whereas a Vegetarian Supreme has a GI of 49.

JS suggests that the reason fat does this is that it lowers the gastric emptying rate, and cites a study which showed that adding fat to starches could increase the gastric emptying time – the time for food to leave the stomach – by 50%. [4]

What’s interesting to me here is that what we really care about is not the glycemic index, but the peak blood glucose level attained after a meal. It is blood glucose levels above 140 mg/dl only that are harmful, and the harm is proportional to how high blood glucose levels rise above 140 mg/dl. So it’s the spikes we want to avoid.

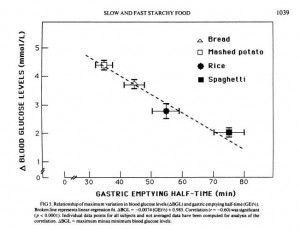
But another paper shows that gastric emptying rate is even more closely tied to peak blood glucose level than it is to glycemic index. From [5]:

So combining a starch with fat may reduce peak blood glucose levels even more than it reduces the glycemic index; which is a good thing.

Dairy reduces GI

Dairy is effective at reducing GI:

[D]airy products significantly reduced the GI of white rice when consumed together, prior to or after a carbohydrate meal. [6]

It is not likely that dairy fat alone was responsible, because whole milk worked better than butter. However, low-fat milk only reduced the GI of rice by 16%, while whole milk reduced it by 41%. So clearly dairy fats are part of the recipe, but not the whole story; whey protein may also matter.

Fiber Reduces GI

Fiber is another meal element that reduces the rise in blood sugar after eating.

Removing fiber from starchy foods increases their glycemic index [7]; adding fiber decreases it. For instance, adding a polysaccharide fiber to cornstarch reduced its GI from 83 to 58; to rice reduced its GI from 82 to 45; to yogurt from 44 to 38. [8]

So it’s good to eat starches with vegetables – the foods richest in fiber.

Acids, Especially Vinegar, Reduce GI

Traditional cuisines usually make sauces by combining a fat with an acid. Frequently used sauce acids are vinegars and citric acid from lemons, limes, or other citrus fruits.

It turns that sauce acids can substantially reduce the GI of meals. The best attested is vinegar. From a study in the European Journal of Clinical Nutrition [6]:

In the current study, the addition of vinegar and vinegared foods to white rice reduced the GI of white rice. The acetic acid in vinegar was thought to be responsible for the antihyperglycemic effect. The amount of acetic acid to be effective could be as low as that found in sushi (estimated to be about 0.2–1.5 g/100 g). The antihyperglycemic effect of vinegar is consistent with other studies performed earlier (Brighenti et al, 1995; Liljeberg & Bjorck, 1998). Although vinegar could lower GI vales, the mechanism has rarely been reported. Most studies accounted the mechanism to be due to a delay in gastric emptying. In animal studies, Fushimi (Fushimi et al, 2001) showed that acetic acid could activate gluconeogenesis and induce glycogenesis in the liver after a fasting state. It could also inhibit glycolysis in muscles. [6]

Other acids also work. Pickled foods, which are sour due to lactic acid released by bacteria, reduce the glycemic index of rice by 27% if eaten before the rice and by 25% if eaten alongside the rice [6].

Wines, especially red wines, are somewhat acidic. I haven’t seen a study of how drinking wine with a meal affects glycemic index, but it is known observationally that wine drinkers have better glycemic control and, often, long lives. [9]

So What’s the Healthiest Way to Eat “Safe Starches”?

One way to limit the likelihood of reaching dangerous blood sugar levels after a meal is by eating a relatively “low carb” diet. We recommend that sedentary people eat about 400 to 600 carb calories per day. This limits the amount eaten at any one sitting to about 200 calories / 50 g, which is the amount of a typical glucose tolerance test. It is an amount the body is well able to handle.

But the manner in which carbs are eaten may be just as important as the amount.

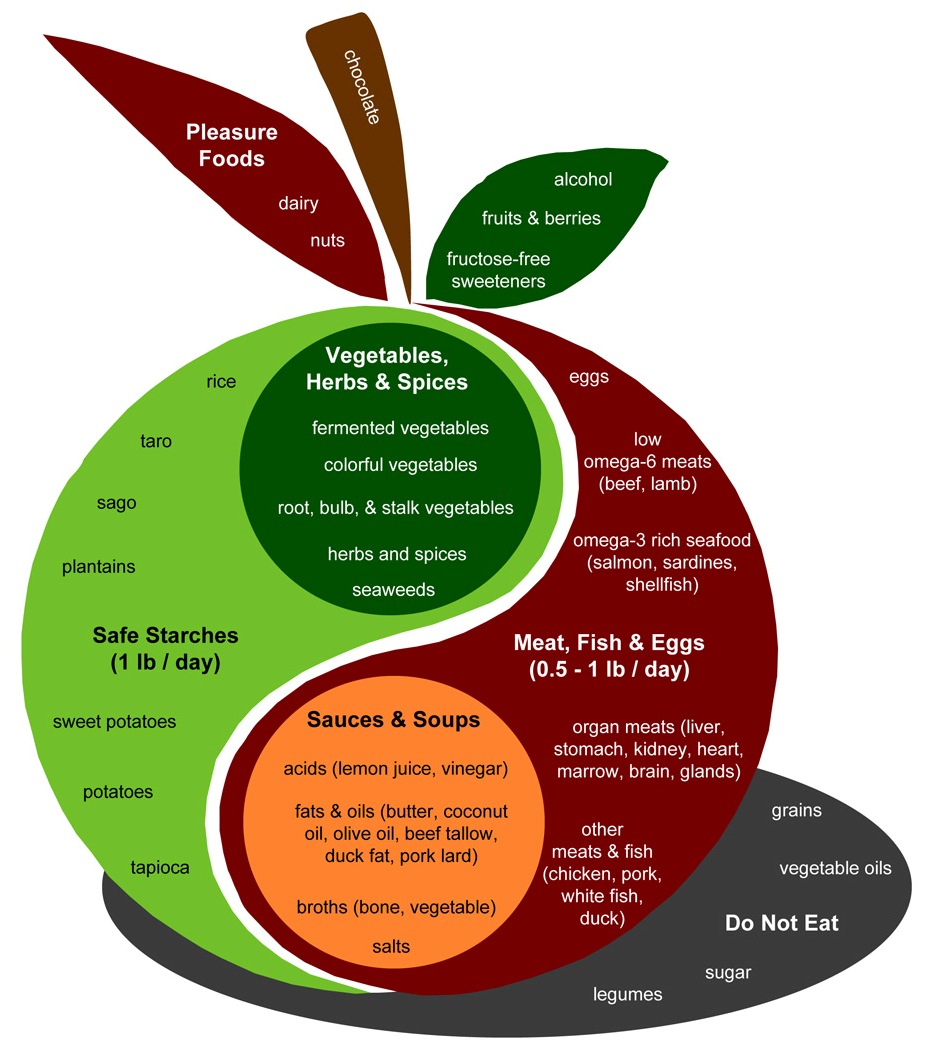
Let’s look again at the Perfect Health Diet Food Plate:

The design of a PHD meal is found in the body of the apple. Assuming two meals a day, the recipe is to combine:

  • A safe starch (roughly ½ pound, which translates to 150 to 300 carb calories);
  • A meat, fish, or egg (¼ to ½ pound);
  • A sauce made up of fats and acids such as lemon juice or vinegar;
  • Vegetables, preferably including fermented vegetables with their healthy acids;
  • (Optionally) some dairy or a glass of wine.

This is precisely the recipe which science has found minimizes the elevation of blood glucose after meals.

It seems reasonable to expect that a meal designed in this fashion will have a glycemic index around 30. The odds of 200 carb calories with a glycemic index of 30 generating blood sugar levels that are dangerous – 140 mg/dl or higher – in healthy people is very low. Even in diabetics, it may be uncommon.

So, yes, Virginia. There is a Santa Claus, and you can eat safe starches and avoid hyperglycemia too!

References

[1] Brand JC et al. Food processing and the glycemic index. Am J Clin Nutr. 1985 Dec;42(6):1192-6. http://pmid.us/4072954.

[2] Bahado-Singh PS et al. Food processing methods influence the glycaemic indices of some commonly eaten West Indian carbohydrate-rich foods. Br J Nutr. 2006 Sep;96(3):476-81. http://pmid.us/16925852.

[3] Dodd H et al. Calculating meal glycemic index by using measured and published food values compared with directly measured meal glycemic index. Am J Clin Nutr. 2011 Oct;94(4):992-6. http://pmid.us/21831990.

[4] Thouvenot P et al. Fat and starch gastric emptying rate in humans: a reproducibility study of a double-isotopic technique. Am J Clin Nutr 1994;59(suppl):781S.

[5] Mourot J et al. Relationship between the rate of gastric emptying and glucose and insulin responses to starchy foods in young healthy adults. Am J Clin Nutr. 1988 Oct;48(4):1035-40. http://pmid.us/3048076.

[6] Sugiyama M et al. Glycemic index of single and mixed meal foods among common Japanese foods with white rice as a reference food. Eur J Clin Nutr. 2003 Jun;57(6):743-52. http://pmid.us/12792658. Full text: http://www.nature.com/ejcn/journal/v57/n6/full/1601606a.html.

[7] Benini L et al. Gastric emptying of a solid meal is accelerated by the removal of dietary fibre naturally present in food. Gut. 1995 Jun;36(6):825-30. http://pmid.us/7615267.

[8] Jenkins AL et al. Effect of adding the novel fiber, PGX®, to commonly consumed foods on glycemic response, glycemic index and GRIP: a simple and effective strategy for reducing post prandial blood glucose levels–a randomized, controlled trial. Nutr J. 2010 Nov 22;9:58. http://pmid.us/21092221.

[9] Perissinotto E et al. Alcohol consumption and cardiovascular risk factors in older lifelong wine drinkers: the Italian Longitudinal Study on Aging. Nutr Metab Cardiovasc Dis. 2010 Nov;20(9):647-55. http://pmid.us/19695851.


Bi Bim Bap

Our usual lunch is Bi Bim Bap – which is Korean for “leftovers.” (Literally, it means “mixed with rice.”)

Bi Bim Bap is a versatile dish which can be assembled out of almost any combination of ingredients. Like Cambridge Fried Rice, it is a classic Asian method for combining leftovers to create a meal in a bowl.

The Bi Bim Bap Recipe

The best place to look for a formula for Bi Bim Bap may be the Perfect Health Diet Food Plate:

The body of the apple contains our formula for a meal. Great meals combine four kinds of ingredients:

  1. A safe starch.
  2. Meat, fish, and eggs.
  3. Vegetables, herbs, and spices.
  4. A sauce made from fats and acids.

Our Version of Korean Bi Bim Bap

The classic Korean Bibimbap recipe uses barbecued beef and eggs as the meat, rice as the starch, mixed vegetables, and a Korean spicy sauce with sweet and sour flavors.

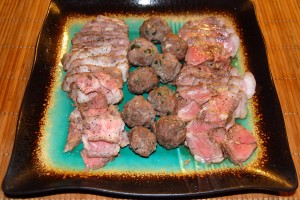
We assembled the following ingredients as an example. For meat we used meatballs and slices of leftover ribeye:

We also included eggs as a second kind of meat. As a base for the sauce we used Korean spicy sauce; here is a possible brand: Sunchang Gochujang 500g. Which is not perfect, as it contains soybean powderwheat, but as it’s quite spicy a little goes a long way. Chili flakes can substitute for the Korean sauce.

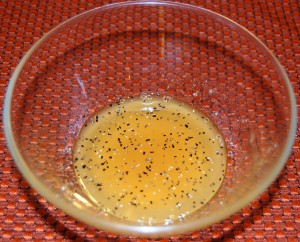
Koreans usually favor a mix of spicy, sweet, and sour flavors in the sauce. The sweet and sour can be provided by equal parts rice syrup and rice vinegar, plus a splash of sesame oil and salt and pepper:

The spicy sauce paste is mixed with this sweet and sour mixture to make the sauce. One tablespoon spicy sauce, 1 tablespoon rice syrup, and 1 tablespoon rice vinegar or lemon juice will make a good sauce. For children, increase the sweet and sour flavors and decrease the spicy/chili flavors.

For acids, lemon juice or lime juice, or some other flavor of vinegar, can be substituted for the rice vinegar.

For more spiciness, bits of jalapeno can be added. Egg yolk can provide an additional source of fat.

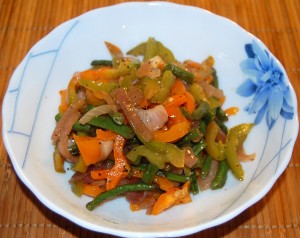
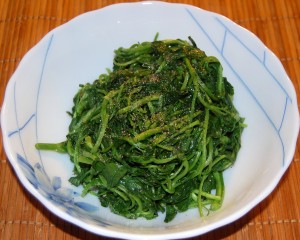
Include vegetables of your choice. These are onions, peppers, green bean, and watercress:

Kimchi (fermented vegetables) can be substituted for the vegetables.

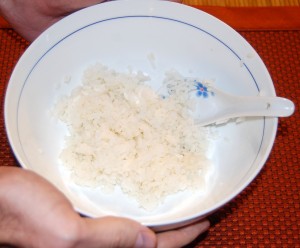
Everyone can make his own bowl. Since we’ve just been debating how much of the “safe starches” one should eat, here’s what we consider a full meal’s worth of rice:

This is 150 g of cooked white rice which works out to about 200 calories of carbs. We eat two meals a day so this works out to about 400 carb calories per day.

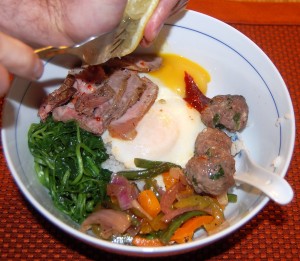
On top of the rice Paul has added meat, vegetables, egg, egg yolk, spicy sauce, and lemon juice:

A bit of rice syrup and a little more meat got the proportions to Paul’s liking.

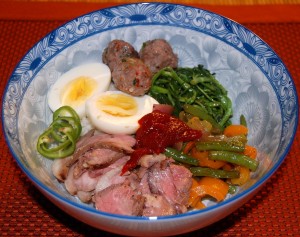
Here was Shou-Ching’s bowl:

Just mix all the ingredients together and eat!

Bi Bim Bap at Lunch

We didn’t take pictures, but Paul’s typical lunch is assembled like this:

  1. Whatever leftover safe starch is available is put at the bottom of the bowl. If this is potato or taro, Paul dices it up into small pieces; if it is rice it looks rather like the picture above.
  2. Paul adds 3 egg yolks and the juice of half or quarter lemon.
  3. Paul adds leftover meat and vegetables.
  4. Paul adds spices to taste. These may include spices with medicinal value, such as turmeric, and then curry or other spicy flavors. Or they may include salt and pepper, or rice syrup for a sweet flavor.
  5. The Bi Bim Bap is microwaved for a minute, then mixed and microwaved again until it is uniformly warm.

At dinner we usually cook at least twice as much as we intend to eat that night, so there are plenty of leftovers. The leftovers provide lunch and usually a Bi Bim Bap, Cambridge Fried Rice, or Japanese sushi buffet dinner of leftovers once during the week.

Around the Web; The Case of the Killer Vitamins

I’d like to thank Patrick Timpone for a very enjoyable interview on The Morning Show at One Radio Network. Here is the MP3; I’m on for the second half of the show. You can find a zip file at the archive for October 13. Patrick’s producer Sharon tells me that she’s already benefited from our book:

I was following The Primal Diet and since I read the book, I’ve been allowing myself potatoes and rice and doing very very well on them among doing some other things you recommend.

Also, I’d like to thank Jimmy Moore once more for hosting his highly entertaining “safe starch” symposium (Jimmy’s original post; my response, here and at Jimmy’s). It was great to get the opportunity to explain ourselves to so many people in the low-carb and Paleo movements.

Jimmy is planning to try our diet for a week in November, which will be a good occasion for us to publish a 7-day meal plan. We’ll invite anyone who’s curious to try the diet along with Jimmy, and compare notes.

[1] Interesting posts this week:

Angelo Coppola on Latest in Paleo wonders if Denmark’s saturated fat tax will apply to mother’s milk. If so, it’s bad news for unemployed infants! (He also discusses the “safe starch” debate.)

I once knew a French astronomer who died from snorting cocaine while observing at 14,500 feet. Emily Deans makes me wonder:  Did he have Crisco for dinner?

Stan the Heretic offers his mitochondrial dysfunction theory of diabetes. Peter Dobromylskyj and JS Stanton are also developing ideas along this line. Speaking of JS, his post this week has some great photos of Sierra wildflowers and reflections on the state of the Paleo community.

CarbSane partially confirms Dr. Ron Rosedale: eating carbs does raise leptin levels compared to eating fat, but it is a mild rise over an extended period of time, not a “spike.”

Beth Mazur explains why her bathroom door is always closed.

Chris Kresser discusses why chronic illness often generates a form of hypothyroidism, low T3 syndrome.

Joshua Newman knows how to flatter.

How solid is the case against Andrew Wakefield? Autism is certainly characterized by intestinal dysfunction, and Age of Autism notes that distinguished scientists are citing Wakefield’s work.

Richard Nikoley claims he doesn’t know the words to “Kumbayah.”

Seth Roberts points out that the Specific Carbohydrate Diet has been curing Crohn’s for 80 years, but still no clinical trial.

Jamie Scott, That Paleo Horse Doctor, asks: Why do horses get laminitis?

We’ve quoted vegetarian Dr. Michael Greger’s concerns about arsenic in eggs. I’m more concerned about soy protein in eggs.

Following Steve Jobs’s death, Tim asked for an opinion about the unconventional cancer therapies of Dr Mercola’s friend Nicholas Gonzalez. David Gorski, toward the end of a detailed examination of Jobs’s medical condition and treatment, links to his own claim that the Gonzalez protocol is “worse than useless.”

[2] Music to read by:

[3] Cute animal photo:

[4] Notable comments this week:

PeterC’s dad, who has diabetes, is doing well on our diet. Daniel’s stepdad had a similar experience.

Helen informs us that sweet potato intolerance may be due to raffinose.

Mario Iwakura gives us his infectious theory of diabetes. I think a lot of the cases of disrupted glucose regulation, where people get frequent hyperglycemic and hypoglycemic episodes, may be due to occult infections.

Dr Jacquie Kidd (who blogs at drjacs.com) has gotten some great advice from Jamie Scott.

Ellen tells us of cases of iodine supplementation controlling diabetes.

Ned is looking for grass-fed cowbells.

[5] Do Vitamins Kill?: An analysis of the Iowa Women’s Health Study came out this week, and it purported to show that nearly all supplements except calcium and vitamin D increased mortality, with iron being the worst. Oskar asked us to look into it, so we did.

The study followed a large number of women in Iowa, and queried them several times about supplement use. In 1986, the baseline, the women had an average age of 62 (range of 55 to 69) and 66% were taking supplements. By 2004, the surviving women had an average age of 82 and 85% were taking supplements.

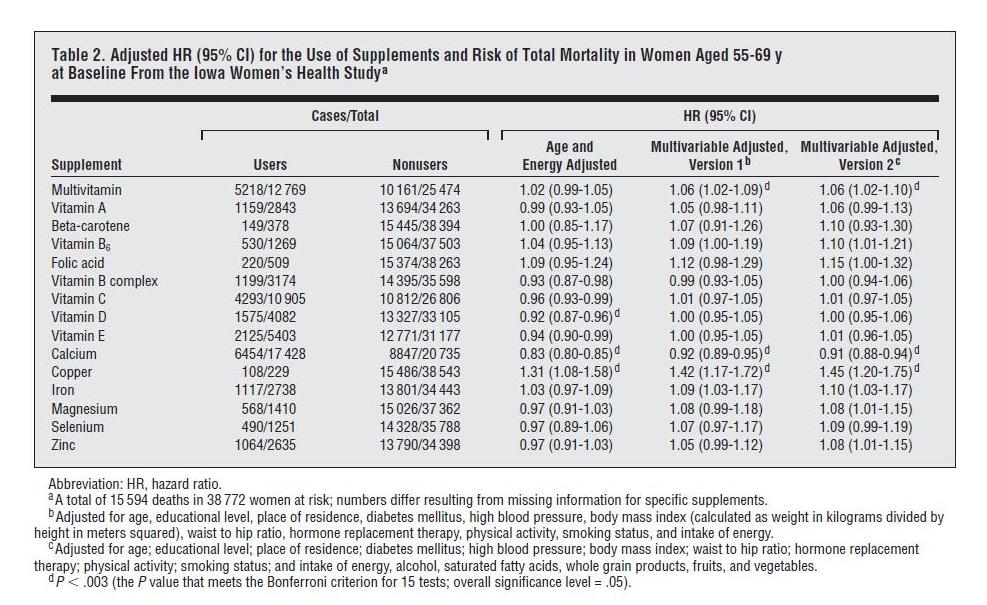
Here is the data on overall mortality vs supplement use:

“Cases” are instances of someone dying. “HR” or hazard ratio is the likelihood of dying if you supplement divided by the likelihood of dying if you don’t. Note that all the hazard ratio estimates are “adjusted.”

Unadjusted Hazard Ratios

The left columns of the table give us death statistics and allow us to calculate raw hazard ratios, with no adjustment whatsoever. Seven of the supplements have unadjusted HRs below 1.00, eight have unadjusted HRs above 1.00. The 15 HRs average to 1.01. Without copper, which has an unadjusted HR of 1.17, they average to 0.998. In short, death rates among supplementers were almost identical to death rates among non-supplementers.

This is interesting because supplement usage rose rapidly with age. It was 66% at age 62 and 85% at age 82. Supplement users were, on average, older than non-supplement users. But mortality rises rapidly with age. So there should have been a lot more deaths among the supplement users, just because of their more advanced age.

The paper should have, but didn’t, report age-adjusted hazard ratios. Adjusting for age is very important, since mortality depends strongly on age, and so does supplement use. However, it’s obvious what the result of age-only adjustment would have been. Supplement usage would have shown a substantial reduction in the risk of dying.

Hazard Ratios Adjusted for Age and Energy Intake

The least-adjusted hazard ratios reported in the paper are adjusted for age and energy intake.

The energy intake adjustment is disappointing, because energy intake is affected by health: healthier people are more active and eat more, and obese people also eat more. Including indices of health as independent variables in a regression analysis will tend to mask the impact of the supplements on health, creating misleading results.

However, let’s go with what we have. Based on “Age and Energy Adjusted” hazard ratios, supplements generally decrease mortality. Nine of the fifteen supplements decreased mortality, five increased mortality. At the 95% confidence interval, five supplements decreased mortality, only one increased mortality.

Looking at the specific supplements, results are mostly consistent with our book analysis. Let’s start with the five that showed harm:

  • Folic acid and iron – two nutrients we regard as dangerous and recommend not supplementing – both elevate mortality, as we would expect. Iron is particularly harmful, and should generally be avoided by women once they have stopped menstruating.
  • Multivitamins slightly increase mortality, a result that has been found before and that we acknowledge in the book. This is probably due to (a) an excess of folic acid, (b) an excess of iron (if the women are taking iron-containing multis after menopause), (c) an excess of vitamin A (this is no longer the case – multi manufacturers have reduced the A content of vitamins in response to data – but in 1986-2004 most multis contained substantial amounts of A) which is harmful in women with vitamin D and/or K2 deficiencies (both extremely common, and D deficiency in this cohort is supported by the benefits of D and calcium in the study and the northerly latitude of Iowa) or (d) imbalances in other nutrients; for reasons of bulk multis tend to lack certain minerals, notably magnesium and calcium.
  • Vitamin B6 is an anomaly, as we wouldn’t expect B6 to be harmful in moderation. I’m guessing B6 would have been taken to reduce high homocysteine and for this purpose would often have been taken along with folic acid, a harmful supplement. Also, B6 should be balanced by vitamin B12 and biotin, and may not have been. Perhaps people with cancer were unaware that B6 promotes tumor growth; (UPDATE: See comments; I was misremembering studies, B12 and folic acid can promote tumor growth, but in other studies B6 looks protective against cancer) indeed, in the breakdown by cause of death in Table 3, B6 increases cancer mortality by 6%, but CVD mortality by only 1%. (Folic acid and vitamin A were other cancer-promoting supplements.) The harm from B6 was not statistically significant and I wouldn’t read much into it.
  • Copper is another anomalous result, but this was the least popular supplement, taken by only 229 women or 0.59%. Copper’s hazard ratios were dramatically affected by adjustment: in the raw data, mortality is only 17% higher among copper supplementers, but after age and energy adjustment it is 31% higher, and multivariable adjustment increases it substantially again. Clearly the effect of copper is highly sensitive to adjustment factors, indicating that copper was being taken by an unusual population. I think the hazard ratio for copper is impossible to interpret without knowing why these women were supplementing copper. If we knew their situation, there would probably be an appropriate adjustment that would make a huge difference in mortality. I would say the numbers are too small, the population too skewed, and the information too limited to draw any conclusion here.

Overall, I would interpret the nine that showed benefits as being highly supportive of micronutrient supplementation. The fact that vitamin A, vitamin B complex, vitamin C, vitamin D, vitamin E, calcium, magnesium, selenium, and zinc all reduced mortality suggests that a well-formulated multivitamin would likely have reduced mortality.

Hazard Ratios After Multivariable Adjustment

Now, what about the “Multivariable Adjusted” results, which were responsible for the headlines?

We have to keep in mind a famous aphorism from the mathematician John von Neumann:

With four parameters I can fit an elephant, and with five I can make him wiggle his trunk.

The multivariable adjustments use 11 parameters and 16 parameters respectively. Using so many parameters lets the investigators generate whatever results they want.

I don’t think it’s a coincidence that both multivariable adjustments substantially increased the hazard ratio of every single one of the 15 supplements. The 11-variable adjustment increased hazard ratios by an average of 7%, the 16-variable adjustment by an average of 8.2%.

Rest assured, it would have been easy enough to find multivariable adjustments that would have decreased hazard ratios for every single one of the 15 supplements.

I believe it verges on the unethical that the variables chosen include dangerous health conditions: diabetes, high blood pressure, and obesity. These three health conditions just happen to be conditions that are often improved by supplementation.

Anyone familiar with how regression analyses work will immediately recognize the problem. The adjustment variables serve as competing explanations for changes in mortality. If supplementation decreases diabetes, high blood pressure, and obesity, and through these changes decreases mortality, the supplements will not get credit for the mortality reduction; rather the decreased diabetes, blood pressure, and obesity will get the credit.

Imagine we had a magic pill that completely eliminated diabetes, obesity, and high blood pressure, and reduced mortality by 20%, with no negative health effects under any circumstances. But if regression analysis showed that non-diabetic, non-obese, and non-hypertensive people had 25% less mortality, then a multivariable adjusted analysis would show that the magic pill increased mortality. Why? Because the elimination of diabetes, obesity, and hypertension should have decreased mortality by 25% (the regression analysis predicts), but mortality was only decreased 20%, so adjusted for diabetes, obesity, and hypertension the magic pill must be credited with the additional 5% dead. The multivariable adjusted HR for the magic pill becomes 0.8/0.75 = 1.067.

Of course, what ordinary people want to know is: Will this magic pill improve my health? The answer to that would be yes.

What (too many) scientists want to know is: Which methodology for analyzing this magic pill data will get me grant money? That depends on whether the funding authorities are positively or negatively disposed toward the magic pill industry. Once you know that, you search for the 16-variable multivariable regression that generates the hazard ratios the authorities would like to see.

My take? Judging by the data in Table 2 plus corroborating evidence from clinical trials reviewed in our book, I would say that a well-formulated supplement program, begun at age 62, may increase the odds of survival to age 82 by something on the order of 5% to 10%. Perhaps not a magic pill; but worthwhile.

[6] Not the weekly video: An exceptional magic show:

[7] Shou-Ching’s Photo Art:

[8] Weekly video: A new tool for stroke recovery: