Category Archives: Obesity - Page 2

Look AHEAD Scientists: Trying to Move the Deer Crossing

The Look AHEAD: Action for Health in Diabetes trial has been halted two years early. Here’s Gina Kolata in The New York Times:

The study randomly assigned 5,145 overweight or obese people with Type 2 diabetes to either a rigorous diet and exercise regimen or to sessions in which they got general health information. The diet involved 1,200 to 1,500 calories a day for those weighing less than 250 pounds and 1,500 to 1,800 calories a day for those weighing more. The exercise program was at least 175 minutes a week of moderate exercise.

But 11 years after the study began, researchers concluded it was futile to continue — the two groups had nearly identical rates of heart attacks, strokes and cardiovascular deaths.

It’s clearly a negative result for “eat less, move more” as a health strategy for obese diabetics.

Was “Eat Less Move More” Harmful?

A few Paleo bloggers are not surprised; indeed, Peter Dobromylskyj speculates that all-cause mortality – which Ms. Kolata and the NIH press release do not report – may have been higher in the “eat less, move more” intervention group:

It seems very likely to me that more people died in the intervention group than in the usual care group, but p was > 0.05.

Call me a cynic, but I think they stopped the trial because they could see where that p number was heading.

Peter may be a cynic but cynics are sometimes right, and I will bet that he’s right about this. In general, calorie restriction and exercise are better attested against cardiovascular disease than against other health conditions, so if death rates from CVD were identical in the two arms after 11 years, it’s quite likely death rates from other causes were higher in the intervention arm.

Our Theory

We discuss in our new Scribner edition two reasons why “eat less, move more” can backfire:

  • On a malnourishing diet, “eat less” means even greater malnourishment. Less of a bad diet is a worse diet.
  • Excessive exercise may over-stress the body and harm health. In diseased people, the volume at which exercise becomes excessive may not be that high.

On the other hand, ultimately some form of “eat less, move more” is needed if optimal health is to be attained:

  • An energy deficit – eating less than the body expends – is necessary to lose fat mass, and obesity is probably incompatible with optimal health.
  • About 20 to 30 minutes of exercise per day at the intensity of running or jogging is needed for optimal health, probably due to the role of daytime activity in entraining circadian rhythms (see “Physical Activity: Whence Its Healthfulness?”, October 11, 2012). Most people would need to “move more” to achieve this.

So the challenge in weight loss is two-fold: It’s necessary to adopt a healthy diet in which malnourishment doesn’t occur despite calorie restriction, and to find a healthy level of exercise that improves health without overstressing the body.

Look AHEAD: Bad Dietary Advice

The Look AHEAD Study Protocol tells us what the intervention group was told to do.

From page 29, here is the diet advice:

The recommended diet is based on guidelines of the ADA and National Cholesterol Education program [96,97] and includes a maximum of 30% of total calories from total fat, a maximum of 10% of total calories from saturated fat, and a minimum of 15% of total calories from protein.

This gives 55% carbs and probably 10% omega-6 fat. The omega-6 intake is far too high – for weight loss and good health, omega-6 intake should be less than 4% – and so is the carb intake – for diabetics, reducing carbs to 30% or less is highly desirable.

From page 30, here is the exercise advice:

The physical activity program of Look AHEAD relies heavily on unsupervised exercise, with gradual progression toward a goal of 175 minutes of moderate intensity physical activity per week by the end of the first six months. Exercise bouts of ten minutes and longer are counted toward this goal. Exercise is recommended to occur five days per week.

Moderate-intensity walking is encouraged as the primary type of physical activity.

I think this is reasonable advice. It translates to 35 minutes per day for 5 days. The intensity is quite low. This level of exercise is hardly likely to be excessive; indeed, it’s probably grossly insufficient for optimal health. It represents about a mile and a half of walking per day, five days per week. This may have been a homeopathic level of activity.

There is another reason the exercise may have produced no observable benefit. Since I believe the health benefits of exercise occur primarily through circadian rhythm entrainment, it’s likely that daytime exercise is much more beneficial than night-time exercise. Night-time exercise might be ineffective or even harmful to health if it disrupts circadian rhythms.

Unfortunately many people find it difficult to find time during the day for exercise. If the walking was performed at night, even the modest benefits of the activity may have been lost.

Weight and Health: What’s the Direction of Causation?

The one “success” of Look AHEAD was that it brought about some weight loss: the intervention group lost 5% of their original weight.

We know that obesity is associated with poor health. Since causation implies correlation, the existence of this correlation suggests that either (1) obesity causes poor health, (2) poor health causes obesity, or (3) some third factors cause both obesity and poor health.

The Look AHEAD study presumed (1) – that obesity causes poor health. The “eat less, move more” intervention was wholly directed at weight loss. If obesity is the cause of poor health, Look AHEAD should have improved health. It didn’t. This tells us that the direction of causality is either (2) or (3). Obesity doesn’t impair health; other factors that impair health cause obesity.

It’s easy to make faulty inferences about the direction of causation. The Look AHEAD scientists made the same mistake this woman did:

Conclusion

The basic flaw in the Look AHEAD study was that it was designed to bring about weight loss, and hoped that weight loss would improve health.

A better intervention would seek to improve health through a more PHD-like diet and through circadian rhythm therapies. Successful health improvement would, more than likely, lead to weight loss.

For the overweight and for diabetics, the focus should not be on weight, but on health. Improve health, and weight loss will follow. Focus on weight with a simple-minded “eat less, move more” intervention without tending to the quality of your diet and lifestyle, and you might be doing yourself more harm than good.

Are Low Doses of Niacin Dangerous?

In Food Fortification: A Risky Experiment?, Mar 23, 2012, we began looking at the possibility that fortification of food, especially the enriched flours used in commercial baked goods, with niacin, iron, and folic acid may have contributed to the obesity and diabetes epidemics.

As this plot shows, fortification caused intake of per capita niacin intake in the United States to rise from about 20 mg/day to about 32 mg/day:

Multivitamins typically contain about 20 mg niacin, so (a) a typical American taking a multivitamin is getting 52 mg/day niacin, and (b) if the increase of 12 mg/day due to fortification is dangerous, then taking a multivitamin would be problematic too.

There wasn’t evidence of niacin deficiency at 20 mg/day. The RDA was set at 16 mg/day for men and 14 mg/day, levels that equalize intake with urinary excretion of niacin metabolites [source: Dietary Reference Intakes]. Fortification of grains with niacin was designed to make refined white wheat have the same niacin content as whole wheat, not to rectify any demonstrated deficiency of niacin.

B-vitamins are normally considered to have low risk for toxicity, since they are water soluble and easily excreted. But recently, scientists from Dalian University in China proposed that niacin fortification may have contributed to the obesity and diabetes epidemics. [1] [2]

Niacin, Oxidative Stress, and Glucose Regulation

The Chinese researchers note that niacin affects both appetite and glucose metabolism:

[N]iacin is a potent stimulator of appetite and niacin deficiency may lead to appetite loss [10]. Moreover, large doses of niacin have long been known to impair glucose tolerance [23,24], induce insulin resistance and enhance insulin release [25,26].

They propose that niacin’s putative negative effects may be mediated by oxidative stress, perhaps compounded by poor niacin metabolism:

Our recent study found that oxidative stress may mediate excess nicotinamide-induced insulin resistance, and that type 2 diabetic subjects have a slow detoxification of nicotinamide. These observations suggested that type 2 diabetes may be the outcome of the association of high niacin intake and the relative low detoxification of niacin of the body [27].

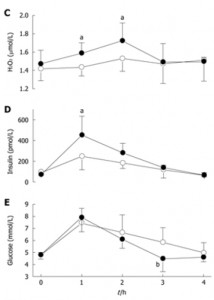
The effect of niacin on glucose metabolism is visible in this experiment. Subjects were given an oral glucose tolerance test of 75 g glucose with or without 300 mg nicotinamide. [1, figure source]

Dark circles are from the OGTT with niacinamide, open circles without. Plasma hydrogen peroxide levels, a marker of oxidative stress, and insulin levels were higher in the niacinamide group. Serum glucose was initially slightly higher in the niacinamide group, but by 3 hr had dropped significantly, to the point of hypoglycemia in two subjects:

Two of the five subjects in NM-OGTT had reactive hypoglycemia symptoms (i.e. sweating, dizziness, faintness, palpitation and intense hunger) with blood glucose levels below 3.6 mmol/L [64 mg/dl]. In contrast, no subjects had reactive hypoglycemic symptoms during C-OGTT. [1]

Of course 300 mg is a ten-fold higher niacinamide dose than most people obtain from food, but perhaps chronic intake of 32 mg/day (52 mg/day with a multivitamin) daily over a period of years have similar cumulative effects on glucose tolerance as a one-time dose of 300 mg.

Is There a Correlation with Obesity?

OK. Is there an observable relationship between niacin intake and obesity or diabetes?

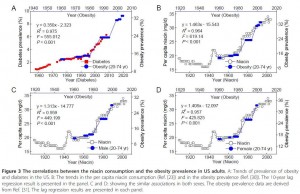
There may be, but only with a substantial lag. Here is a figure that illustrates the possible connection [2, figure source]:

Niacin intake maps onto obesity rates with a 10-year lag. After niacin intake rose, obesity rates rose 10 years later. Note the scaling: a 60% increase in niacin intake was associated with a doubling of obesity rates 10 years later.

Obesity leads diabetes by about 15 years, so we could also get a strong correlation between niacin intake and diabetes incidence 25 years later. The scaling in this case would be a 35% increase in niacin associated with a 140% increase in diabetes prevalence after a lag of 25 years.

How seriously should we take this? As evidence, it’s extremely weak. There was a one-time increase in niacin intake at the time of fortification. A long time later, there was an increase in obesity, and long after that, an increase in diabetes. So we really have only 3 events, and given the long lag times between them, the association between the events is highly likely to be attributable to chance.

It was to emphasize the potential for false correlations that I put the stork post up on April 1 (Theory of the Stork: New Evidence, April 1, 2012). Just because two data series can be made to line up, with appropriate scaling of the vertical axis and lagging of the horizontal axis, doesn’t mean there is causation involved.

Is There Counter-Evidence?

Yes.

If niacin from wheat fortification is sufficient to cause obesity or diabetes, with an average intake of 12 mg/day, then presumably the 20 mg of niacin in multivitamins would also cause obesity or diabetes.

So we should expect obesity and diabetes incidence to be higher in long-time users of multivitamins or B-complex vitamins.

But in fact, people who take multivitamins or B-complex vitamins have a lower subsequent incidence of obesity and diabetes.

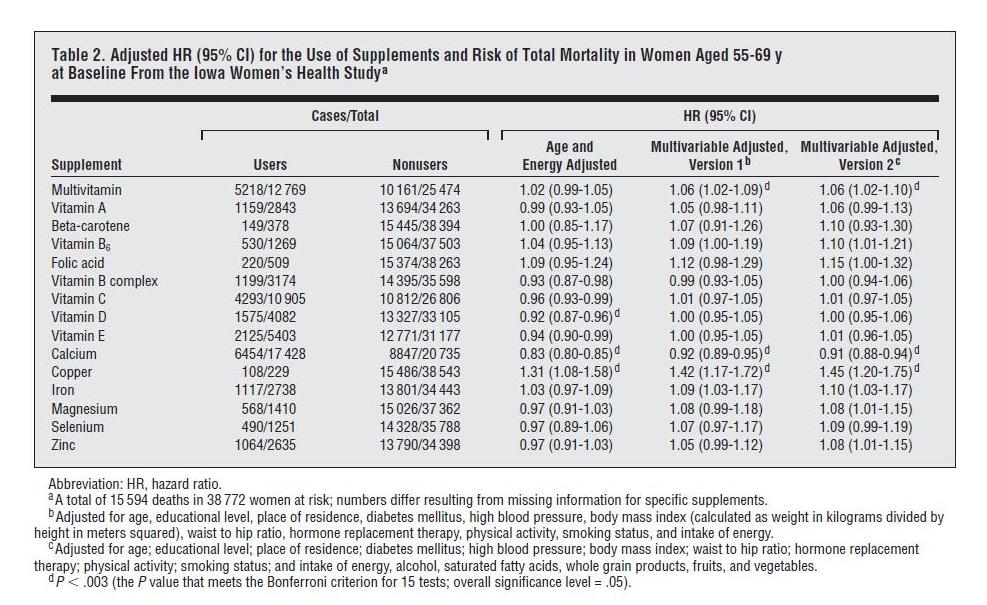
One place we can see this is in the Iowa Women’s Health Study, discussed in a previous post (Around the Web; The Case of the Killer Vitamins, Oct 15, 2011). In that post I looked at a study analysis which was highly biased against vitamin supplements; the authors chose to do 11-factor and 16-factor adjustments designed to make supplements look bad. The worst part of the analysis, from my point of view, was using obesity and diabetes as adjustment factors in the regression analysis. As you can see in the table below, multivariable adjustment including obesity and diabetes significantly raises the mortality associated with consumption of multivitamins or B-complex supplements:

This increase in hazard ratios (“HR”) with adjustment for obesity and diabetes almost certainly indicates that the supplements reduce the incidence of these diseases.

Multivitamins are protective in other studies too. The relation between multivitamin use and subsequent incidence of obesity was specifically analyzed in the Quebec Family Study, which found that “nonconsumption of multivitamin and dietary supplements … [was] significantly associated with overweight and obesity in the cross-sectional sample.” [3]

Does this exculpate niacin supplementation? I don’t think so. In general, improved nutrition should reduce appetite, since the point of eating is to obtain nutrients. So it’s no surprise that multivitamin use reduces obesity incidence. But multivitamins contain many nutrients, and it could be that benefits from the other nutrients are concealing long-term harms from the niacin.

Conclusion

At this point I think the evidence against niacin is too weak to convict in a court of law.

Nevertheless, we do have:

  • Clear evidence that high-dose (300 mg) niacinamide causes oxidative stress and impaired glucose tolerance. If niacinamide can raise levels of peroxide in the blood, what is it doing at mitochondria?
  • No clear evidence for benefits from niacin fortification or supplementation.

Personally I see no clear evidence that niacin supplementation, even at the doses in a multivitamin, is likely to be beneficial. Along with other and stronger considerations, this is pushing me away from multivitamin use and toward supplementation of specific individual micronutrients whose healthfulness is better attested.

I also think that food fortification was a risky experiment with the American people, and stands as yet another reason to avoid eating grains and grain products. (And to rinse white rice before cooking, to remove the enrichment mixture.)

References

[1] Li D et al. Chronic niacin overload may be involved in the increased prevalence of obesity in US children. World J Gastroenterol. 2010 May 21;16(19):2378-87. http://pmid.us/20480523.

[2] Zhou SS et al. B-vitamin consumption and the prevalence of diabetes and obesity among the US adults: population based ecological study. BMC Public Health. 2010 Dec 2;10:746. http://pmid.us/21126339.

[3] Chaput JP et al. Risk factors for adult overweight and obesity in the Quebec Family Study: have we been barking up the wrong tree? Obesity (Silver Spring). 2009 Oct;17(10):1964-70. http://pmid.us/19360005.

Red Meat and White Rice, Oh My!

This started as a note for an Around the Web, but has grown … so it will stand on its own.

The Red Meat Study

The Paleosphere has been abuzz about the red meat study from the Harvard School of Public Health. I don’t have much to say about it because the claimed effect is small and, at first glance, not enough data was presented to critique their analysis. There are plenty of confounding issues: (1) We know pork has problems that beef and lamb do not (see The Trouble With Pork, Part 3: Pathogens and earlier posts in that series), but all three meats were lumped together in a “red meat” category. (2) As Chris Masterjohn has pointed out, the data consisted of food frequency questionnaires given to health professionals, and most respondents understated their red meat consumption. Those who reported high meat consumption were “rebels” who smoked, drank, and did not exercise. (3) The analysis included multivariate adjustment for many factors, which can have large effects on assessed risk. Study authors can easily bias the results substantially in whatever direction they prefer. I’ve discussed that problem in The Case of the Killer Vitamins.

So it’s hard to judge the merits of the red meat study. However, another study from HSPH researchers came out at the same time that was outright misleading.

The White Rice and Diabetes Study

This study re-analyzed four studies from four countries – China, Japan, Australia, and the United States – to see how the incidence of diabetes diagnosis related to white rice consumption within each country.

Here was the main data:

The key thing to notice is that the y-axis of this plot is NOT incidence of type 2 diabetes. It is relative risk within each country for type 2 diabetes.

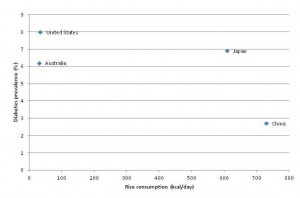
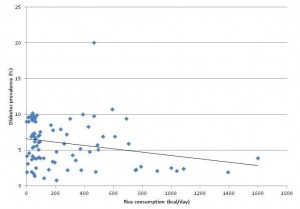
I looked up diabetes incidence and rice consumption in these four countries. Here is the scatter plot:

Here is the complete FAO database of 86 countries, with a linear fit to the data:

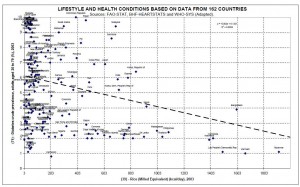
UPDATE: O Primitivo has data for 162 countries and a better chart. Here it is – click to enlarge:

If anything, diabetes incidence goes down as rice consumption increases. Countries with the highest white rice consumption, such as Thailand, the Philippines, Indonesia, and Bangladesh, have very low rates of diabetes. The outlier with 20% diabetes prevalence is the United Arab Emirates.

A plausible story is this:

  1. Something entirely unrelated to white rice causes metabolic syndrome. Possibly, the something which causes metabolic syndrome is dietary and is displaced from the diet by rice consumption, thus countries with higher rice consumption have lower incidence of metabolic syndrome.
  2. Diabetes is diagnosed as a fasting glucose that exceeds a fixed threshold of 126 mg/dl. In those with impaired glucose regulation from metabolic syndrome, higher carb intakes will tend to lead to higher levels of fasting blood glucose. (Note: this is true for carb intakes above about 40% of energy. On low-carb diets, higher carb intakes tend to lead to lower fasting blood glucose due to increased insulin sensitivity. However, nearly everyone in these countries eats more than 40% carb.) Thus, of two people with identical health, the one eating more carbs will show higher average blood glucose levels.
  3. Therefore, the fraction of those diagnosed as diabetic (as opposed to pre-diabetic) will increase as their carb consumption increases.
  4. In China and Japan, but not in the US and Australia, white rice consumption is a marker of carb consumption. So the fraction of those with metabolic syndrome diagnosed as diabetic will increase with white rice consumption in China and Japan, but will be uncorrelated with white rice consumption in the US and Australia.

Thus, diabetes incidence may be lower in China and Japan (due to lower incidence of metabolic syndrome on Asian diets), but higher among Chinese and Japanese eating the most rice (due to higher rates of diagnosis on the blood sugar criterion). This explains all of the data and is biologically sound.

What did the HSPH researchers conclude?

Higher consumption of white rice is associated with a significantly increased risk of type 2 diabetes, especially in Asian (Chinese and Japanese) populations.

No: Internationally, higher consumption of white rice is associated with a significantly reduced risk of type 2 diabetes, and the Chinese and Japanese experience is consistent with that. Carb consumption is associated with a higher rate of diabetes diagnosis within populations at otherwise similar risk for diabetes. White rice consumption is correlated to carb consumption especially strongly in Asian (Chinese and Japanese) populations.

Food Reward and “Eat Less, Move More” in Diabetes

Of course, the study authors knew that diabetes incidence is lower in countries that eat more white rice. How do they reconcile this with their claim that white rice increases diabetes risk?

The recent transition in nutrition characterised by dramatically decreased physical activity levels and much improved security and variety of food has led to increased prevalence of obesity and insulin resistance in Asian countries. Although rice has been a staple food in Asian populations for thousands of years, this transition may render Asian populations more susceptible to the adverse effects of high intakes of white rice …

In other words, rice-eating countries have higher physical activity and more boring food – just look at the notoriously tasteless cuisines of Thailand, China, and Japan – and their inability to eat high quantities of food has hitherto protected Thais, Chinese, Japanese, Filipinos, and Indonesians from diabetes.

However, once those rice eaters become office workers and learn how to spice their rice with more varied flavors, the deadly nature of rice may be revealed.

Stephan Guyenet writes that “Food Reward [is] Approaching a Scientific Consensus.” It certainly seems so; it is emerging as a catch-all explanation for everything, a perspective that can be trotted out in a few concluding sentences to reconcile a hypothesis (white rice causes diabetes) with data that contradict it.

Conclusion

To me, the HSPH white rice study doesn’t look like science. It looks like gaming of the grant process – generating surprising and disturbing results that seem to warrant further study, even if the researchers themselves know the results are most likely false.

Consensus or no – and consensus in science isn’t necessarily a sign of truth (hat tip: FrankG) – the food reward perspective seems to me an incomplete explanation for what is going on. It puts a lot of weight on a transition from highly palatable (Thai, Japanese, Chinese) food to “hyperpalatable” (American, junk) food as an explanation for obesity and diabetes. It seems to me that the lack of nutrients and abundance of toxins in the junk food may be just as important as its “hyperpalatability.” It’s the inability of the junk food to satisfy that is the problem, not its palatability.

I’m glad that the food reward perspective may start being tested against Asian experiences. That may shed a lot of light on these issues.

My Theory of Obesity, I: “The Fat Trap”

In the January 1 edition of The New York Times Magazine, Tara Parker-Pope’s “The Fat Trap” looks at one of the most interesting aspects of obesity: how difficult it is to keep lost weight from coming back.

I skimmed it when it first came out, but after an email arrived this morning inviting me to sign a petition authored by Gary Taubes, I decided to read it carefully.

Ms. Parker-Pope’s article is excellent. Since it presents valuable evidence on some issues I have been planning to write about, I thought I’d use it to begin expounding my theory of obesity.

The Yo-Yo Dieting Pattern

A common experience on weight loss diets is successful weight loss – but often not to normal weight – followed by unremitting hunger that requires heroic willpower to resist, and ultimate capitulation leading to weight regain. This pattern may repeat itself in yo-yo fashion.

Parker-Pope describes a recent study from The New England Journal of Medicine:

After a year, the patients already had regained an average of 11 of the pounds they struggled so hard to lose. They also reported feeling far more hungry and preoccupied with food than before they lost the weight.

While researchers have known for decades that the body undergoes various metabolic and hormonal changes while it’s losing weight, the Australian team detected something new. A full year after significant weight loss, these men and women remained in what could be described as a biologically altered state. Their still-plump bodies were acting as if they were starving and were working overtime to regain the pounds they lost…. It was almost as if weight loss had put their bodies into a unique metabolic state, a sort of post-dieting syndrome that set them apart from people who hadn’t tried to lose weight in the first place.

The study measured hormonal levels a year after the weight loss:

One year after the initial weight loss, there were still significant differences from baseline in the mean levels of leptin (P<0.001), peptide YY (P<0.001), cholecystokinin (P=0.04), insulin (P=0.01), ghrelin (P<0.001), gastric inhibitory polypeptide (P<0.001), and pancreatic polypeptide (P=0.002), as well as hunger (P<0.001).

Note that insulin levels were still lowered, even as the participants were re-gaining weight:

Decreases in insulin levels after weight loss were evident, and the interaction between postprandial period and study week was significant (P<0.001), with significant reductions in meal-stimulated insulin release 30 and 60 minutes after eating, both from baseline to week 10 (P<0.001 for the two postprandial comparisons) and from baseline to week 62 (P<0.001 for the comparison at 30 minutes; P = 0.01 for the comparison at 60 minutes).

Gary Taubes, in his petition, complains that Ms. Parker-Pope “forgot to mention that the hormone insulin is primarily responsible for storing fat in her fat tissue”; perhaps this omission was just as well.

Resistance to Weight Gain

There is variability in the response to overfeeding. Commenting on a seminal series of experiments published in the 1990s by Canadian researchers Claude Bouchard and Angelo Tremblay, Parker-Pope writes:

That experimental binge should have translated into a weight gain of roughly 24 pounds (based on 3,500 calories to a pound). But some gained less than 10 pounds, while others gained as much as 29 pounds.

Note that eating a pound’s worth of calories typically led to something like a half-pound of weight gain; this shows that weight increases lead to energy expenditure increases. This was in a study in which the subjects were prevented from exercising. Likely the weight gain would have been generally lower if the subjects had been free to move as they wished.

Genes Influence But Don’t Decide

Genes – at least the known ones – are not determinate for obesity:

Recently the British television show “Embarrassing Fat Bodies” asked Frayling’s lab to test for fat-promoting genes, and the results showed one very overweight family had a lower-than-average risk for obesity.

Successful Weight Loss Is Possible

Some people do lose weight successfully:

The National Weight Control Registry tracks 10,000 people who have lost weight and have kept it off. “We set it up in response to comments that nobody ever succeeds at weight loss,” says Rena Wing, a professor of psychiatry and human behavior at Brown University’s Alpert Medical School, who helped create the registry with James O. Hill, director of the Center for Human Nutrition at the University of Colorado at Denver. “We had two goals: to prove there were people who did, and to try to learn from them about what they do to achieve this long-term weight loss.” Anyone who has lost 30 pounds and kept it off for at least a year is eligible to join the study, though the average member has lost 70 pounds and remained at that weight for six years.

Kudos to Drs. Wing and Hill: This is precisely the kind of data-gathering effort that is needed to help us understand weight loss.

The results, at least as reported by the Times piece, aren’t what most dieters want to hear. The people who kept weight off were those who basically continued some form of calorie restriction indefinitely:

There is no consistent pattern to how people in the registry lost weight — some did it on Weight Watchers, others with Jenny Craig, some by cutting carbs on the Atkins diet and a very small number lost weight through surgery. But their eating and exercise habits appear to reflect what researchers find in the lab: to lose weight and keep it off, a person must eat fewer calories and exercise far more than a person who maintains the same weight naturally.

If this is true, then few people have figured out how to cure their obesity. Rather, they’ve just found ways to keep weight off while remaining “metabolically damaged.” They can’t live like normal people and maintain a normal weight.

Paleo Helps

The piece then goes on to discuss the case of Janice and Adam Bridge. Mrs. Bridge peaked at 330 pounds in 2004, now weighs 195; Mr. Bridge peaked at 310 pounds and now weighs 200.

Mrs. Bridge stays at 195 pounds with a reduced-carb Paleo-style diet:

Based on metabolism data she collected from the weight-loss clinic and her own calculations, she has discovered that to keep her current weight of 195 pounds, she can eat 2,000 calories a day as long as she burns 500 calories in exercise. She avoids junk food, bread and pasta and many dairy products and tries to make sure nearly a third of her calories come from protein.

No junk food (presumably sugar), bread, pasta, or dairy is pretty Paleo. Compared to the standard American diet, it’s low in carbs and high in protein.

Persistent Alterations in the Formerly Obese

The article points to other sources of evidence for metabolic differences between the obese and the never-obese.

[O]ne woman who entered the Columbia studies [of Drs Rudolph Leibel and Michael Rosenbaum] at 230 pounds was eating about 3,000 calories to maintain that weight. Once she dropped to 190 pounds, losing 17 percent of her body weight, metabolic studies determined that she needed about 2,300 daily calories to maintain the new lower weight. That may sound like plenty, but the typical 30-year-old 190-pound woman can consume about 2,600 calories to maintain her weight — 300 more calories than the woman who dieted to get there.

Presumably 190 pounds is still obese for the “typical” 30-year-old woman. So the reduced-weight obese woman is burning fewer calories than a same-size obese woman who never reduced her weight.

So obesity followed by a malnourishing weight loss diet often creates persistent changes that hinder further weight loss, or even maintenance of the lower weight. One observation:

Muscle biopsies taken before, during and after weight loss show that once a person drops weight, their muscle fibers undergo a transformation, making them more like highly efficient “slow twitch” muscle fibers. A result is that after losing weight, your muscles burn 20 to 25 percent fewer calories during everyday activity and moderate aerobic exercise than those of a person who is naturally at the same weight.

Another observation in these patients is persistent hunger. Self-reported hunger is confirmed by observable changes in the brain:

After weight loss, when the dieter looked at food, the scans showed a bigger response in the parts of the brain associated with reward and a lower response in the areas associated with control.

In the Columbia patients, the effect is highly persistent:

How long this state lasts isn’t known, but preliminary research at Columbia suggests that for as many as six years after weight loss, the body continues to defend the old, higher weight by burning off far fewer calories than would be expected. The problem could persist indefinitely.

What Caused the Metabolic Alterations?

Are these persistent alterations to the body caused by the original obesity, or by the malnourishing diet that produced the weight loss? Dr. Leibel believes that the cause was the obesity, but that it is slow-acting – requiring an extended period of fatness:

What’s not clear from the research is whether there is a window during which we can gain weight and then lose it without creating biological backlash…. [R]esearchers don’t know how long it takes for the body to reset itself permanently to a higher weight. The good news is that it doesn’t seem to happen overnight.

“For a mouse, I know the time period is somewhere around eight months,” Leibel says. “Before that time, a fat mouse can come back to being a skinny mouse again without too much adjustment. For a human we don’t know, but I’m pretty sure it’s not measured in months, but in years.”

However, other researchers are exploring the possibility that it was the malnourishing weight loss diet that was at fault:

One question many researchers think about is whether losing weight more slowly would make it more sustainable than the fast weight loss often used in scientific studies. Leibel says the pace of weight loss is unlikely to make a difference, because the body’s warning system is based solely on how much fat a person loses, not how quickly he or she loses it. Even so, Proietto is now conducting a study using a slower weight-loss method and following dieters for three years instead of one.

My Theory of Obesity: Lean Tissue Feedback

I’m going to be spelling out my theory of obesity over coming months, but let me introduce here a few hypotheses which can account for the data reported in Ms. Parker-Pope’s article.

I believe the brain defends not only (or primarily) an amount of fat mass, but also the health of the body, as reflected by the quantity and quality of lean tissue.

So it is plausible to speak in terms of set points, but there are two set points: a “fat mass set point”, and a “lean tissue quality set point.” The second is dominant: Lean tissue is essential to life, while gains in fat mass may diminish fitness in some environments but will increase fitness in others and are rarely catastrophic. So the tissue-quality set point usually dominates the fat mass set point in its influence upon the brain and behavior.

Feedback to the brain about the quantity of fat mass comes to the brain through a hormone, leptin, that researchers can easily monitor; but feedback about the state of lean tissue comes through the nerves, which sense the state of tissues throughout the body. Lean tissue is too important for health, and can be degraded in so many different ways, that signals about its state cannot be entrusted to a fragile, low-bandwidth mechanism like a hormone. Lean tissue signaling uses the high-bandwidth communications of the nervous system. This feedback system is hard for researchers to monitor.

So the “fat mass set point” is visible to researchers, but the “lean tissue quality set point” is invisible. This is why researchers focus on the fat mass set point, while actual dieters, who know their own experiences are not explained by a simple fat mass set point theory, resist the idea.

Malnutrition will decrease tissue quality, triggering the brain to increase appetite (to get more nutrients) and diminish resource utilization (to conserve nutrients).

If the diet is deficient in the nutrients needed to build tissue, but rich in calories, then tissue-driven increases in appetite and reductions in nutrient utilization may (not necessarily, because the body has many resources for optimizing lean tissue and fat mass independently) lead to an increase in fat mass. Eventually a rise in leptin counterbalances the tissue-driven signals, but this occurs at a new equilibrium featuring higher fat mass, higher appetite, and reduced nutrient utilization compared to the pre-obese state.

Leptin signaling is responsible for the resistance to fat mass increases. The degree to which this resistance affects outcomes depends on the quality of lean tissue. The higher the quality of lean tissue, the less the brain needs to protect it and the more sensitive it is to leptin. The lower the quality of lean tissue, the more lean-tissue drives dominate and the more the brain ignores leptin signals (is “leptin resistant”).

Malnourishing “starvation” weight loss diets degrade lean tissue, and therefore they make the brain hungrier then it was before the weight loss, more eager to conserve resources that might be useful to lean tissue, and more leptin resistant.

However, weight loss diets that restrict calories, but improve the nourishment of lean tissue, should have the opposite effect. They should make the brain less hungry, less focused on conserving resources, and more leptin sensitive.

How much has to be eaten to provide adequate nourishment to lean tissue? In Perfect Health Diet: Weight Loss Version (Feb 1, 2011), I explored this question. Just to provide the necessary macronutrients to maintain lean tissue, I believe it’s necessary to consume at least 1200 calories per day. To optimize micronutrients as well, it’s probably necessary to supplement, even on a 1200 calorie diet. This is on a perfectly-designed diet. The less nourishing the diet, the more calories will be needed to eliminate tissue-driven hunger.

The Experiences of Perfect Health Dieters

A few Perfect Health Dieters have been using our diet for weight loss for a long enough period of time – 9-12 months – to test this hypothesis.

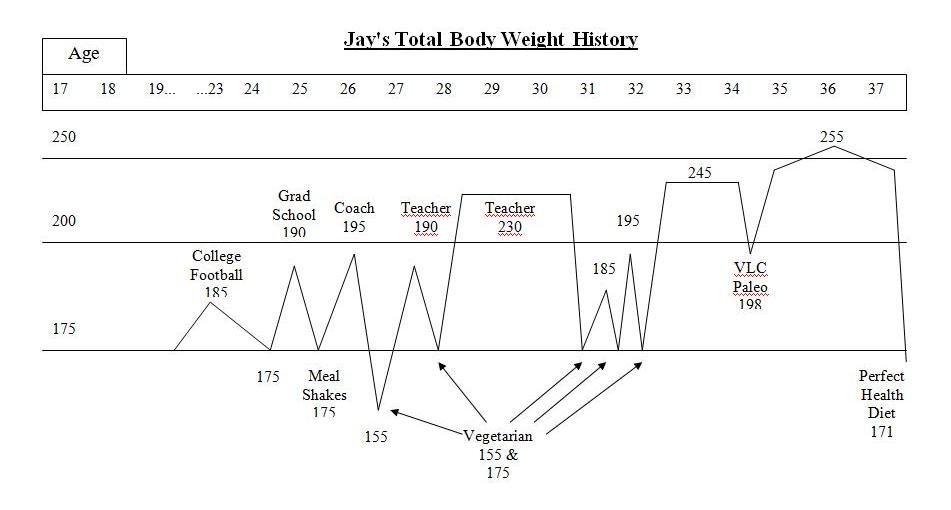
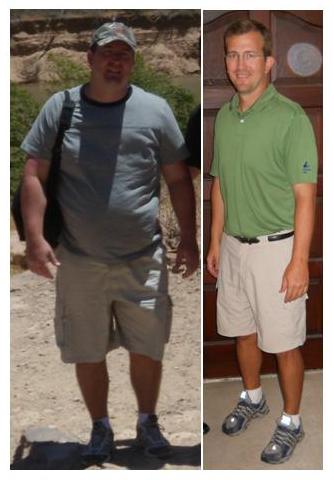
Jay Wright’s Weight Loss Journey (Dec 1, 2011) is a carefully chronicled account. Jay became overweight in college, obese by age 28, and had been obese for 10 years by the time he started our diet. He described his weight loss history:

I was a yo-yo dieter – I could lose weight but it always ended up even higher. I tried meal shake replacements, frozen dinners to limit calories, no meat/meat, no dairy/dairy, acid/alkaline, exercise/no exercise while dieting, no cash or credit cards in my wallet going to work so I wouldn’t stop at a fast food, punishment where I had to eat a raw tomato if I cheat (I hate raw tomatoes), and many other vegetarian leaning and mental tricks.  A pattern emerged with these diets.  I would starve with low energy for about a week or two until my will power ran out. Then, I would go eat something “bad.”  If I continued to repeat the pattern and managed to be “successful,” I stayed hungry even once I reached my goal weight.  I tried to transition to a “regular” amount of food to stop starving and just maintain but to no avail.  My weight went right back up even higher than before even without cheating on the diets.

This yo-yo pattern of hunger followed by weight regain exactly fits the experiences described in Tara Parker-Pope’s article.

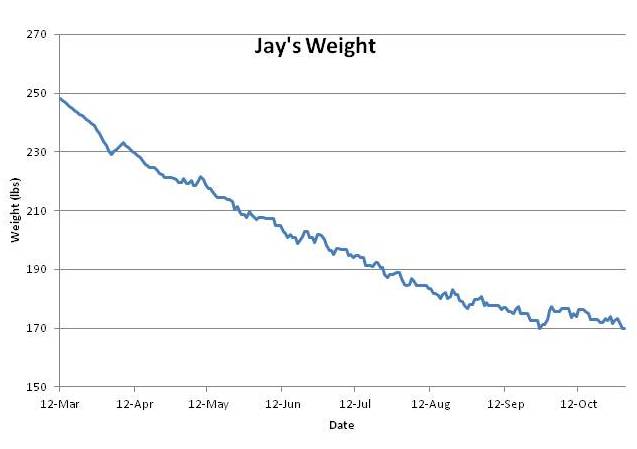
However, Jay’s experience on PHD breaks the pattern. Jay went from 250 pounds to 170 pounds – his normal weight – in six months. Weight loss was steady and he experienced little hunger. He’s maintained his normal weight without regain for 3 months.

This is just as my theory predicts. PHD is a lean-tissue supporting diet, and if his lean tissue is well nourished, he should feel little hunger. If his lean tissue heals fast enough, then his lean-tissue drive will decrease faster than his leptin signaling, his equilibrium weight determined by the balance of these two drives will always be below his actual weight, and he should experience smooth weight loss. Which he did:

Jay’s experience is counter-evidence to many of the ideas put forth by the academic researchers in Ms. Parker-Pope’s article. For instance, Dr. Leibel’s theory that months of obesity create a persistent rise in set point is refuted; Jay had been obese for 10 years but his set point was quickly reset.

Here are Jay’s before and after photos:

Conclusion

I’ll be spelling out my theory of obesity in much more detail later; this is only a first installment.

But I’ll say this: I’ve been gratified by the experiences of people who have tried our diet for weight loss. Our Results page has many reports of reduced hunger, reduced food cravings, and weight loss.

Even those who have not lost weight have reported greatly reduced hunger. I think that means their lean tissue is becoming better nourished, causing the brain to feel less urgency about acquiring more nutrients.

I think this reduction in hunger is the proper first step to healthy weight loss. And I hope that in time we can gather enough case studies to prove that a nourishing diet like the Perfect Health Diet is the best approach to weight loss — and to a genuine cure for obesity.