Category Archives: Disease - Page 7

Do the Elderly Need Paleo More than the Young?

I also do work in economics and one of my favorite economics blogs is Evolving Economics by Jason Collins. He has an interest in biology and Paleo diets and recently linked to an interesting train of thought from evolutionary biologist Michael Rose.

Here is a summary from Peter Turchin, who adopted a Paleo diet this spring after talking to Rose:

We think of people having ‘traits,’ but actually we change quite dramatically as we age. … As an extreme example, consider reproductive ability, something of great interest to evolution. Humans do not reproduce until they reach a fairly advanced age of maturation (puberty). Young adults are not very good mothers or fathers, but they improve with age during their twenties. After that reproductive ability declines and eventually disappears. …

Ability to digest certain foods can also be age-dependent. I have already mentioned the ability to digest lactose, the sugar present in milk. Before we domesticated animals such as cows and sheep, only very young humans had this ability. Natural selection turned this ability off in adults because they never needed it (and it would be wasteful to continue producing the enzyme lactase that aids in the digestion of milk sugar). …

Because abilities to do something at the age of 10, 30, 50, etc. are separate (even if correlated) traits, they evolve relatively independently of each other. When grains became a large part of the diet, the ability of children to digest them (and detoxify the chemical compounds plants put into seeds to protect them against predators such as us) became critical. If you don’t have genes to help you deal with this new diet, you don’t survive to adulthood and don’t leave descendants. In other words, evolution worked very hard to adapt the young to the new diet. On the other hand, the intensity of selection on the old (e.g., 55 years old) was much less – in large part, because most people did not live to the age of 55 until very recently. …

The striking conclusion from this argument is that older people, even those coming from populations that have practiced agriculture for millennia, may suffer adverse health effects from the agricultural diet, despite having no problems when they were younger.

This is an intriguing argument. Several aspects of it are well supported: there has been recent evolution to enable people to cope with toxic diets, and there are substantial changes in how we respond to food as we age.

Recent Genetic Evolution

We know that there has been recent evolution for greater tolerance to evolutionarily novel foods such as wheat. This is (presumably) why peoples with a long history of grain agriculture are less obese and diabetic on “western” diets than people with a long history of eating healthy foods.

The Pacific islanders are a great example. The world’s highest obesity rates are in the Pacific – for instance, in the Kosrae district of Micronesia, 88% of adults are overweight and 59% obese – yet they were notably slim sixty years ago when still eating their traditional diets. [1]

In our book, we note that the traditional diets of Pacific Islanders are almost toxin-free. A logical inference is that because they have for millennia eaten the world’s least toxic diets, Pacific Islanders never needed to evolve (or lost) an ability to cope with toxin-rich diets, and now suffer much more harm from toxic foods than do peoples whose ancestors have eaten toxic diets.

Age-Based Differences in the Biological Response to Unhealthy Food

It’s also the case that we respond to food differently as we age.

It’s not only digestion, such as the age-related decline in lactase enzyme expression, that changes. There are metabolic changes.

The elderly consume far fewer calories than the young; presumably evolution selected for minimal food utilization so that they would not be a burden to those who had to hunt and gather on their behalf. Their contribution was likely cultural, which didn’t require extensive physical activity.

Another change is that the elderly become less likely than the young to store calories in adipose tissue. This has significant consequences.

We know from a broad range of evidence that adipose tissue protects other tissues from damage by lipotoxicity; and that when adipose tissue refuses to store fat, obesogenic diets lead to metabolic syndrome and diabetes. [2] So reduced storage of calories in adipose tissue in the elderly will lead to (a) reduced rates of obesity (as measured by adipose tissue accumulation), but (b) higher rates of metabolic syndrome and diabetes.

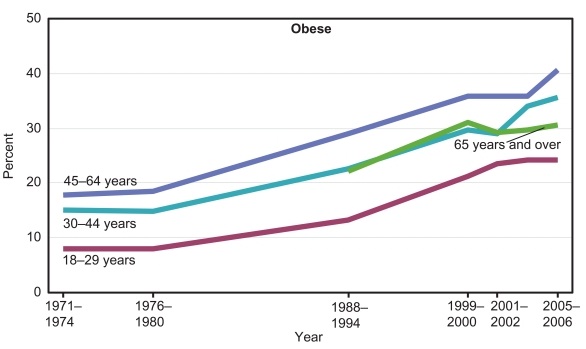
This is exactly what we see. Here are obesity rates by age group [3]:

Obesity rates for people over age 65 are lower than for people aged 30-64.

Here are diabetes rates by age group [4]:

Despite their lower obesity rates, the elderly have higher diabetes incidence.

This difference alone is sufficient to answer the question in our title: Yes, the elderly do need a Paleo (ie healthy) diet more than the young. Diabetes is much more dangerous than adipose tissue accumulation, so the elderly will suffer greater health impairment from an obesogenic (and diabetes-genic) diet than the young.

Is There Data Specifically Testing Rose’s Idea?

Rose’s idea that an evolved tolerance for toxin-rich diets will be specific to reproductively-aged persons with agriculturalist ancestors, is, so far as I know, not easily tested by available empirical evidence.

Studies in western populations alone will not be able to test Rose’s idea, because greater intolerance of toxic diets with higher age could simply be a result of an aging process that is universal in all populations. In order to find a process that recently evolved in agriculturalists, we would have to look at rates of aging or morbidity in different populations, both western and aboriginal, and see how aging rates or disease incidence depend on dietary toxicity:

  • Are Pacific Islanders more likely than westerners on similar diets to develop diabetes at reproductive ages, but equally likely at late ages? Are they more likely to become obese at younger ages than old?
  • Is aging more rapid in traditional peoples than in westerners during reproductive years, but similarly fast during elderly years, if they eat similar diets?

I am not aware of any such studies. Let me know if you are!

References

[1] Cassels S. Overweight in the Pacific: links between foreign dependence, global food trade, and obesity in the Federated States of Micronesia. Global Health. 2006 Jul 11;2:10. http://pmid.us/16834782.

[2] Unger RH, Scherer PE. Gluttony, sloth and the metabolic syndrome: a roadmap to lipotoxicity. Trends Endocrinol Metab. 2010 Jun;21(6):345-52. http://pmid.us/20223680. Sun K et al. Adipose tissue remodeling and obesity. J Clin Invest. 2011 Jun;121(6):2094-101. http://pmid.us/21633177.

[3] Health, United States, 2008: With Special Feature on the Health of Young Adults. National Center for Health Statistics (US). http://www.ncbi.nlm.nih.gov/books/NBK19623/.

[4] 2011 National Diabetes Fact Sheet, http://www.cdc.gov/diabetes/pubs/estimates11.htm.

Are Low Doses of Niacin Dangerous?

In Food Fortification: A Risky Experiment?, Mar 23, 2012, we began looking at the possibility that fortification of food, especially the enriched flours used in commercial baked goods, with niacin, iron, and folic acid may have contributed to the obesity and diabetes epidemics.

As this plot shows, fortification caused intake of per capita niacin intake in the United States to rise from about 20 mg/day to about 32 mg/day:

Multivitamins typically contain about 20 mg niacin, so (a) a typical American taking a multivitamin is getting 52 mg/day niacin, and (b) if the increase of 12 mg/day due to fortification is dangerous, then taking a multivitamin would be problematic too.

There wasn’t evidence of niacin deficiency at 20 mg/day. The RDA was set at 16 mg/day for men and 14 mg/day, levels that equalize intake with urinary excretion of niacin metabolites [source: Dietary Reference Intakes]. Fortification of grains with niacin was designed to make refined white wheat have the same niacin content as whole wheat, not to rectify any demonstrated deficiency of niacin.

B-vitamins are normally considered to have low risk for toxicity, since they are water soluble and easily excreted. But recently, scientists from Dalian University in China proposed that niacin fortification may have contributed to the obesity and diabetes epidemics. [1] [2]

Niacin, Oxidative Stress, and Glucose Regulation

The Chinese researchers note that niacin affects both appetite and glucose metabolism:

[N]iacin is a potent stimulator of appetite and niacin deficiency may lead to appetite loss [10]. Moreover, large doses of niacin have long been known to impair glucose tolerance [23,24], induce insulin resistance and enhance insulin release [25,26].

They propose that niacin’s putative negative effects may be mediated by oxidative stress, perhaps compounded by poor niacin metabolism:

Our recent study found that oxidative stress may mediate excess nicotinamide-induced insulin resistance, and that type 2 diabetic subjects have a slow detoxification of nicotinamide. These observations suggested that type 2 diabetes may be the outcome of the association of high niacin intake and the relative low detoxification of niacin of the body [27].

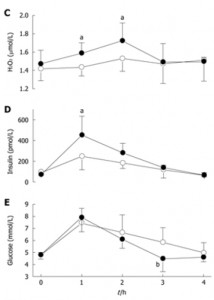
The effect of niacin on glucose metabolism is visible in this experiment. Subjects were given an oral glucose tolerance test of 75 g glucose with or without 300 mg nicotinamide. [1, figure source]

Dark circles are from the OGTT with niacinamide, open circles without. Plasma hydrogen peroxide levels, a marker of oxidative stress, and insulin levels were higher in the niacinamide group. Serum glucose was initially slightly higher in the niacinamide group, but by 3 hr had dropped significantly, to the point of hypoglycemia in two subjects:

Two of the five subjects in NM-OGTT had reactive hypoglycemia symptoms (i.e. sweating, dizziness, faintness, palpitation and intense hunger) with blood glucose levels below 3.6 mmol/L [64 mg/dl]. In contrast, no subjects had reactive hypoglycemic symptoms during C-OGTT. [1]

Of course 300 mg is a ten-fold higher niacinamide dose than most people obtain from food, but perhaps chronic intake of 32 mg/day (52 mg/day with a multivitamin) daily over a period of years have similar cumulative effects on glucose tolerance as a one-time dose of 300 mg.

Is There a Correlation with Obesity?

OK. Is there an observable relationship between niacin intake and obesity or diabetes?

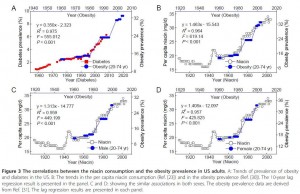
There may be, but only with a substantial lag. Here is a figure that illustrates the possible connection [2, figure source]:

Niacin intake maps onto obesity rates with a 10-year lag. After niacin intake rose, obesity rates rose 10 years later. Note the scaling: a 60% increase in niacin intake was associated with a doubling of obesity rates 10 years later.

Obesity leads diabetes by about 15 years, so we could also get a strong correlation between niacin intake and diabetes incidence 25 years later. The scaling in this case would be a 35% increase in niacin associated with a 140% increase in diabetes prevalence after a lag of 25 years.

How seriously should we take this? As evidence, it’s extremely weak. There was a one-time increase in niacin intake at the time of fortification. A long time later, there was an increase in obesity, and long after that, an increase in diabetes. So we really have only 3 events, and given the long lag times between them, the association between the events is highly likely to be attributable to chance.

It was to emphasize the potential for false correlations that I put the stork post up on April 1 (Theory of the Stork: New Evidence, April 1, 2012). Just because two data series can be made to line up, with appropriate scaling of the vertical axis and lagging of the horizontal axis, doesn’t mean there is causation involved.

Is There Counter-Evidence?

Yes.

If niacin from wheat fortification is sufficient to cause obesity or diabetes, with an average intake of 12 mg/day, then presumably the 20 mg of niacin in multivitamins would also cause obesity or diabetes.

So we should expect obesity and diabetes incidence to be higher in long-time users of multivitamins or B-complex vitamins.

But in fact, people who take multivitamins or B-complex vitamins have a lower subsequent incidence of obesity and diabetes.

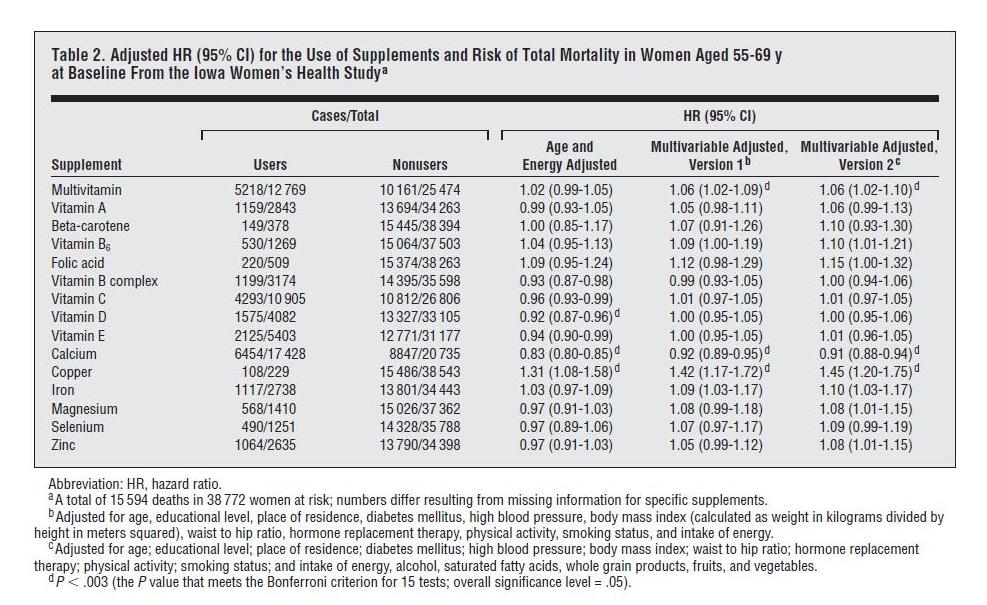
One place we can see this is in the Iowa Women’s Health Study, discussed in a previous post (Around the Web; The Case of the Killer Vitamins, Oct 15, 2011). In that post I looked at a study analysis which was highly biased against vitamin supplements; the authors chose to do 11-factor and 16-factor adjustments designed to make supplements look bad. The worst part of the analysis, from my point of view, was using obesity and diabetes as adjustment factors in the regression analysis. As you can see in the table below, multivariable adjustment including obesity and diabetes significantly raises the mortality associated with consumption of multivitamins or B-complex supplements:

This increase in hazard ratios (“HR”) with adjustment for obesity and diabetes almost certainly indicates that the supplements reduce the incidence of these diseases.

Multivitamins are protective in other studies too. The relation between multivitamin use and subsequent incidence of obesity was specifically analyzed in the Quebec Family Study, which found that “nonconsumption of multivitamin and dietary supplements … [was] significantly associated with overweight and obesity in the cross-sectional sample.” [3]

Does this exculpate niacin supplementation? I don’t think so. In general, improved nutrition should reduce appetite, since the point of eating is to obtain nutrients. So it’s no surprise that multivitamin use reduces obesity incidence. But multivitamins contain many nutrients, and it could be that benefits from the other nutrients are concealing long-term harms from the niacin.

Conclusion

At this point I think the evidence against niacin is too weak to convict in a court of law.

Nevertheless, we do have:

  • Clear evidence that high-dose (300 mg) niacinamide causes oxidative stress and impaired glucose tolerance. If niacinamide can raise levels of peroxide in the blood, what is it doing at mitochondria?
  • No clear evidence for benefits from niacin fortification or supplementation.

Personally I see no clear evidence that niacin supplementation, even at the doses in a multivitamin, is likely to be beneficial. Along with other and stronger considerations, this is pushing me away from multivitamin use and toward supplementation of specific individual micronutrients whose healthfulness is better attested.

I also think that food fortification was a risky experiment with the American people, and stands as yet another reason to avoid eating grains and grain products. (And to rinse white rice before cooking, to remove the enrichment mixture.)

References

[1] Li D et al. Chronic niacin overload may be involved in the increased prevalence of obesity in US children. World J Gastroenterol. 2010 May 21;16(19):2378-87. http://pmid.us/20480523.

[2] Zhou SS et al. B-vitamin consumption and the prevalence of diabetes and obesity among the US adults: population based ecological study. BMC Public Health. 2010 Dec 2;10:746. http://pmid.us/21126339.

[3] Chaput JP et al. Risk factors for adult overweight and obesity in the Quebec Family Study: have we been barking up the wrong tree? Obesity (Silver Spring). 2009 Oct;17(10):1964-70. http://pmid.us/19360005.

Red Meat and White Rice, Oh My!

This started as a note for an Around the Web, but has grown … so it will stand on its own.

The Red Meat Study

The Paleosphere has been abuzz about the red meat study from the Harvard School of Public Health. I don’t have much to say about it because the claimed effect is small and, at first glance, not enough data was presented to critique their analysis. There are plenty of confounding issues: (1) We know pork has problems that beef and lamb do not (see The Trouble With Pork, Part 3: Pathogens and earlier posts in that series), but all three meats were lumped together in a “red meat” category. (2) As Chris Masterjohn has pointed out, the data consisted of food frequency questionnaires given to health professionals, and most respondents understated their red meat consumption. Those who reported high meat consumption were “rebels” who smoked, drank, and did not exercise. (3) The analysis included multivariate adjustment for many factors, which can have large effects on assessed risk. Study authors can easily bias the results substantially in whatever direction they prefer. I’ve discussed that problem in The Case of the Killer Vitamins.

So it’s hard to judge the merits of the red meat study. However, another study from HSPH researchers came out at the same time that was outright misleading.

The White Rice and Diabetes Study

This study re-analyzed four studies from four countries – China, Japan, Australia, and the United States – to see how the incidence of diabetes diagnosis related to white rice consumption within each country.

Here was the main data:

The key thing to notice is that the y-axis of this plot is NOT incidence of type 2 diabetes. It is relative risk within each country for type 2 diabetes.

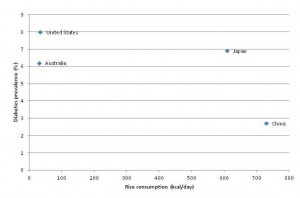
I looked up diabetes incidence and rice consumption in these four countries. Here is the scatter plot:

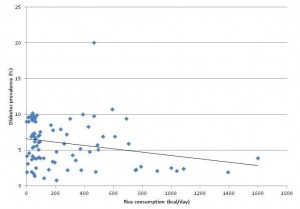
Here is the complete FAO database of 86 countries, with a linear fit to the data:

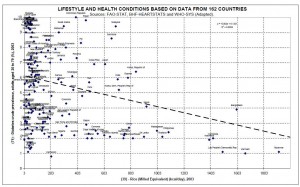
UPDATE: O Primitivo has data for 162 countries and a better chart. Here it is – click to enlarge:

If anything, diabetes incidence goes down as rice consumption increases. Countries with the highest white rice consumption, such as Thailand, the Philippines, Indonesia, and Bangladesh, have very low rates of diabetes. The outlier with 20% diabetes prevalence is the United Arab Emirates.

A plausible story is this:

  1. Something entirely unrelated to white rice causes metabolic syndrome. Possibly, the something which causes metabolic syndrome is dietary and is displaced from the diet by rice consumption, thus countries with higher rice consumption have lower incidence of metabolic syndrome.
  2. Diabetes is diagnosed as a fasting glucose that exceeds a fixed threshold of 126 mg/dl. In those with impaired glucose regulation from metabolic syndrome, higher carb intakes will tend to lead to higher levels of fasting blood glucose. (Note: this is true for carb intakes above about 40% of energy. On low-carb diets, higher carb intakes tend to lead to lower fasting blood glucose due to increased insulin sensitivity. However, nearly everyone in these countries eats more than 40% carb.) Thus, of two people with identical health, the one eating more carbs will show higher average blood glucose levels.
  3. Therefore, the fraction of those diagnosed as diabetic (as opposed to pre-diabetic) will increase as their carb consumption increases.
  4. In China and Japan, but not in the US and Australia, white rice consumption is a marker of carb consumption. So the fraction of those with metabolic syndrome diagnosed as diabetic will increase with white rice consumption in China and Japan, but will be uncorrelated with white rice consumption in the US and Australia.

Thus, diabetes incidence may be lower in China and Japan (due to lower incidence of metabolic syndrome on Asian diets), but higher among Chinese and Japanese eating the most rice (due to higher rates of diagnosis on the blood sugar criterion). This explains all of the data and is biologically sound.

What did the HSPH researchers conclude?

Higher consumption of white rice is associated with a significantly increased risk of type 2 diabetes, especially in Asian (Chinese and Japanese) populations.

No: Internationally, higher consumption of white rice is associated with a significantly reduced risk of type 2 diabetes, and the Chinese and Japanese experience is consistent with that. Carb consumption is associated with a higher rate of diabetes diagnosis within populations at otherwise similar risk for diabetes. White rice consumption is correlated to carb consumption especially strongly in Asian (Chinese and Japanese) populations.

Food Reward and “Eat Less, Move More” in Diabetes

Of course, the study authors knew that diabetes incidence is lower in countries that eat more white rice. How do they reconcile this with their claim that white rice increases diabetes risk?

The recent transition in nutrition characterised by dramatically decreased physical activity levels and much improved security and variety of food has led to increased prevalence of obesity and insulin resistance in Asian countries. Although rice has been a staple food in Asian populations for thousands of years, this transition may render Asian populations more susceptible to the adverse effects of high intakes of white rice …

In other words, rice-eating countries have higher physical activity and more boring food – just look at the notoriously tasteless cuisines of Thailand, China, and Japan – and their inability to eat high quantities of food has hitherto protected Thais, Chinese, Japanese, Filipinos, and Indonesians from diabetes.

However, once those rice eaters become office workers and learn how to spice their rice with more varied flavors, the deadly nature of rice may be revealed.

Stephan Guyenet writes that “Food Reward [is] Approaching a Scientific Consensus.” It certainly seems so; it is emerging as a catch-all explanation for everything, a perspective that can be trotted out in a few concluding sentences to reconcile a hypothesis (white rice causes diabetes) with data that contradict it.

Conclusion

To me, the HSPH white rice study doesn’t look like science. It looks like gaming of the grant process – generating surprising and disturbing results that seem to warrant further study, even if the researchers themselves know the results are most likely false.

Consensus or no – and consensus in science isn’t necessarily a sign of truth (hat tip: FrankG) – the food reward perspective seems to me an incomplete explanation for what is going on. It puts a lot of weight on a transition from highly palatable (Thai, Japanese, Chinese) food to “hyperpalatable” (American, junk) food as an explanation for obesity and diabetes. It seems to me that the lack of nutrients and abundance of toxins in the junk food may be just as important as its “hyperpalatability.” It’s the inability of the junk food to satisfy that is the problem, not its palatability.

I’m glad that the food reward perspective may start being tested against Asian experiences. That may shed a lot of light on these issues.

The Trouble With Pork, Part 3: Pathogens

We started this series with a look at remarkably strong correlations between pork consumption and liver cirrhosis mortality, liver cancer, and multiple sclerosis (Pork: Did Leviticus 11:7 Have It Right?, Feb 8, 2012). In Part 2, we looked at omega-6 fats in industrial pork meat and toxins in processed pork products as possible causes (The Trouble with Pork, Part 2, Feb 15, 2012).

That second post left us with several clues that some pathogen (or pathogens) that (a) infects both pigs and humans and (b) can be transmitted from pigs to humans via the eating of pork, is responsible for the disease associations. These clues include:

  1. The risk is higher for fresh pork than processed pork. Processed pork is generally cured or smoked, both steps that are anti-microbial.
  2. Eating fiber, which increases gut bacterial populations and enhances immune vigilance of the gut, is protective.
  3. The disease risk is specifically associated with two organs – the central nervous system (multiple sclerosis) and the liver (cirrhosis, hepatocellular carcinoma). Pathogens are more likely than other pork components to have tissue specificity.

Our mission today is to try to track down the pathogen(s), and figure out how to minimize risk of infection.

Pigs And Zoonotic Infections

Scientists studying xenotransplantation – the transplantation of animal organs into a person to replace a failing organ – have had the best luck with pig organs. Pigs are easier to work with than primates, not dramatically different in size than humans, and their organs are less likely to provoke rejection than those of other mammals. This suggests a similarity of biology between pigs and humans.

But biological similarity has its downsides. A large number of pathogens can infect both pigs and humans. More than any other animal, pigs pass pathogens to humans.

Indeed, investigators have been surprised at how frequently pathogens pass back and forth. According to a new study (discussed at Aetiology) of the evolutionary history of methicillin-resistant Staphylococcus aureus (MRSA), S. aureus was passed to pigs by their human caretakers. In pigs, which are routinely given antibiotics by industrial food producers, S. aureus picked up resistance genes to tetracyclines and methicillins. The resulting antibiotic-resistant ST398 strain was passed back to humans.

Wikipedia lists some of the pathogens that flourish in both pigs and humans and can infect humans who eat infected pork, usually undercooked pork:

Although all of these pathogens are potential concerns, I do not see strong specific links between the above pathogens and our three pork-associated diseases – liver cirrhosis, liver cancer, and multiple sclerosis.

However, there is another pathogen capable of infecting humans from pork that is a strong candidate: hepatitis E virus (HEV).

Hepatitis E

Hepatitis E was first observed in a 1955 outbreak in New Delhi, India. It generally produces an acute disease that lasts for several weeks; most victims recover with few symptoms, but in a few this acute illness progresses into a severe liver disease that can be fatal. About 2% of all infections lead to death from this acute liver disease; death rates are higher in pregnant women.

Hepatitis E seems to have evolved in the last millennium: There are four known genotypes, all of which infect humans and two of which infect pigs, and their common ancestor dates to 536 to 1344 years ago. [1] However, the pig-infecting genotypes 3 and 4 of Hepatitis E underwent a notable population expansion in the twentieth century, during which there has been “an extensive genetic divergence of HEV strains and high prevalence of HEV infections in many parts of the world.” [2]

The human-only genotypes of Hepatitis E are transmitted by fecal contamination of drinking water and are prevalent only in developing countries with poor sanitation; but the pig-and-human genotypes are transmitted primarily through pork consumption:

[G]enotypes 3 and 4 are associated with sporadic disease attributable to exposure to body fluids of infected swine [8] and ingestion of food products from pigs, boars and deer [11], [16], [18]. [1]

Hepatitis E seems to be most prevalent in Asia, the Middle East, and Africa:

Hepatitis E is the most important or the second most important cause of acute clinical hepatitis in adults throughout Asia, the Middle East and Africa. [8]

However, it has been spreading to Europe and the Americas:

HEV was rarely identified in industrialized countries, and the few reported cases of infection were usually in someone who had recently traveled to an endemic region. In the past few years this pattern has changed, as cases of endemic or autochthonous hepatitis E have been diagnosed with increasing frequency in individuals who have not traveled abroad….

Cases have been reported with increasing regularity throughout Western Europe, as well as in some Eastern European countries. [7]

The genotypes that coinfect humans and pigs may have originated in East Asia:

All but one genotype 4 sequence originated either from China or Japan…. [T]he genotype 3 sequences were divided into 3.1 and 3.2 clades … [A]lthough 87.5% of the clade 3.1 variants were from Asia and 60% of the clade 3.2 variants were from Europe (Table S1), these clades were found to have similar histories (Fig. 6). [1]

Historically, China and Japan did not raise cattle for food and pigs have been the major source of meat. Even today in southern China, pigs are often kept in the yards of homes, and close contact between pigs and humans facilitates zoonotic transmission.

At pig farms, Hepatitis E virus seems to spread readily. A Japanese study reported:

[O]ur estimates imply that more than 95% of pigs are infected before the age of 150 days. [3]

Presumably this is due to fecal-oral transmission among pigs in close quarters. At French farms, 65% of pigs were found to be hepatitis E infected at age 90 days. [4]

Transmission to Humans Via Pork

Can humans get infected by eating pork products? It now seems clear that the answer is yes.

A French study found that the genotype distribution of hepatitis E infecting humans is identical to the genotype distribution in pigs at slaughterhouses:

Frequent zoonotic transmission of hepatitis E virus (HEV) has been suspected, but data supporting the animal origin of autochthonous cases are still sparse. We assessed the genetic identity of HEV strains found in humans and swine during an 18-month period in France. HEV sequences identified in patients with autochthonous hepatitis E infection (n = 106) were compared with sequences amplified from swine livers collected in slaughterhouses (n = 43). Phylogenetic analysis showed the same proportions of subtypes 3f (73.8%), 3c (13.4%), and 3e (4.7%) in human and swine populations. Furthermore, similarity of >99% was found between HEV sequences of human and swine origins. These results indicate that consumption of some pork products, such as raw liver, is a major source of exposure for autochthonous HEV infection. [5]

As hepatitis E concentrates in the liver in both pigs and humans, swine livers were the natural place to test for hepatitis E presence, and probably the riskiest part of the pig to eat.

Further evidence that hepatitis E in pigs can infect humans was found in another French study. The researchers reasoned that sausage made from pig liver would be a likely vector for hepatitis E transmission to humans, especially a form of smoked pig liver sausage traditionally eaten raw – figatellu. Their findings:

Acute or recent HEV infection, defined by detection of anti-HEV immunoglobulin M antibodies and/or HEV RNA, was observed in 7 of 13 individuals who ate raw figatellu and 0 of 5 individuals who did not eat raw figatellu (P=.041). Moreover, HEV RNA of genotype 3 was recovered from 7 of 12 figatelli purchased in supermarkets, and statistically significant genetic links were found between these sequences and those recovered from patients who ate raw figatellu….

Our findings strongly support the hypothesis of HEV infection through ingestion of raw figatellu. [6]

The titer of hepatitis E viruses in the supermarket sausage reached as high as a million copies per slice. [6] This data suggests that a majority of figatellu in French supermarkets carries hepatitis E virus, and that a majority of people who eat figatellu acquire hepatitis E infections.

Contact with pigs can also lead to transmission; swine workers have an elevated prevalence of antibodies to HEV in the United States. [7]

Does Cooking Inactivate the Viruses?

What level of cooking is needed to inactivate the virus?

It is difficult to prove that any particular cooking or processing method renders HEV non-infectious:

How safe are these products? The question is difficult to answer because HEV grows poorly in cell culture, and in vivo testing of viability requires nonstandard laboratory animals—nonhuman primates or pigs for genotypes 3 and 4. [7]

Since scientists don’t have the funding or facilities to see if feeding cooked, cured, or smoked pork to primates or pigs gives them hepatitis E, they have no way of verifying that cooked, cured, or smoked pork is free of HEV.

In test tube experiments, HEV was still viable and infectious after cooking for 1 hour at 56°C, the temperature of rare to medium-cooked meat. [9] About 80% of viruses were inactivated after an hour at 60°C, and an hour at 70°C probably eliminates the viruses.

The implication is that thorough cooking would destroy HEV, but that some HEV will survive in rare to medium cooked pork, with liver likely having the greatest viral titer. [9] “However, much pork is consumed that has not had even that degree of cooking.” [7]

One way to reduce the risk of infection is to avoid the pig tissues that have the highest viral titers:

HEV can be found in the liver, blood, and intestinal tract, which are all consumed in one form or another and often together, such as in sausages. [7]

So: to avoid HEV infection, it’s best to avoid pork liver, intestines, or blood, or products made from them such as sausage; other cuts should be carefully rinsed of all blood and then cooked thoroughly to a temperature of at least 70°C. Simmering in near-boiling water for an hour should be sufficient.

The most dangerous pork product is likely to be sausage, which often uses pork liver meat, and traditionally uses pig intestines as the casing. It may also contain traces of pig blood. Pig blood pudding, a traditional Chinese dish, should also be avoided.

Links to Pork-Associated Liver Diseases

Hepatitis E was discovered as a cause of acute liver disease. But what about chronic diseases like alcoholic cirrhosis and liver cancer? Is there really evidence linking it to these diseases?

First, studies of organ-transplant recipients who contracted hepatitis E from their donors have shown that HEV seems to establish chronic infections in at least 58% of infected persons. [10] When anti-HEV antibodies exist, generally active viral RNA is present too. [12] So the virus is persistent.

Hepatitis B and C viruses are known causes of alcoholic liver cirrhosis. What about HEV? There have been few studies, but those that exist suggest it is likely:

  • A child developed cirrhosis after a bone marrow transplant due to a swine-derived form of hepatitis E. [11]
  • A Spanish study found a strong association between HEV and cirrhosis in people infected with HIV: “Liver cirrhosis was the only factor independently associated with the presence of anti-HEV, which was documented in 23% of patients with cirrhosis and 6% of patients without cirrhosis (P?=?0.002; odds ratio 5.77). HEV RNA was detected in three seropositive patients (14%), two of whom had liver cirrhosis.” [12]
  • HEV seems to be a common cause of cirrhosis in Egypt. [13]

Hepatitis B and hepatitis C viruses are known causes of hepatocellular carcinoma. What about HEV? If there were few studies linking HEV to cirrhosis, there are even fewer investigating its relationship to HCC.

I did find one Chinese study showing that HEV infection greatly elevated the association of aflatoxin with HCC. (Aflatoxin, a fungal toxin that damages the liver, is a known risk factor for HCC.) [14]

Epidemiology is also suggestive. I mentioned earlier that the pork-transmitted genotypes of HEV have only recently appeared in the Americas. If HEV is responsible for alcoholic cirrhosis, hepatocellular carcinoma (HCC), or multiple sclerosis, then we should be seeing the incidence of those diseases increase. In fact, that is true for HCC:

In the U.S., incidence rates of HCC in both men and women have increased steadily during the past three decades. The reasons for this steady increase remain unknown. [15]

What About Multiple Sclerosis?

There have been no studies searching for a specific link between HEV and multiple sclerosis.

However, it may be worth reviewing what some mouse models tell us about the potential for a hepatitis virus to cause MS. MS is an infectious or autoimmune disease:

MS is felt to be most likely either due to an aberrant immune response or a pathogen, or possibly a combination of the two, and the animal models available reflect these two possible pathogeneses. [16]

Regular readers will know that I believe MS is infectious in origin. There are three animal models for MS. One of them (“experimental allergic encephalomyelitis” or EAE) involves immunizing mice with myelin or myelin proteins so that they develop antibodies to their own myelin; the other two involve infecting mice with viruses:

Two viruses, Theiler’s murine encephalomyelitis virus and murine hepatitis virus, are used to induce infectious models of the disease. [16]

The murine hepatitis virus (MHV) model is suggestive: it supports the idea that a virus that causes hepatitis may also cause MS. Some strains of MHV are neurotropic, infecting both the liver and central nervous system, and it is these that most readily produce an MS-like disease. [17]

If a hepatitis virus is causing MS in humans, we would expect MS patients to have high rates of liver disease. Indeed, there is a correlation.

MS patients are 3.7-fold more likely to have elevated ALT and 2.2-fold more likely to have elevated AST – both liver enzymes associated with liver disease. Also, elevated ALT and AST are associated with the more severe relapsing-remitting form of MS. [18]

A few perhaps insignificant links: Patients with systemic sclerosis, who are about 5-fold more likely to develop MS than others, are also at high risk for liver disease. [19] In the 1980s, doctors began observing MS patients with cases of primary biliary cirrhosis severe enough to require liver transplantation. [20]

Other Pig-Human Pathogens and MS

Pork can carry many pathogens; perhaps hepatitis E virus is not the MS-causing pathogen.

I don’t see obvious candidates however. Perhaps herpes viruses would be most likely. One of the human pathogens likely to be causal for MS is Epstein-Barr virus, also known as human herpes virus 4 (HHV-4). It causes mononucleosis but establishes persistent infections and is associated with a number of diseases, including lymphomas, MS, lupus, and rheumatoid arthritis.

Human herpes viruses may be able to establish infections in pigs. [21] And there are porcine herpes viruses that are closely related to Epstein-Barr virus. [22]

Conclusion

There is a strong association between pork consumption and liver cirrhosis mortality, liver cancer, and multiple sclerosis.

It seems likely that the association, if it is real, is mediated by a pathogen. The most likely pathogen in the case of the liver diseases is hepatitis E virus. In MS, the pathogen remains unknown, but is likely to be a virus.

Hepatitis E virus is not destroyed by casual cooking, smoking, or curing. It appears that meat must  reach temperatures of 70ºC (160ºF) before viruses are inactivated; and it is possible that meat must remain at that temperature for some time, perhaps as long as an hour. Rare or medium cooked pork could contain active viruses.

Hepatitis E viruses are most abundant in liver, intestine, and blood. Pork products containing these parts, such as sausage, may be best avoided.

Meat from parts of the pig with low viral titers, such as pork ribs or pork bellies, are likely to be safe to eat as long as they are well cooked. Be sure to wash the meat of all blood before cooking, and to cook thoroughly.

Related Posts

Posts in this series:

References

[1] Purdy MA, Khudyakov YE. Evolutionary history and population dynamics of hepatitis E virus. PLoS One. 2010 Dec 17;5(12):e14376. http://pmid.us/21203540.

[2] Purdy MA, Khudyakov YE. The molecular epidemiology of hepatitis E virus infection. Virus Res. 2011 Oct;161(1):31-9. http://pmid.us/21600939.

[3] Satou K, Nishiura H. Transmission dynamics of hepatitis E among swine: potential impact upon human infection. BMC Vet Res. 2007 May 10;3:9. http://pmid.us/17493260.

[4] Kaba M et al. Frequent transmission of hepatitis E virus among piglets in farms in Southern France. J Med Virol. 2009 Oct;81(10):1750-9. http://pmid.us/19697419.

[5] Bouquet J et al. Close similarity between sequences of hepatitis E virus recovered from humans and swine, France, 2008-2009. Emerg Infect Dis. 2011 Nov;17(11):2018-25. http://pmid.us/22099089.

[6] Colson P et al. Pig liver sausage as a source of hepatitis E virus transmission to humans. J Infect Dis. 2010 Sep 15;202(6):825-34. http://pmid.us/20695796.

[7] Purcell RH, Emerson SU. Hidden danger: the raw facts about hepatitis E virus. J Infect Dis. 2010 Sep 15;202(6):819-21. http://pmid.us/20695795.

[8] Purcell RH, Emerson SU. Hepatitis E: an emerging awareness of an old disease. J Hepatol. 2008 Mar;48(3):494-503. http://pmid.us/18192058.

[9] Emerson SU et al. Thermal stability of hepatitis E virus. J Infect Dis. 2005 Sep 1;192(5):930-3. http://pmid.us/16088844.

[10] Legrand-Abravanel F et al. Characteristics of autochthonous hepatitis E virus infection in solid-organ transplant recipients in France. J Infect Dis. 2010 Sep 15;202(6):835-44. http://pmid.us/20695798.

[11] Halac U et al. Cirrhosis due to Chronic Hepatitis E Infection in a Child Post-Bone Marrow Transplant. J Pediatr. 2012 Feb 15. [Epub ahead of print] http://pmid.us/22341950.

[12] Jardi R et al. HIV, HEV and cirrhosis: evidence of a possible link from eastern Spain. HIV Med. 2012 Jan 18. http://pmid.us/22257075.

[13] El Sayed Zaki M, Othman W. Role of hepatitis E infection in acute on chronic liver failure in Egyptian patients. Liver Int. 2011 Aug;31(7):1001-5. http://pmid.us/21733089.

[14] Tao P et al. Associated factors in modulating aflatoxin B1-albumin adduct level in three Chinese populations. Dig Dis Sci. 2005 Mar;50(3):525-32. http://pmid.us/15810636.

[15] Yuan JM et al. Synergism of alcohol, diabetes, and viral hepatitis on the risk of hepatocellular carcinoma in blacks and whites in the U.S. Cancer. 2004 Sep 1;101(5):1009-17. http://pmid.us/15329910.

[16] Pachner AR. Experimental models of multiple sclerosis. Curr Opin Neurol. 2011 Jun;24(3):291-9. http://pmid.us/21519255.

[17] Carbajal KS et al. Surgical transplantation of mouse neural stem cells into the spinal cords of mice infected with neurotropic mouse hepatitis virus. J Vis Exp. 2011 Jul 10;(53). http://pmid.us/21775959.

[18] Tremlett H et al. Liver test abnormalities in multiple sclerosis: findings from placebo-treated patients. Neurology. 2006 Oct 10;67(7):1291-3. http://pmid.us/17030771.

[19] Robinson D Jr et al. Systemic sclerosis prevalence and comorbidities in the US, 2001-2002.  Curr Med Res Opin. 2008 Apr;24(4):1157-66. http://pmid.us/18430269.

[20] A patient with primary biliary cirrhosis and multiple sclerosis. Am J Med. 1992 Apr;92(4):433-6. http://pmid.us/1558090.

[21] Kim JH et al. Infection of porcine cells with human herpesviruses. Transplant Proc. 2010 Jul-Aug;42(6):2134-7. http://pmid.us/20692426.

[22] Doucette K et al. Gene expression of porcine lymphotrophic herpesvirus-1 in miniature Swine with posttransplant lymphoproliferative disorder. Transplantation. 2007 Jan 15;83(1):87-90. http://pmid.us/17220799.