Category Archives: Diabetes

Disease Begins in the Mucus

Hippocrates famously said, “All disease begins in the gut.” I think we can narrow it down further: much modern disease begins in the mucus.

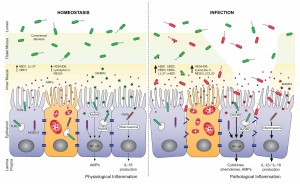
In a recent post, I put up this picture:

Antimicrobial peptides (AMPs), including defensins and cathelicidins, constitute an arsenal of innate regulators of paramount importance in the gut.

A depleted mucosal layer leads to inflammation and gut permeability.

It’s from a paper on the role of antimicrobial peptides in maintaining gut health. [1] The point of the left panel is that a healthy gut is characterized by a thick mucosal layer that shields our intestinal and immune cells from direct contact with bacteria. The inner mucus layer is infused with antimicrobial peptides to minimize its bacterial content. The outer mucus layer contains a population of friendly mucin-degrading bacteria – symbionts like Akkermansia who evolved to feed on our mucus. These friendly bacteria provide another layer of defense against infectious pathogens; bacteria tend to be quite good at keeping out competitors. Akkermansia has been found to prevent obesity.

In an unhealthy gut, on the other hand, the mucosal layer often gets stripped away. The image (right panel) attributes this to infection, which is one possibility, but nutritional factors also matter. For example:

  • Deficiencies of vitamins A or D will reduce production of antimicrobial peptides, making it easier for pathogens to reach our gut cells;
  • On very low-carb diets, production of mucin-2, the primary constituent of gut mucus, may be limited in order to preserve glucose for the brain (see “Dangers of Zero-Carb Diets, II: Mucus Deficiency and Gastrointestinal Cancers,” Nov 15, 2010);
  • Deficiencies of dietary fiber, vinegar, choline, and other nutrients may impair gut motility, leading to concentrations of partially digested food and bacteria at specific points in the intestine.

Regardless of why it happens, once bacteria come into direct contact with our gut and immune cells, they trigger inflammation and tend to loosen the gut barrier. This allows live bacteria and cell wall components from dead bacteria to enter the body from the gut.

Endotoxins – toxic compounds released when bacteria die, such as lipopolysaccharides from the cell walls of gram-negative bacteria – are immunogenic and inflammatory. A large influx of endotoxins into the body is “endotoxemia” – poisoning by endotoxins. As little as 2 nanograms LPS per kilogram body weight will induce fever, and 1 microgram LPS per kilogram of body weight will induce shock. [2]

Diseases caused by endotoxemia include:

  • Hepatitis [3]
  • Diabetes [4]
  • Heart disease [5]
  • Obesity [6]
  • Pulmonary hypertension [7]
  • Dyslipidemia [8]
  • Chronic kidney disease [9]

Many of today’s most prevalent diseases are caused by chronic endotoxemia.

So it behooves us to avoid it. If endotoxemia is fundamentally caused by the loss of a protective mucosal layer in the gut, how do we assure healthy production of mucus?

A recent paper sheds valuable light on that question.

Natural Whole Foods, High-Fat Diets, and Gut Health

It’s well known that in mice, “high-fat diets” induce endotoxemia. But these diets aren’t necessarily high in fat – any pelleted rodent food in which fat provides more than 20% of calories may be called “high-fat.” The critical difference of “high-fat diets” from chow is that they are composed of purified nutrients – starch, sugar, oil, vitamins, and minerals – whereas chow is composed of natural whole foods such as wheat, corn, and seeds.

A recent study tried to distinguish whether the cause of endotoxemia is the fat, or the purified starch, sugar, and oil. It made up three diets of varying fat content (8%, 48%, and 74% of energy respectively), but composed of natural whole foods. [10]

The result was remarkable:

[U]sing complex [i.e. natural whole foods] HFD, no associations were observed between dietary lipid amounts and the magnitude of endotoxemia, inflammation, and physiological alterations developed.

It turns out the endotoxemia that typically develops on high-fat diets is due to getting the calories from purified sources – starch, sugar, oil – rather than from whole foods. On a whole foods diet, the amount of endotoxin entering the body is more or less independent of the amount of fat consumed.

This is surprising in one respect. Lipopolysaccharide is fat-loving and enters the body along with dietary fat. So it stands to reason that a higher-fat diet would carry more endotoxin into the body.

But it turns out the body has mechanisms to regulate how much endotoxin enters the body. It wants a small amount so that the immune system can sample the gut microbiome, but not so much as to cause inflammation.

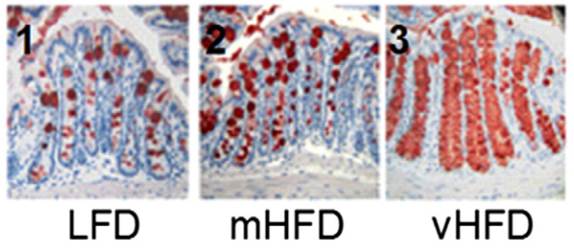
The primary mechanism for controlling endotoxin influx? Mucus production. The study noted that the mice eating higher-fat “had an increased number of goblet cells … [and] an increased MUC2 production.” MUC2 is mucin-2, the primary component of mucus in the gut.

Here is a picture with mucin-2 in the mucin-producing goblet cells stained red:

disease begins in mucus 02

It’s obvious that mucin production goes up dramatically as the fat content of the diet increases.

The study concludes,

“We show that, in complex HFDs based on chow ingredients and milk fat, there was no association between dietary lipid amounts and the magnitude of metabolic endotoxemia or low-grade inflammation.”

If high-fat diets are healthy, we can thank our mucin-producing goblet cells.

One last note: the fact that mice can produce healthy amounts of mucus on a 74% fat diet does not necessarily mean that humans can do the same. Humans have much larger brains than mice, and as a result our carbohydrate needs are larger. It’s possible that mice can maintain mucus production on a low-carb diet better than humans can.

References

[1] Muniz LR, Knosp C, Yeretssian G. Intestinal antimicrobial peptides during homeostasis, infection, and disease. Front Immunol. 2012 Oct 9;3:310. http://pmid.us/23087688.

[2] Warren HS et al. Resilience to bacterial infection: difference between species could be due to proteins in serum. J Infect Dis. 2010 Jan 15;201(2):223-32. http://pmid.us/20001600.

[3] Parlesak A, Schäfer C, Schütz T, Bode JC, Bode C. Increased intestinal permeability to macromolecules and endotoxemia in patients with chronic alcohol abuse in different stages of alcohol-induced liver disease. J Hepatol. 2000 May;32(5):742-7. http://pmid.us/10845660.

[4] Moreno-Navarrete JM et al. Circulating lipopolysaccharide-binding protein (LBP) as a marker of obesity-related insulin resistance. Int J Obes (Lond). 2012 Nov;36(11):1442-9. http://pmid.us/22184060.

[5] Lepper PM et al. Association of lipopolysaccharide-binding protein and coronary artery disease in men. J Am Coll Cardiol. 2007 Jul 3;50(1):25-31. http://pmid.us/17601541.

[6] Cani PD et al. Metabolic endotoxemia initiates obesity and insulin resistance. Diabetes. 2007 Jul;56(7):1761-72. http://pmid.us/17456850.

[7] Dschietzig T, Alexiou K, Richter C, Bobzin M, Baumann G, Stangl K, Brunner F. Endotoxin causes pulmonary hypertension by upregulating smooth muscle endothelin type-B receptors: role of aldose reductase. Shock. 2008 Aug;30(2):189-96. http://pmid.us/18091567.

[8] Lassenius MI et al. Bacterial endotoxin activity in human serum is associated with dyslipidemia, insulin resistance, obesity, and chronic inflammation. Diabetes Care. 2011 Aug;34(8):1809-15. http://pmid.us/21636801.

[9] McIntyre CW et al. Circulating endotoxemia: a novel factor in systemic inflammation and cardiovascular disease in chronic kidney disease. Clin J Am Soc Nephrol. 2011 Jan;6(1):133-41. http://pmid.us/20876680.

[10] Benoit B et al. Increasing fat content from 20 to 45 wt% in a complex diet induces lower endotoxemia in parallel with an increased number of intestinal goblet cells in mice. Nutr Res. 2015 Apr;35(4):346-56. http://pmid.us/25687164.


Look AHEAD Scientists: Trying to Move the Deer Crossing

The Look AHEAD: Action for Health in Diabetes trial has been halted two years early. Here’s Gina Kolata in The New York Times:

The study randomly assigned 5,145 overweight or obese people with Type 2 diabetes to either a rigorous diet and exercise regimen or to sessions in which they got general health information. The diet involved 1,200 to 1,500 calories a day for those weighing less than 250 pounds and 1,500 to 1,800 calories a day for those weighing more. The exercise program was at least 175 minutes a week of moderate exercise.

But 11 years after the study began, researchers concluded it was futile to continue — the two groups had nearly identical rates of heart attacks, strokes and cardiovascular deaths.

It’s clearly a negative result for “eat less, move more” as a health strategy for obese diabetics.

Was “Eat Less Move More” Harmful?

A few Paleo bloggers are not surprised; indeed, Peter Dobromylskyj speculates that all-cause mortality – which Ms. Kolata and the NIH press release do not report – may have been higher in the “eat less, move more” intervention group:

It seems very likely to me that more people died in the intervention group than in the usual care group, but p was > 0.05.

Call me a cynic, but I think they stopped the trial because they could see where that p number was heading.

Peter may be a cynic but cynics are sometimes right, and I will bet that he’s right about this. In general, calorie restriction and exercise are better attested against cardiovascular disease than against other health conditions, so if death rates from CVD were identical in the two arms after 11 years, it’s quite likely death rates from other causes were higher in the intervention arm.

Our Theory

We discuss in our new Scribner edition two reasons why “eat less, move more” can backfire:

  • On a malnourishing diet, “eat less” means even greater malnourishment. Less of a bad diet is a worse diet.
  • Excessive exercise may over-stress the body and harm health. In diseased people, the volume at which exercise becomes excessive may not be that high.

On the other hand, ultimately some form of “eat less, move more” is needed if optimal health is to be attained:

  • An energy deficit – eating less than the body expends – is necessary to lose fat mass, and obesity is probably incompatible with optimal health.
  • About 20 to 30 minutes of exercise per day at the intensity of running or jogging is needed for optimal health, probably due to the role of daytime activity in entraining circadian rhythms (see “Physical Activity: Whence Its Healthfulness?”, October 11, 2012). Most people would need to “move more” to achieve this.

So the challenge in weight loss is two-fold: It’s necessary to adopt a healthy diet in which malnourishment doesn’t occur despite calorie restriction, and to find a healthy level of exercise that improves health without overstressing the body.

Look AHEAD: Bad Dietary Advice

The Look AHEAD Study Protocol tells us what the intervention group was told to do.

From page 29, here is the diet advice:

The recommended diet is based on guidelines of the ADA and National Cholesterol Education program [96,97] and includes a maximum of 30% of total calories from total fat, a maximum of 10% of total calories from saturated fat, and a minimum of 15% of total calories from protein.

This gives 55% carbs and probably 10% omega-6 fat. The omega-6 intake is far too high – for weight loss and good health, omega-6 intake should be less than 4% – and so is the carb intake – for diabetics, reducing carbs to 30% or less is highly desirable.

From page 30, here is the exercise advice:

The physical activity program of Look AHEAD relies heavily on unsupervised exercise, with gradual progression toward a goal of 175 minutes of moderate intensity physical activity per week by the end of the first six months. Exercise bouts of ten minutes and longer are counted toward this goal. Exercise is recommended to occur five days per week.

Moderate-intensity walking is encouraged as the primary type of physical activity.

I think this is reasonable advice. It translates to 35 minutes per day for 5 days. The intensity is quite low. This level of exercise is hardly likely to be excessive; indeed, it’s probably grossly insufficient for optimal health. It represents about a mile and a half of walking per day, five days per week. This may have been a homeopathic level of activity.

There is another reason the exercise may have produced no observable benefit. Since I believe the health benefits of exercise occur primarily through circadian rhythm entrainment, it’s likely that daytime exercise is much more beneficial than night-time exercise. Night-time exercise might be ineffective or even harmful to health if it disrupts circadian rhythms.

Unfortunately many people find it difficult to find time during the day for exercise. If the walking was performed at night, even the modest benefits of the activity may have been lost.

Weight and Health: What’s the Direction of Causation?

The one “success” of Look AHEAD was that it brought about some weight loss: the intervention group lost 5% of their original weight.

We know that obesity is associated with poor health. Since causation implies correlation, the existence of this correlation suggests that either (1) obesity causes poor health, (2) poor health causes obesity, or (3) some third factors cause both obesity and poor health.

The Look AHEAD study presumed (1) – that obesity causes poor health. The “eat less, move more” intervention was wholly directed at weight loss. If obesity is the cause of poor health, Look AHEAD should have improved health. It didn’t. This tells us that the direction of causality is either (2) or (3). Obesity doesn’t impair health; other factors that impair health cause obesity.

It’s easy to make faulty inferences about the direction of causation. The Look AHEAD scientists made the same mistake this woman did:

Conclusion

The basic flaw in the Look AHEAD study was that it was designed to bring about weight loss, and hoped that weight loss would improve health.

A better intervention would seek to improve health through a more PHD-like diet and through circadian rhythm therapies. Successful health improvement would, more than likely, lead to weight loss.

For the overweight and for diabetics, the focus should not be on weight, but on health. Improve health, and weight loss will follow. Focus on weight with a simple-minded “eat less, move more” intervention without tending to the quality of your diet and lifestyle, and you might be doing yourself more harm than good.

Are Low Doses of Niacin Dangerous?

In Food Fortification: A Risky Experiment?, Mar 23, 2012, we began looking at the possibility that fortification of food, especially the enriched flours used in commercial baked goods, with niacin, iron, and folic acid may have contributed to the obesity and diabetes epidemics.

As this plot shows, fortification caused intake of per capita niacin intake in the United States to rise from about 20 mg/day to about 32 mg/day:

Multivitamins typically contain about 20 mg niacin, so (a) a typical American taking a multivitamin is getting 52 mg/day niacin, and (b) if the increase of 12 mg/day due to fortification is dangerous, then taking a multivitamin would be problematic too.

There wasn’t evidence of niacin deficiency at 20 mg/day. The RDA was set at 16 mg/day for men and 14 mg/day, levels that equalize intake with urinary excretion of niacin metabolites [source: Dietary Reference Intakes]. Fortification of grains with niacin was designed to make refined white wheat have the same niacin content as whole wheat, not to rectify any demonstrated deficiency of niacin.

B-vitamins are normally considered to have low risk for toxicity, since they are water soluble and easily excreted. But recently, scientists from Dalian University in China proposed that niacin fortification may have contributed to the obesity and diabetes epidemics. [1] [2]

Niacin, Oxidative Stress, and Glucose Regulation

The Chinese researchers note that niacin affects both appetite and glucose metabolism:

[N]iacin is a potent stimulator of appetite and niacin deficiency may lead to appetite loss [10]. Moreover, large doses of niacin have long been known to impair glucose tolerance [23,24], induce insulin resistance and enhance insulin release [25,26].

They propose that niacin’s putative negative effects may be mediated by oxidative stress, perhaps compounded by poor niacin metabolism:

Our recent study found that oxidative stress may mediate excess nicotinamide-induced insulin resistance, and that type 2 diabetic subjects have a slow detoxification of nicotinamide. These observations suggested that type 2 diabetes may be the outcome of the association of high niacin intake and the relative low detoxification of niacin of the body [27].

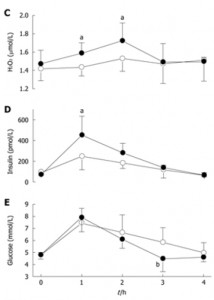
The effect of niacin on glucose metabolism is visible in this experiment. Subjects were given an oral glucose tolerance test of 75 g glucose with or without 300 mg nicotinamide. [1, figure source]

Dark circles are from the OGTT with niacinamide, open circles without. Plasma hydrogen peroxide levels, a marker of oxidative stress, and insulin levels were higher in the niacinamide group. Serum glucose was initially slightly higher in the niacinamide group, but by 3 hr had dropped significantly, to the point of hypoglycemia in two subjects:

Two of the five subjects in NM-OGTT had reactive hypoglycemia symptoms (i.e. sweating, dizziness, faintness, palpitation and intense hunger) with blood glucose levels below 3.6 mmol/L [64 mg/dl]. In contrast, no subjects had reactive hypoglycemic symptoms during C-OGTT. [1]

Of course 300 mg is a ten-fold higher niacinamide dose than most people obtain from food, but perhaps chronic intake of 32 mg/day (52 mg/day with a multivitamin) daily over a period of years have similar cumulative effects on glucose tolerance as a one-time dose of 300 mg.

Is There a Correlation with Obesity?

OK. Is there an observable relationship between niacin intake and obesity or diabetes?

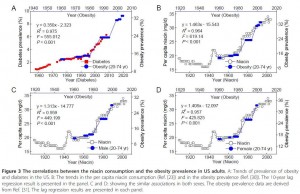
There may be, but only with a substantial lag. Here is a figure that illustrates the possible connection [2, figure source]:

Niacin intake maps onto obesity rates with a 10-year lag. After niacin intake rose, obesity rates rose 10 years later. Note the scaling: a 60% increase in niacin intake was associated with a doubling of obesity rates 10 years later.

Obesity leads diabetes by about 15 years, so we could also get a strong correlation between niacin intake and diabetes incidence 25 years later. The scaling in this case would be a 35% increase in niacin associated with a 140% increase in diabetes prevalence after a lag of 25 years.

How seriously should we take this? As evidence, it’s extremely weak. There was a one-time increase in niacin intake at the time of fortification. A long time later, there was an increase in obesity, and long after that, an increase in diabetes. So we really have only 3 events, and given the long lag times between them, the association between the events is highly likely to be attributable to chance.

It was to emphasize the potential for false correlations that I put the stork post up on April 1 (Theory of the Stork: New Evidence, April 1, 2012). Just because two data series can be made to line up, with appropriate scaling of the vertical axis and lagging of the horizontal axis, doesn’t mean there is causation involved.

Is There Counter-Evidence?

Yes.

If niacin from wheat fortification is sufficient to cause obesity or diabetes, with an average intake of 12 mg/day, then presumably the 20 mg of niacin in multivitamins would also cause obesity or diabetes.

So we should expect obesity and diabetes incidence to be higher in long-time users of multivitamins or B-complex vitamins.

But in fact, people who take multivitamins or B-complex vitamins have a lower subsequent incidence of obesity and diabetes.

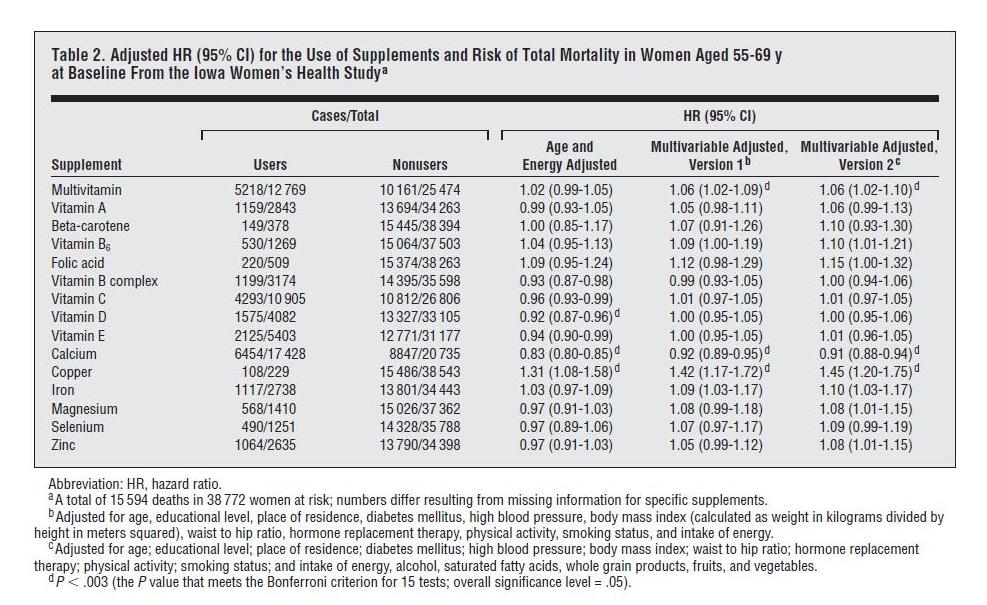
One place we can see this is in the Iowa Women’s Health Study, discussed in a previous post (Around the Web; The Case of the Killer Vitamins, Oct 15, 2011). In that post I looked at a study analysis which was highly biased against vitamin supplements; the authors chose to do 11-factor and 16-factor adjustments designed to make supplements look bad. The worst part of the analysis, from my point of view, was using obesity and diabetes as adjustment factors in the regression analysis. As you can see in the table below, multivariable adjustment including obesity and diabetes significantly raises the mortality associated with consumption of multivitamins or B-complex supplements:

This increase in hazard ratios (“HR”) with adjustment for obesity and diabetes almost certainly indicates that the supplements reduce the incidence of these diseases.

Multivitamins are protective in other studies too. The relation between multivitamin use and subsequent incidence of obesity was specifically analyzed in the Quebec Family Study, which found that “nonconsumption of multivitamin and dietary supplements … [was] significantly associated with overweight and obesity in the cross-sectional sample.” [3]

Does this exculpate niacin supplementation? I don’t think so. In general, improved nutrition should reduce appetite, since the point of eating is to obtain nutrients. So it’s no surprise that multivitamin use reduces obesity incidence. But multivitamins contain many nutrients, and it could be that benefits from the other nutrients are concealing long-term harms from the niacin.

Conclusion

At this point I think the evidence against niacin is too weak to convict in a court of law.

Nevertheless, we do have:

  • Clear evidence that high-dose (300 mg) niacinamide causes oxidative stress and impaired glucose tolerance. If niacinamide can raise levels of peroxide in the blood, what is it doing at mitochondria?
  • No clear evidence for benefits from niacin fortification or supplementation.

Personally I see no clear evidence that niacin supplementation, even at the doses in a multivitamin, is likely to be beneficial. Along with other and stronger considerations, this is pushing me away from multivitamin use and toward supplementation of specific individual micronutrients whose healthfulness is better attested.

I also think that food fortification was a risky experiment with the American people, and stands as yet another reason to avoid eating grains and grain products. (And to rinse white rice before cooking, to remove the enrichment mixture.)

References

[1] Li D et al. Chronic niacin overload may be involved in the increased prevalence of obesity in US children. World J Gastroenterol. 2010 May 21;16(19):2378-87. http://pmid.us/20480523.

[2] Zhou SS et al. B-vitamin consumption and the prevalence of diabetes and obesity among the US adults: population based ecological study. BMC Public Health. 2010 Dec 2;10:746. http://pmid.us/21126339.

[3] Chaput JP et al. Risk factors for adult overweight and obesity in the Quebec Family Study: have we been barking up the wrong tree? Obesity (Silver Spring). 2009 Oct;17(10):1964-70. http://pmid.us/19360005.

Red Meat and White Rice, Oh My!

This started as a note for an Around the Web, but has grown … so it will stand on its own.

The Red Meat Study

The Paleosphere has been abuzz about the red meat study from the Harvard School of Public Health. I don’t have much to say about it because the claimed effect is small and, at first glance, not enough data was presented to critique their analysis. There are plenty of confounding issues: (1) We know pork has problems that beef and lamb do not (see The Trouble With Pork, Part 3: Pathogens and earlier posts in that series), but all three meats were lumped together in a “red meat” category. (2) As Chris Masterjohn has pointed out, the data consisted of food frequency questionnaires given to health professionals, and most respondents understated their red meat consumption. Those who reported high meat consumption were “rebels” who smoked, drank, and did not exercise. (3) The analysis included multivariate adjustment for many factors, which can have large effects on assessed risk. Study authors can easily bias the results substantially in whatever direction they prefer. I’ve discussed that problem in The Case of the Killer Vitamins.

So it’s hard to judge the merits of the red meat study. However, another study from HSPH researchers came out at the same time that was outright misleading.

The White Rice and Diabetes Study

This study re-analyzed four studies from four countries – China, Japan, Australia, and the United States – to see how the incidence of diabetes diagnosis related to white rice consumption within each country.

Here was the main data:

The key thing to notice is that the y-axis of this plot is NOT incidence of type 2 diabetes. It is relative risk within each country for type 2 diabetes.

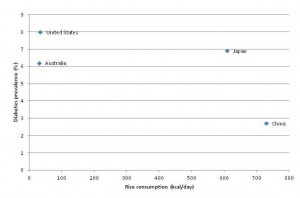
I looked up diabetes incidence and rice consumption in these four countries. Here is the scatter plot:

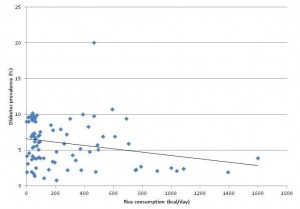
Here is the complete FAO database of 86 countries, with a linear fit to the data:

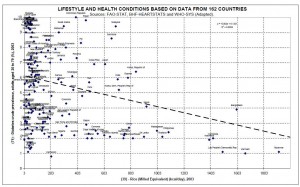
UPDATE: O Primitivo has data for 162 countries and a better chart. Here it is – click to enlarge:

If anything, diabetes incidence goes down as rice consumption increases. Countries with the highest white rice consumption, such as Thailand, the Philippines, Indonesia, and Bangladesh, have very low rates of diabetes. The outlier with 20% diabetes prevalence is the United Arab Emirates.

A plausible story is this:

  1. Something entirely unrelated to white rice causes metabolic syndrome. Possibly, the something which causes metabolic syndrome is dietary and is displaced from the diet by rice consumption, thus countries with higher rice consumption have lower incidence of metabolic syndrome.
  2. Diabetes is diagnosed as a fasting glucose that exceeds a fixed threshold of 126 mg/dl. In those with impaired glucose regulation from metabolic syndrome, higher carb intakes will tend to lead to higher levels of fasting blood glucose. (Note: this is true for carb intakes above about 40% of energy. On low-carb diets, higher carb intakes tend to lead to lower fasting blood glucose due to increased insulin sensitivity. However, nearly everyone in these countries eats more than 40% carb.) Thus, of two people with identical health, the one eating more carbs will show higher average blood glucose levels.
  3. Therefore, the fraction of those diagnosed as diabetic (as opposed to pre-diabetic) will increase as their carb consumption increases.
  4. In China and Japan, but not in the US and Australia, white rice consumption is a marker of carb consumption. So the fraction of those with metabolic syndrome diagnosed as diabetic will increase with white rice consumption in China and Japan, but will be uncorrelated with white rice consumption in the US and Australia.

Thus, diabetes incidence may be lower in China and Japan (due to lower incidence of metabolic syndrome on Asian diets), but higher among Chinese and Japanese eating the most rice (due to higher rates of diagnosis on the blood sugar criterion). This explains all of the data and is biologically sound.

What did the HSPH researchers conclude?

Higher consumption of white rice is associated with a significantly increased risk of type 2 diabetes, especially in Asian (Chinese and Japanese) populations.

No: Internationally, higher consumption of white rice is associated with a significantly reduced risk of type 2 diabetes, and the Chinese and Japanese experience is consistent with that. Carb consumption is associated with a higher rate of diabetes diagnosis within populations at otherwise similar risk for diabetes. White rice consumption is correlated to carb consumption especially strongly in Asian (Chinese and Japanese) populations.

Food Reward and “Eat Less, Move More” in Diabetes

Of course, the study authors knew that diabetes incidence is lower in countries that eat more white rice. How do they reconcile this with their claim that white rice increases diabetes risk?

The recent transition in nutrition characterised by dramatically decreased physical activity levels and much improved security and variety of food has led to increased prevalence of obesity and insulin resistance in Asian countries. Although rice has been a staple food in Asian populations for thousands of years, this transition may render Asian populations more susceptible to the adverse effects of high intakes of white rice …

In other words, rice-eating countries have higher physical activity and more boring food – just look at the notoriously tasteless cuisines of Thailand, China, and Japan – and their inability to eat high quantities of food has hitherto protected Thais, Chinese, Japanese, Filipinos, and Indonesians from diabetes.

However, once those rice eaters become office workers and learn how to spice their rice with more varied flavors, the deadly nature of rice may be revealed.

Stephan Guyenet writes that “Food Reward [is] Approaching a Scientific Consensus.” It certainly seems so; it is emerging as a catch-all explanation for everything, a perspective that can be trotted out in a few concluding sentences to reconcile a hypothesis (white rice causes diabetes) with data that contradict it.

Conclusion

To me, the HSPH white rice study doesn’t look like science. It looks like gaming of the grant process – generating surprising and disturbing results that seem to warrant further study, even if the researchers themselves know the results are most likely false.

Consensus or no – and consensus in science isn’t necessarily a sign of truth (hat tip: FrankG) – the food reward perspective seems to me an incomplete explanation for what is going on. It puts a lot of weight on a transition from highly palatable (Thai, Japanese, Chinese) food to “hyperpalatable” (American, junk) food as an explanation for obesity and diabetes. It seems to me that the lack of nutrients and abundance of toxins in the junk food may be just as important as its “hyperpalatability.” It’s the inability of the junk food to satisfy that is the problem, not its palatability.

I’m glad that the food reward perspective may start being tested against Asian experiences. That may shed a lot of light on these issues.