Jimmy Moore is graciously continuing the conversation about safe starches with a post from Dr Ron Rosedale. For those trying to keep track, here’s how the discussion has gone:
- Jimmy’s original seminar on safe starches, featuring Paleo and low-carb luminaries.
- My main reply appeared both here and at Jimmy’s. I also wrote further on how to minimize hyperglycemic toxicity, and offered an appreciation of Dr Kurt Harris.
- Now, Dr Ron Rosedale has replied to my reply.
Today, I’ll reply to Dr Rosedale.
Dr Rosedale argues that glucose is toxic, so we should want to have less of it in our bodies; and that low-carb diets deliver less of it. He cites a lot of papers on the relationship between blood glucose levels and health, and uses blood glucose levels as a proxy for the level of glucose in the body.
Two basic matters are at issue: (1) What blood glucose level is best for health? (2) Which diet will generate those optimal blood glucose levels?
Let’s look at what the evidence shows.
What Blood Glucose Level is Best for Health?
In my main reply, I had written:
What is a dangerous level of blood glucose?
In diabetics, there seems to be no detectable health risk from glucose levels up to 140 mg/dl, but higher levels have risks. Neurons seem to be the most sensitive cells to high glucose levels, and the severity of neuropathy in diabetes is correlated with how high blood glucose rises above 140 mg/dl in response to a glucose tolerance test. [1] In people not diagnosed with diabetes, there is also some evidence for risks above 140 mg/dl. [2]
Dr Rosedale seemed to feel that this was the weakest point in my argument, and directed his fire here. My statement was a description of what the scientific literature shows, and the adjective “detectable” carries a lot of weight here. To refute my statement, you would have to find study subjects whose blood glucose never goes above 140 mg/dl, and yet show health impairments attributable to glucose.
Dr Rosedale argues there is no threshold separating safe from harmful levels of glucose, because glucose acts as a toxin at all concentrations:
I will spend a fair amount of time and show a fair number of studies to show that there is no threshold. Very simply, the higher the blood sugar rise, the more damage is done in some linear upward slope.
I emailed Ron to make sure that he really did mean there was no threshold, so that glycemic toxicity begins at 0 mg/dl. He replied:
I mean the former; that glucose will cause some damage when above 0 mg/dl … obviously a moot point and theoretical when glucose very low and incompatible with life and likely a minute amount of damage when that low. At any level of glucose compatible with life some more meaningful degree of glycation, hormonal response and genetic expression will take place. We will always want/need to repair the damage done to stay alive, but with age the repair mechanisms become damaged also. Eventually damage outdoes repair and we “age”, acquire chronic disease, and die.
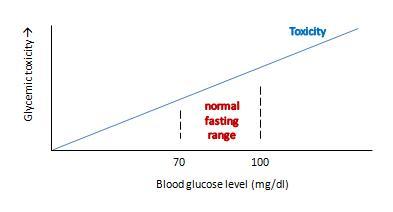
Ron’s view can be graphed like this:
This view makes sense as a matter of molecular chemistry: the number of glycation reactions may be proportional to the concentration of glucose, and if glycation products are health damaging toxins then toxicity may be proportional to glucose levels.
The trouble with this is that it doesn’t really get at what we want to know: what blood glucose level optimizes human health?
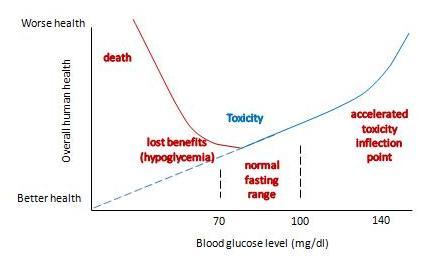
If we change the y-axis so that it doesn’t measure glycemic toxicity, but rather overall health of the human organism, then the shape of the curve is going to change in two major ways:
- First, in translating toxicity to its impact on health, we have to account for Paracelsus’s rule: “the dose makes the poison.” The body can readily repair small doses of a toxin with no ill effect – possibly even a hormetic benefit – but large doses of a toxin multiply damage exponentially and can prove fatal. So the impact of a toxin on health will not rise linearly, but non-linearly with a steeper slope as one moves to the right.
- Second, we have to account for the fact that glucose has a role as a nutrient. As Ron himself says, having too little blood glucose is “incompatible with life.” So low blood glucose – depriving us of the benefits of normal levels of this nutrient – is a catastrophic negative for health. This means that the left side of the curve needs radical adjustment.
With these two changes, our graph becomes something like this:
It now has a U-shape. I’ve drawn the inflection point where toxicity starts rising rapidly at around 140 mg/dl, and the inflection point on the other side where hypoglycemia causes substantial health damage at around 60 mg/dl. But the precise numbers don’t matter much; the point is that there is a U-shape, and somewhere in that U is a bottom where health is optimized.
What do we know about the precise shape of that U, and the location of the bottom?
We can’t intuit the shape of the bottom of the U using theoretical speculations. Theory doesn’t allow us to balance risks of hypoglycemia against toxicity on such a fine scale. The bottom of the U could be very flat, and it might not matter much whether blood glucose levels are 80 or 100 mg/dl. Or the bottom of the U could be tilted, so that the optimum is either at the low end, near 80 mg/dl, or the high end, near 100 mg/dl.
Empirical evidence is limited. Most studies relating blood glucose levels to health have been done on diabetics eating high-carb diets. There are few studies on healthy people, very few testing low-carb diets, and most are insufficiently powered to determine the precise shape of the bottom of the U.
Dr. Rosedale cites a good selection of studies in his response, and let’s review a representative subset. I was familiar with most of the studies; indeed some were cited in our book’s discussion of the dangers of hyperglycemia.
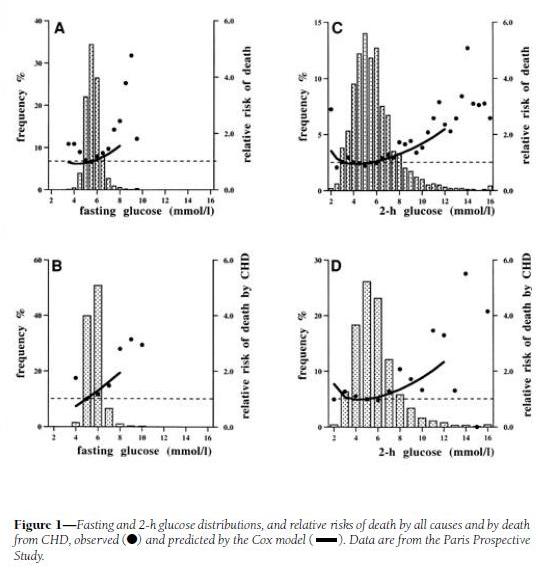
His first cite is “Is there a glycemic threshold for mortality risk?” from Diabetes Care, May 1999, http://pmid.us/10332668. Here is their data:
Look at the black dots, which are the actual data, not the fitted curves which are model-dependent; and at panels A and C, which treat all-cause mortality, not B and D, which are specific for coronary heart disease.
For both fasting and 2-h postprandial blood glucose, the black dots are lowest between about 4.5 and 6.0 mmol/l, which translates to 81 to 108 mg/dl. However, note that there is very little rise in mortality – only about 10% higher relative risk – in 2-h glucose levels of 7 mmol/l, which is 126 mg/dl. Since the postprandial peak is rarely at 2-h (45 min is a common peak), most of these people may well have been experiencing peak levels above 140 mg/dl.
My interpretation: I would say that this study demonstrates that mortality is a U-shaped function of blood glucose levels, but it doesn’t tell us the shape of the bottom of the U. It is consistent with the idea that significant health impairment occurs only with excursions of blood glucose above 140 mg/dl or below 60 mg/dl.
Dr Rosedale’s second cite is actually to a commentary: “‘Normal’ blood glucose and coronary risk” in the British Medical Journal, http://pmid.us/11141131, commenting on a paper by Khaw et al, “Glycated haemoglobin, diabetes, and mortality in men in Norfolk cohort of european prospective investigation of cancer and nutrition (EPIC-Norfolk),” http://pmid.us/11141143.
This study used glycated hemoglobin, HbA1c, which can serve as a measure of average blood glucose over the preceding ~3 weeks. Here is the data:
This supports the “blood sugar should be as low as possible” thesis, since lower HbA1c levels were associated with lower mortality. However, this study has a few flaws:
- It includes diabetics. Diabetics have poor glycemic control, and episodes of hypoglycemia as well as hyperglycemia, so HbA1c levels (which represent average blood sugar levels) may be a poor proxy for the levels of glycemic toxicity. Also, diabetics are usually on blood-glucose lowering medication, which may distort the blood sugar – mortality relationship.
- It lumps the population together in very large cohorts. Effectively there were only three cohorts, since the highest HbA1c cohort had only 2% of the sample; the other three cohorts contained 27%, 36%, and 36% of the study population respectively.
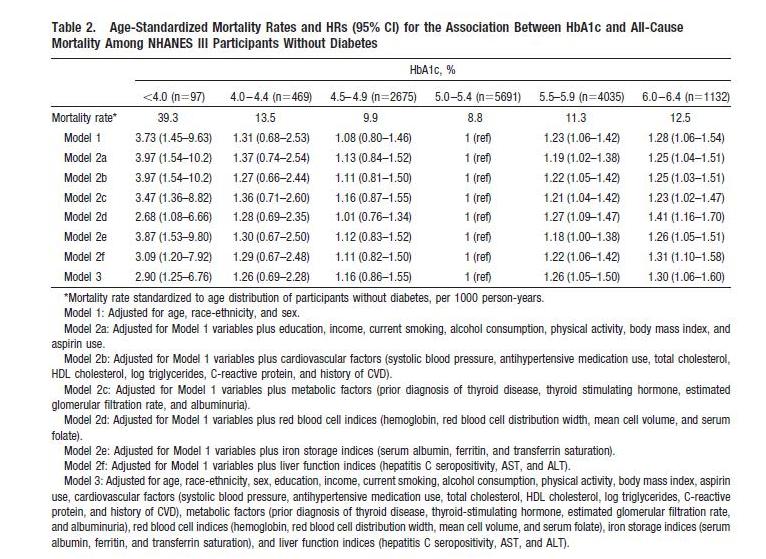
We can get a finer grip on what happens by looking at studies that lack these flaws. Here’s one: “Low hemoglobin A1c and risk of all-cause mortality among US adults without diabetes,” Circulation, 2010, http://pmid.us/20923991.
This study is an an analysis of NHANES III; it excludes diabetics and has 3 cohorts, not 1, with HbA1c below 5%. Here’s their data:
The U-shaped mortality curve is very clear. In raw data and all models, the lowest mortality is with HbA1c between 5.0 and 5.4. Mortality increases with every step down in HbA1c: in Model 1, mortality is 8% higher with HbA1c between 4.5 and 4.9, 31% higher between 4.0 and 4.4, and 273% higher below 4.0.
Via Ned Kock of Health Correlator comes a formula for translating HbA1c to average blood glucose levels:
Average blood glucose (mg/dl) = 28.7 × HbA1c – 46.7
Average blood glucose (mmol/l) = 1.59 × HbA1c – 2.59
So the minimum mortality HbA1c range of 5.0 to 5.4 translates to an average blood glucose level of 96.8 to 108.3 mg/dl (5.36 to 6.00 mmol/l).
This result is almost identical to the finding in Dr Rosedale’s first cite, from which Dr Rosedale quoted: “the lowest observed death rates were in the intervals centered on 5.5 mmol/l [99mg/dl] for fasting glucose.”
My interpretation: Once again, we find that there is a U-shaped mortality curve, and minimum mortality occurs with average or fasting blood glucose in the middle of the normal range – in the vicinity of 100 mg/dl or 5.5 mmol/l.
Let’s finish our examination of this issue with a quick look at Dr Rosedale’s third cite. That paper, “Post-challenge blood glucose concentration and stroke mortality rates in non-diabetic men in London: 38-year follow-up of the original Whitehall prospective cohort study,” Diabetologia, http://pmid.us/18438641, is a familiar one; it was cited in our book (p 36, fn 35).
This study looked at blood glucose levels 2 hours after swallowing 50 grams of glucose, and then followed the men for 38 years to observe mortality rates. CarbSane makes an important observation: this study used whole blood rather than plasma to assay blood glucose. Whole blood has more volume (due to inclusion of cells) but the same glucose, and so less glucose per deciliter. According to this paper, standard (plasma) values are about 25 mg/dl higher, so 95 mg/dl in whole blood actually corresponds to a plasma value of about 120 mg/dl.
Here is the data:
There is no significant difference in mortality among any group with post-challenge whole blood glucose up to 5.29 mmol/l (95 mg/dl), corresponding to 120 mg/dl or 6.7 mmol/l in standard measurements.
The study was designed to look at high blood glucose levels: there were 4 cohorts in the top 10% of blood glucose levels, but the bottom cohort in blood glucose had fully 31% of the sample. This cohort consisted of everyone with 2-hr whole blood glucose levels below 68 mg/dl, or plasma glucose below about 90 mg/dl. Mortality in this large group was indistinguishable from that in the next two groups, who had plasma glucose between 90 and 120 mg/dl.
My interpretation: This study wasn’t designed to observe the lower end of the U. At the higher end, it is consistent with the other studies: mortality rises with 2-hr plasma glucose above 120 mg/dl.
Summary: Optimal Blood Glucose Levels
All of the papers cited by Dr Rosedale are consistent with this story:
- Mortality and health have a U-shaped relationship with blood glucose.
- Optimum health occurs at blood glucose levels around 100 mg/dl – at normal levels, not exceptionally low levels.
- The impaired health seen with fasting or 2-hr blood glucose levels of 110 or 120 mg/dl may be largely attributable to the portion of the day in which those people experience blood glucose levels over 140 mg/dl.
I should note that Dr Rosedale acknowledges that high-normal blood glucose is better than low blood glucose for some aspects of health, like fertility:
Safe starch proponents say that raising blood glucose and raising insulin is a very natural phenomenon and needn’t be avoided. However, if we evolved in a certain way and with certain physiologic responses to the way we eat, it was not for a long, healthy, post-reproductive lifespan. It was for reproductive success. The two are not at all synonymous, in fact often antagonistic.
He’s saying that higher blood glucose favors “reproductive success,” while lower blood glucose favors “post-reproductive lifespan.” I guess one has to choose one’s priorities. Not everyone will choose maximum lifespan.
But suppose Dr Rosedale is right, and that low blood glucose levels are most desirable for at least some persons. I’m willing to stipulate, for the sake of argument, that optimal health for some persons may occur at below-normal blood glucose levels – say, 80 mg/dl. That brings us to the second issue: which diet will produce these low blood glucose levels?
Which Diet Minimizes Blood Glucose Levels?
If the key to health is achieving below-normal blood glucose levels, then low-carb diets are in trouble.
In general, very low-carb diets tend to raise fasting blood glucose and 2-hr glucose levels in response to an oral glucose tolerance test.
This is a well-known phenomenon in the low-carb community. When I ate a very low-carb diet, my fasting blood glucose was typically 104 mg/dl. Peter Dobromylskyj of Hyperlipid has reported the same effect: his fasting blood glucose is over 100 mg/dl. From one of Peter’s posts:
Back in mid summer 2007 there was this thread on the Bernstein forum. Mark, posting as iwilsmar, asked about his gradual yet progressively rising fasting blood glucose (FBG) level over a 10 year period of paleolithic LC eating. Always eating less than 30g carbohydrate per day. Initially on LC his blood glucose was 83mg/dl but it has crept up, year by year, until now his FBG is up to 115mg/dl….
I’ve been thinking about this for some time as my own FBG is usually five point something mmol/l whole blood. Converting my whole blood values to Mark’s USA plasma values, this works out at about 100-120mg/dl.
Peter notes that low-carb dieters will generally perform poorly on glucose tolerance tests, but that increasing carb intake to about 30% of calories is sufficient to produce a normal response to a glucose challenge:
The general opinion in LC circles is that you need 150g of carbohydrate per day for three days before an oral glucose tolerance test.
This is at the high end of the 20% to 30% of energy (400 to 600 calories on a 2000 calorie diet) that is the Perfect Health Diet recommendation for carbs.
The Kitavans eat more than 60% of calories as carbohydrate, mostly from starches. Their fasting blood glucose averages 3.7 mmol/l (67 mg/dl) (http://pmid.us/12817903).
Studies confirm that high-carb diets tend to lower fasting glucose and to lower the blood glucose response to a glucose challenge. CarbSane forwarded me some illustrative studies:
- “High-carbohydrate, high-fiber diets increase peripheral insulin sensitivity in healthy young and old adults,” http://pmid.us/2168124. Switching healthy adults to a higher carb diet reduced fasting blood glucose from 5.3 to 5.1 mmol/L (95.5 to 91.9 mg/dl) and reduced fasting insulin from 66 to 49.5 pmol/l.
- “Effect of high glucose and high sucrose diets on glucose tolerance of normal men,” http://pmid.us/4707966. On diets with glucose as the only carb source, 2-hr plasma glucose after a glucose challenge was 184 mg/dl on a 20% carb diet, 183 mg/dl on a 40% carb diet, 127 mg/dl on a 60% carb diet, and 116 mg/dl on an 80% carb diet. The 80% carb diet was the only one on which blood glucose never went above 140 mg/dl.
This last study did not report fasting glucose, but did track blood glucose for 4 hours after the glucose challenge. If we take the 4-hr blood glucose reading as representative of fasting glucose, we find that dieters eating 60% or 80% carb diets had fasting glucose of 76 and 68 mg/dl, respectively.
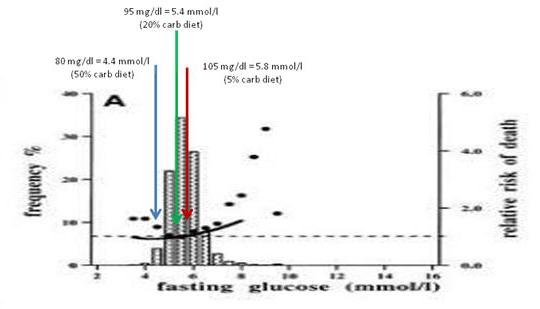
My interpretation of the evidence from multiple sources: A plausible conclusion is that a high-carb diet produces a low fasting glucose (let’s say, 80 mg/dl), a PHD type 20% carb diet an intermediate fasting glucose (95 mg/dl), and a very low-carb diet a high fasting glucose (say, 105 mg/dl).
Just for fun, I decided to see where these fasting glucose levels show up on the mortality plot from Balkau et al:
The 20% carb diet lines up pretty well with the mortality minimum, and both high-carb and very low-carb diets wind up at bins with slightly elevated mortality.
Now, I don’t believe we can infer from data on high-carb dieters what the relationship between blood glucose levels and mortality will be in low-carb dieters. It was Dr Rosedale, not me, who introduced this study into evidence.
But if we believe that lowest mortality really does occur with 2-hr post-challenge blood glucose around 100 mg/dl and fasting blood glucose below 100 mg/dl, as argued by the studies Dr Rosedale cited, and that this result applies to low-carb dieters, then I think the evidence is clear. One must eat some carbohydrates – at least 20-30% of energy.
This is the standard Perfect Health Diet recommendation. It seems that Dr Rosedale is supporting my diet, not his!
What About Diabetics?
Perhaps the boldest passage in Dr Rosedale’s reply was this:
We are all metabolically damaged to some extent. None of us has perfect insulin and leptin sensitivity…. It is for that reason that I say that we all have diabetes, some more than others, and should all be treated as such.
Well, if we all have diabetes, more or less, then I guess I have to consider whether our regular diet – which recommends about 20% of energy (400 calories) as carbs – is healthy for diabetics.
Now, before I begin this discussion, let me say that I don’t claim that this is optimal for diabetics. I think it is still an open question what the optimal diet for diabetics is, and different diabetics may experience a different optimum. I have often said that diabetics may benefit from going lower carb (and possibly higher protein) than our regular dietary recommendations. However, Dr Rosedale is here saying that even a healthy non-diabetic should eat a diet that is appropriate for diabetics. I want to see whether our regular diet meets that standard.
How do diabetics do on a 20% carb diet? Here’s some data that I found in a post by Stephan Guyenet at Whole Health Source. It’s from a 2004 study by Gannon & Nuttall (http://pmid.us/15331548) and the graph is from a later paper by Volek & Feinman (http://pmid.us/16288655/). Over a 24 hour period, blood glucose levels were tracked in Type II diabetics on their usual diets (blue and grey triangles) and after 5 weeks on a 55% carb – 15% protein – 30% fat (yellow circles) or 20% carb – 30% protein – 50% fat diet (blue circles):
The low-carb diet was a little higher in protein and lower in fat than we would recommend, but very close overall to our recommendations and spot-on in carbs.
What happened to blood glucose? It came close to non-diabetic levels. Fasting blood glucose dropped to 7 mmol/l (126 mg/dl), roughly the level at which diabetes is diagnosed. Postprandial blood glucose elevations were modest – peaking below 160 mg/dl which is about 20 mg/dl higher than in normal persons. Average daily blood glucose looks to be around 125 mg/dl.
What would have happened on a zero-carb diet? Fasting blood glucose probably would still have been elevated, near 126 mg/dl; this is common in diabetics because the loss of pancreatic beta cells creates a glucagon/insulin imbalance that leads to elevated fasting blood glucose. This blood glucose level would have been maintained throughout most of the day, with the postprandial peaks and troughs flattening. Average daily blood glucose level would have been similar to that on the 20% carb diet.
So the big benefit, in terms of glycemic control for diabetics, comes from reducing carbs from 55% to 20%. Further reductions in carb intake do not reduce average 24 hour blood glucose levels, but may reduce postprandial glucose spikes.
In fact, we have some Type II diabetics eating Perfect Health Diet style. Newell Wright reports good results:
I am a type II diabetic and a Perfect Health Diet follower, so I want to chime in with my experience….
I switched from the Atkins Induction diet to the Perfect Health Diet. I have been eating rice, potatoes, bananas, and other safe starches ever since, as well as fermented dairy products, such as plain, whole milk yogurt. I have also slowly lost another seven pounds. I enthusiastically recommend the book, Perfect Health Diet by Paul and Shou-Ching Jaminet.
Today, my fasting blood glucose reading was 105. Note that since following the Perfect Health Diet, my fasting blood glucose reading has gone down. Previously, I was suffering from the “dawn phenomenon.” My blood glucose levels overall were well below 140 one hour after a meal and 120 two hours after a meal. Only my fasting BG reading was out of whack, usually between 120 and 130, first thing in the morning.
For dinner tonight, I had a fatty pork rib, green beans, and a small baked potato with butter and sour cream. For dessert, I had a half cup of vanilla ice cream. One hour after eating, my blood glucose level was 128 and two hours after, it was 112.
So not only am I losing weight on the Perfect Health Diet, my blood glucose levels have actually improved, thanks to the increased carbs counteracting the dawn phenomenon, just as Dr. Kurt Harris (another proponent of safe starches) said it would.
So for me, as a type II diabetic, this “safe starches” exclusion is pointless…. [D]espite the type II diabetes, I am doing just fine on the Perfect Health Diet, thank you. I reject the diabetic exclusion of safe starches.
Note that Newell’s fasting blood glucose went down from 125 to 105 mg/dl when he raised his carb intake from Atkins Induction to Perfect Health Diet levels, and postprandial glucose levels on PHD were no higher than his fasting levels on Atkins Induction. It looks like he reduced blood glucose levels by adding starches to his diet.
To repeat: I’m not claiming that our regular diet, providing 20% of energy from “safe starches,” is optimal for diabetics. I don’t know what the optimal diabetes diet is, and it may be different for different diabetics. But I think there is plentiful evidence that even for diabetics, our “regular” diet is not a bad diet. And for some, it might be optimal.
Summary: Putting It All Together
It looks like 20% of energy is a sort of magic number for carbs. It:
- Averts glucose deficiency symptoms while achieving normal insulin sensitivity and glycemic control on oral glucose tolerance tests;
- Avoids significant hyperglycemic toxicity even in diabetics.
Why does this magic number, which happens to be the Perfect Health Diet recommendation for carb intake, do so well?
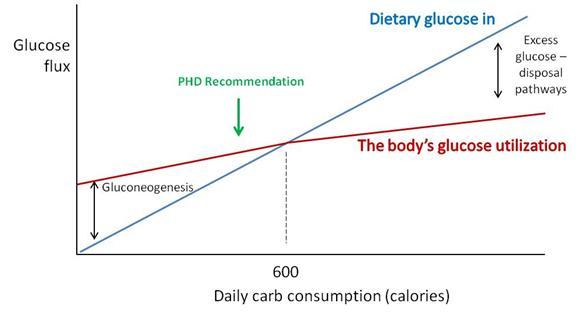
Perhaps a chart will make the science a little clearer.
“Dietary glucose in” (blue) represents the amount of carbs obtained from diet. “The body’s glucose utilization” (maroon) is how much glucose will be put to useful purposes at a given daily carb consumption. Glucose utilization does not vary as strongly as glucose intake; at low intakes a deficit is made up by gluconeogenesis (manufacture of glucose from protein) and at high intakes an excess of glucose is destroyed by thermogenesis or conversion of glucose to fat.
Where the blue and maroon lines cross, dietary glucose in matches the body’s glucose utilization. For most sedentary adults, this level will be around 600 carb calories per day. We recommend eating close to or slightly below this point (“PHD Recommendation”).
There are dangers in straying too far from this intersection point:
- Eating too few carbs creates a risk of health impairment due to insufficient glucose or protein.
- Eating too many carbs results in unnecessary exercise of glucose disposal pathways, and possible unhealthy fluctuations in blood glucose levels if those disposal pathways fail.
Hitting just below the intersection is a safe, low-stress point which will work well for most people.
For diabetics, the excess glucose disposal pathways are broken. However, this is not a major problem if you have no excess glucose to dispose of. Eating up to 20% of calories from carbs doesn’t require the use of disposal pathways – glucose can be stored as glycogen and then released as needed, so the effect of dietary glucose is primarily to reduce the amount of gluconeogenesis. Suppressing gluconeogenesis requires some residual insulin secretion ability, so Type I diabetics cannot achieve this, but most Type IIs can.
The upshot: A 20% carb diet meets the body’s glucose needs without much risk of hyperglycemic toxicity even in diabetics.
The Issue of Thyroid Hormones and Anti-Aging
The most distinctive element of Dr. Rosedale’s diet is its emphasis on longevity as the supreme measure of health, and its emphasis on calorie restriction (especially, carb and protein restriction) and metabolic suppression as the means to long life.
Our book, Perfect Health Diet, relied strongly on evidence from evolutionary selection to guide us toward the optimal diet.
Dr. Rosedale rejects evolutionary selection as a helpful criterion, since evolution did not necessarily select for longevity:
[I]f we evolved in a certain way and with certain physiologic responses to the way we eat, it was not for a long, healthy, post-reproductive lifespan. It was for reproductive success. The two are not at all synonymous, in fact often antagonistic. We have no footsteps to follow as far as the best way to eat for long healthy post reproductive life. We can only use the best science pertaining to the biology of aging and apply it to proper nutrition. That is what I feel I am doing.
We actually share much of Dr Rosedale’s perspective on what influences longevity; it is for longevity that we recommend slightly under-eating carb and protein compared to what evolution selects for. However, we don’t go as far in that direction as Dr Rosedale does.
We have written of the suppression of T3 thyroid hormone levels which is part of the body’s strategy for conserving glucose in times of scarcity, and how this is a risk factor for “euthyroid sick syndrome.” See Carbohydrates and the Thyroid, Aug 24, 2011.
Dr Rosedale acknowledges this and believes it to be beneficial:
I believe that Jaminet and most others misunderstand the physiologic response to low glucose, and the true meaning of low thyroid. Glucose scarcity (deficiency may be a misnomer) elicits an evolutionary response to perceived low fuel availability. This results in a shift in genetic expression to allow that organism to better survive the perceived famine…. As part of this genetic expression, and as part and parcel of nature’s mechanism to allow the maintenance of health and actually reduce the rate of aging, certain events will take place as seen in caloric restricted animals. These include a reduction in serum glucose, insulin, leptin, and free T3.
The reduction in free T3 is of great benefit, reducing temperature, metabolic damage and decreasing catabolism…. We are not talking about a hypothyroid condition. It is a purposeful reduction in thyroid activity to elicit health. Yes, reverse T3 is increased, as this is a normal, healthy, physiologic mechanism to reduce thyroid activity.
Note that Dr Rosedale acknowledges that his glucose-scarce diet reduces body temperature. Many Rosedale dieters have had this experience. Darrin didn’t like it:
This comment from Rosedale support may be of interest to you;
“The best place to measure is under the tongue. Ideal basal temperature is what you have when you first wake up in the morning, and on the Rosedale diet should be upper 96’s lower 97’s. We have found that when someone starts our diet, their basal temperature will go down about 1-2 degrees Fahrenheit which is a great improvement”.
Personally, i did not feel good on a lower body temp when i was low carb (sub 50g) & have been working hard (following phd diet & supps) to get my body temp back up. i would say my basal/morning oral temp is now around the 97.5F on average (up from around 96.5F average pre PHD).
Low body temperatures are associated with a variety of negative health outcomes. For instance, low body temperature is immunosuppressive, leads to poor outcomes in infections, and is a significant independent predictor for death in medical patients. Fever is curative for most infections, low body temperature is a risk factor for infections. Readers of our book know that we think infections are a major factor in aging and premature death. Whether a diet so restricted in carbs that it significantly lowers body temperature is really optimal for longevity is, I think, open to question.
There is a plausible case to be made for the Rosedale diet as a diet that sacrifices certain aspects of current health in the hope of extending lifespan. It cannot however claim to be the optimal diet for everyone. It is certainly not optimized for fertility, athleticism, or immunity against infections.
Conclusion
I am sympathetic to the broad perspective that underlies Dr Rosedale’s diet. Both our diets are low-carb, low-protein, and high-fat, and studies of longevity are the biggest factor motivating the recommendation to eat a fat-rich diet.
However, Dr Rosedale takes low-carb and low-protein dieting to an extreme that I think is not well supported by the evidence.
Dr Rosedale’s direct attempt at refuting our diet consists mainly of two claims:
- Lower blood glucose is better than higher blood glucose.
- The way to lower blood glucose is by eating fewer carbs.
Neither claim is supported. Mortality is a U-shaped function of blood glucose and blood glucose levels around 90 to 100 mg/dl are healthiest, not low blood glucose levels. Moreover, the diet that delivers the lowest blood glucose levels is a high-carb, insulin-sensitizing diet, such as the Kitavans eat, not a low-carb diet.
If I truly believed Dr Rosedale’s argument for lower blood glucose, he would have persuaded me to eat a high-carb Kitavan-style diet. However, I am not persuaded.
I believe that:
- Optimal blood glucose levels are in the 90 to 100 mg/dl range. High-carb diets cause below-optimal levels of blood glucose, especially during fasts. (Indeed, high-carb dieters routinely experience hunger and irritability during long fasts.) Very low-carb diets cause elevated blood glucose due to the body’s efforts to conserve glucose by suppressing utilization. Excessive suppression of glucose utilization is unhealthy.
- A 20% carb diet, while not optimal for every single person, is healthy for nearly everyone. Twenty percent may be the best single prediction of the optimal carb intake for the population as a whole. Even diabetics can do well eating 20% carbs.
And that is why we recommend moderate consumption of safe starches.









Recent Comments