Category Archives: Biomarkers

Safe Starches Symposium: Dr Ron Rosedale

Jimmy Moore is graciously continuing the conversation about safe starches with a post from Dr Ron Rosedale. For those trying to keep track, here’s how the discussion has gone:

Today, I’ll reply to Dr Rosedale.

Dr Rosedale argues that glucose is toxic, so we should want to have less of it in our bodies; and that low-carb diets deliver less of it. He cites a lot of papers on the relationship between blood glucose levels and health, and uses blood glucose levels as a proxy for the level of glucose in the body.

Two basic matters are at issue: (1) What blood glucose level is best for health? (2) Which diet will generate those optimal blood glucose levels?

Let’s look at what the evidence shows.

What Blood Glucose Level is Best for Health?

In my main reply, I had written:

What is a dangerous level of blood glucose?

In diabetics, there seems to be no detectable health risk from glucose levels up to 140 mg/dl, but higher levels have risks. Neurons seem to be the most sensitive cells to high glucose levels, and the severity of neuropathy in diabetes is correlated with how high blood glucose rises above 140 mg/dl in response to a glucose tolerance test. [1] In people not diagnosed with diabetes, there is also some evidence for risks above 140 mg/dl. [2]

Dr Rosedale seemed to feel that this was the weakest point in my argument, and directed his fire here. My statement was a description of what the scientific literature shows, and the adjective “detectable” carries a lot of weight here. To refute my statement, you would have to find study subjects whose blood glucose never goes above 140 mg/dl, and yet show health impairments attributable to glucose.

Dr Rosedale argues there is no threshold separating safe from harmful levels of glucose, because glucose acts as a toxin at all concentrations:

I will spend a fair amount of time and show a fair number of studies to show that there is no threshold. Very simply, the higher the blood sugar rise, the more damage is done in some linear upward slope.

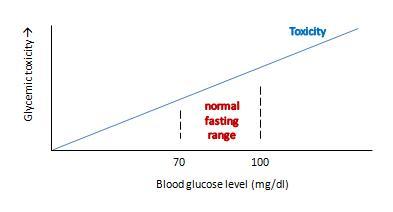
I emailed Ron to make sure that he really did mean there was no threshold, so that glycemic toxicity begins at 0 mg/dl. He replied:

I mean the former; that glucose will cause some damage when above 0 mg/dl … obviously a moot point and theoretical when glucose very low and incompatible with life and likely a minute amount of damage when that low.  At any level of glucose compatible with life some more meaningful degree of glycation, hormonal response and genetic expression will take place.   We will always want/need to repair the damage done to stay alive, but with age the repair mechanisms become damaged also.  Eventually damage outdoes repair and we “age”, acquire chronic disease, and die.

Ron’s view can be graphed like this:

This view makes sense as a matter of molecular chemistry: the number of glycation reactions may be proportional to the concentration of glucose, and if glycation products are health damaging toxins then toxicity may be proportional to glucose levels.

The trouble with this is that it doesn’t really get at what we want to know: what blood glucose level optimizes human health?

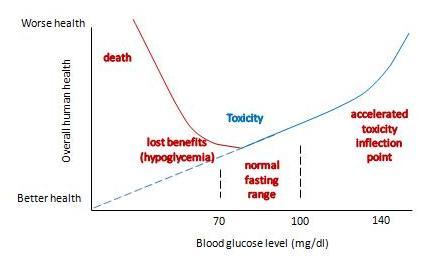
If we change the y-axis so that it doesn’t measure glycemic toxicity, but rather overall health of the human organism, then the shape of the curve is going to change in two major ways:

  • First, in translating toxicity to its impact on health, we have to account for Paracelsus’s rule: “the dose makes the poison.” The body can readily repair small doses of a toxin with no ill effect – possibly even a hormetic benefit – but large doses of a toxin multiply damage exponentially and can prove fatal. So the impact of a toxin on health will not rise linearly, but non-linearly with a steeper slope as one moves to the right.
  • Second, we have to account for the fact that glucose has a role as a nutrient. As Ron himself says, having too little blood glucose is “incompatible with life.” So low blood glucose – depriving us of the benefits of normal levels of this nutrient – is a catastrophic negative for health. This means that the left side of the curve needs radical adjustment.

With these two changes, our graph becomes something like this:

It now has a U-shape. I’ve drawn the inflection point where toxicity starts rising rapidly at around 140 mg/dl, and the inflection point on the other side where hypoglycemia causes substantial health damage at around 60 mg/dl. But the precise numbers don’t matter much; the point is that there is a U-shape, and somewhere in that U is a bottom where health is optimized.

What do we know about the precise shape of that U, and the location of the bottom?

We can’t intuit the shape of the bottom of the U using theoretical speculations. Theory doesn’t allow us to balance risks of hypoglycemia against toxicity on such a fine scale. The bottom of the U could be very flat, and it might not matter much whether blood glucose levels are 80 or 100 mg/dl. Or the bottom of the U could be tilted, so that the optimum is either at the low end, near 80 mg/dl, or the high end, near 100 mg/dl.

Empirical evidence is limited. Most studies relating blood glucose levels to health have been done on diabetics eating high-carb diets. There are few studies on healthy people, very few testing low-carb diets, and most are insufficiently powered to determine the precise shape of the bottom of the U.

Dr. Rosedale cites a good selection of studies in his response, and let’s review a representative subset. I was familiar with most of the studies; indeed some were cited in our book’s discussion of the dangers of hyperglycemia.

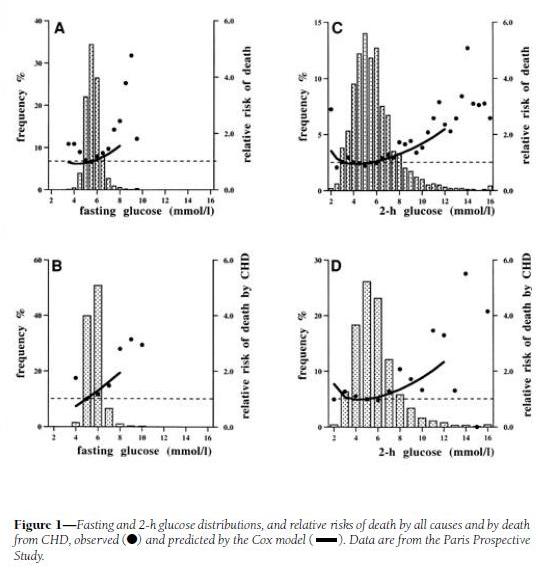
His first cite is “Is there a glycemic threshold for mortality risk?” from Diabetes Care, May 1999, http://pmid.us/10332668. Here is their data:

Look at the black dots, which are the actual data, not the fitted curves which are model-dependent; and at panels A and C, which treat all-cause mortality, not B and D, which are specific for coronary heart disease.

For both fasting and 2-h postprandial blood glucose, the black dots are lowest between about 4.5 and 6.0 mmol/l, which translates to 81 to 108 mg/dl. However, note that there is very little rise in mortality – only about 10% higher relative risk – in 2-h glucose levels of 7 mmol/l, which is 126 mg/dl. Since the postprandial peak is rarely at 2-h (45 min is a common peak), most of these people may well have been experiencing peak levels above 140 mg/dl.

My interpretation: I would say that this study demonstrates that mortality is a U-shaped function of blood glucose levels, but it doesn’t tell us the shape of the bottom of the U. It is consistent with the idea that significant health impairment occurs only with excursions of blood glucose above 140 mg/dl or below 60 mg/dl.

Dr Rosedale’s second cite is actually to a commentary: “‘Normal’ blood glucose and coronary risk” in the British Medical Journal, http://pmid.us/11141131, commenting on a paper by Khaw et al, “Glycated haemoglobin, diabetes, and mortality in men in Norfolk cohort of european prospective investigation of cancer and nutrition (EPIC-Norfolk),” http://pmid.us/11141143.

This study used glycated hemoglobin, HbA1c, which can serve as a measure of average blood glucose over the preceding ~3 weeks. Here is the data:

This supports the “blood sugar should be as low as possible” thesis, since lower HbA1c levels were associated with lower mortality. However, this study has a few flaws:

  • It includes diabetics. Diabetics have poor glycemic control, and episodes of hypoglycemia as well as hyperglycemia, so HbA1c levels (which represent average blood sugar levels) may be a poor proxy for the levels of glycemic toxicity. Also, diabetics are usually on blood-glucose lowering medication, which may distort the blood sugar – mortality relationship.
  • It lumps the population together in very large cohorts. Effectively there were only three cohorts, since the highest HbA1c cohort had only 2% of the sample; the other three cohorts contained 27%, 36%, and 36% of the study population respectively.

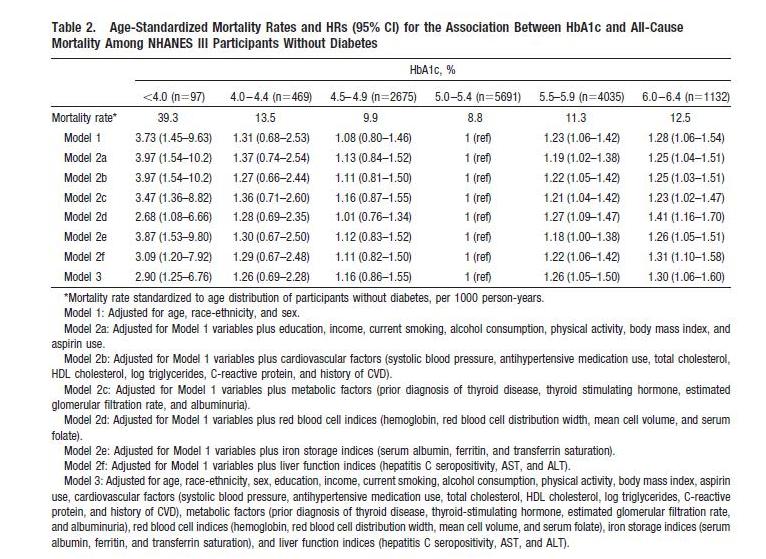
We can get a finer grip on what happens by looking at studies that lack these flaws. Here’s one: “Low hemoglobin A1c and risk of all-cause mortality among US adults without diabetes,” Circulation, 2010, http://pmid.us/20923991.

This study is an an analysis of NHANES III; it excludes diabetics and has 3 cohorts, not 1, with HbA1c below 5%. Here’s their data:

The U-shaped mortality curve is very clear. In raw data and all models, the lowest mortality is with HbA1c between 5.0 and 5.4. Mortality increases with every step down in HbA1c: in Model 1, mortality is 8% higher with HbA1c between 4.5 and 4.9, 31% higher between 4.0 and 4.4, and 273% higher below 4.0.

Via Ned Kock of Health Correlator comes a formula for translating HbA1c to average blood glucose levels:

Average blood glucose (mg/dl) = 28.7 × HbA1c – 46.7

Average blood glucose (mmol/l) = 1.59 × HbA1c – 2.59

So the minimum mortality HbA1c range of 5.0 to 5.4 translates to an average blood glucose level of 96.8 to 108.3 mg/dl (5.36 to 6.00 mmol/l).

This result is almost identical to the finding in Dr Rosedale’s first cite, from which Dr Rosedale quoted: “the lowest observed death rates were in the intervals centered on 5.5 mmol/l [99mg/dl] for fasting glucose.”

My interpretation:  Once again, we find that there is a U-shaped mortality curve, and minimum mortality occurs with average or fasting blood glucose in the middle of the normal range – in the vicinity of 100 mg/dl or 5.5 mmol/l.

Let’s finish our examination of this issue with a quick look at Dr Rosedale’s third cite. That paper, “Post-challenge blood glucose concentration and stroke mortality rates in non-diabetic men in London: 38-year follow-up of the original Whitehall prospective cohort study,” Diabetologia, http://pmid.us/18438641, is a familiar one; it was cited in our book (p 36, fn 35).

This study looked at blood glucose levels 2 hours after swallowing 50 grams of glucose, and then followed the men for 38 years to observe mortality rates. CarbSane makes an important observation: this study used whole blood rather than plasma to assay blood glucose. Whole blood has more volume (due to inclusion of cells) but the same glucose, and so less glucose per deciliter. According to this paper, standard (plasma) values are about 25 mg/dl higher, so 95 mg/dl in whole blood actually corresponds to a plasma value of about 120 mg/dl.

Here is the data:

There is no significant difference in mortality among any group with post-challenge whole blood glucose up to 5.29 mmol/l (95 mg/dl), corresponding to 120 mg/dl or 6.7 mmol/l in standard measurements.

The study was designed to look at high blood glucose levels: there were 4 cohorts in the top 10% of blood glucose levels, but the bottom cohort in blood glucose had fully 31% of the sample. This cohort consisted of everyone with 2-hr whole blood glucose levels below 68 mg/dl, or plasma glucose below about 90 mg/dl. Mortality in this large group was indistinguishable from that in the next two groups, who had plasma glucose between 90 and 120 mg/dl.

My interpretation: This study wasn’t designed to observe the lower end of the U. At the higher end, it is consistent with the other studies: mortality rises with 2-hr plasma glucose above 120 mg/dl.

Summary: Optimal Blood Glucose Levels

All of the papers cited by Dr Rosedale are consistent with this story:

  1. Mortality and health have a U-shaped relationship with blood glucose.
  2. Optimum health occurs at blood glucose levels around 100 mg/dl – at normal levels, not exceptionally low levels.
  3. The impaired health seen with fasting or 2-hr blood glucose levels of 110 or 120 mg/dl may be largely attributable to the portion of the day in which those people experience blood glucose levels over 140 mg/dl.

I should note that Dr Rosedale acknowledges that high-normal blood glucose is better than low blood glucose for some aspects of health, like fertility:

Safe starch proponents say that raising blood glucose and raising insulin is a very natural phenomenon and needn’t be avoided. However, if we evolved in a certain way and with certain physiologic responses to the way we eat, it was not for a long, healthy, post-reproductive lifespan. It was for reproductive success. The two are not at all synonymous, in fact often antagonistic.

He’s saying that higher blood glucose favors “reproductive success,” while lower blood glucose favors “post-reproductive lifespan.” I guess one has to choose one’s priorities. Not everyone will choose maximum lifespan.

But suppose Dr Rosedale is right, and that low blood glucose levels are most desirable for at least some persons. I’m willing to stipulate, for the sake of argument, that optimal health for some persons may occur at below-normal blood glucose levels – say, 80 mg/dl. That brings us to the second issue: which diet will produce these low blood glucose levels?

Which Diet Minimizes Blood Glucose Levels?

If the key to health is achieving below-normal blood glucose levels, then low-carb diets are in trouble.

In general, very low-carb diets tend to raise fasting blood glucose and 2-hr glucose levels in response to an oral glucose tolerance test.

This is a well-known phenomenon in the low-carb community. When I ate a very low-carb diet, my fasting blood glucose was typically 104 mg/dl. Peter Dobromylskyj of Hyperlipid has reported the same effect: his fasting blood glucose is over 100 mg/dl. From one of Peter’s posts:

Back in mid summer 2007 there was this thread on the Bernstein forum. Mark, posting as iwilsmar, asked about his gradual yet progressively rising fasting blood glucose (FBG) level over a 10 year period of paleolithic LC eating. Always eating less than 30g carbohydrate per day. Initially on LC his blood glucose was 83mg/dl but it has crept up, year by year, until now his FBG is up to 115mg/dl….

I’ve been thinking about this for some time as my own FBG is usually five point something mmol/l whole blood. Converting my whole blood values to Mark’s USA plasma values, this works out at about 100-120mg/dl.

Peter notes that low-carb dieters will generally perform poorly on glucose tolerance tests, but that increasing carb intake to about 30% of calories is sufficient to produce a normal response to a glucose challenge:

The general opinion in LC circles is that you need 150g of carbohydrate per day for three days before an oral glucose tolerance test.

This is at the high end of the 20% to 30% of energy (400 to 600 calories on a 2000 calorie diet) that is the Perfect Health Diet recommendation for carbs.

The Kitavans eat more than 60% of calories as carbohydrate, mostly from starches. Their fasting blood glucose averages 3.7 mmol/l (67 mg/dl) (http://pmid.us/12817903).

Studies confirm that high-carb diets tend to lower fasting glucose and to lower the blood glucose response to a glucose challenge. CarbSane forwarded me some illustrative studies:

  • “High-carbohydrate, high-fiber diets increase peripheral insulin sensitivity in healthy young and old adults,” http://pmid.us/2168124. Switching healthy adults to a higher carb diet reduced fasting blood glucose from 5.3 to 5.1 mmol/L (95.5 to 91.9 mg/dl) and reduced fasting insulin from 66 to 49.5 pmol/l.
  • “Effect of high glucose and high sucrose diets on glucose tolerance of normal men,” http://pmid.us/4707966. On diets with glucose as the only carb source, 2-hr plasma glucose after a glucose challenge was 184 mg/dl on a 20% carb diet, 183 mg/dl on a 40% carb diet, 127 mg/dl on a 60% carb diet, and 116 mg/dl on an 80% carb diet. The 80% carb diet was the only one on which blood glucose never went above 140 mg/dl.

This last study did not report fasting glucose, but did track blood glucose for 4 hours after the glucose challenge. If we take the 4-hr blood glucose reading as representative of fasting glucose, we find that dieters eating 60% or 80% carb diets had fasting glucose of 76 and 68 mg/dl, respectively.

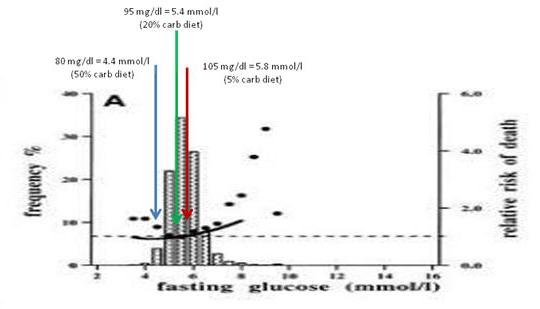
My interpretation of the evidence from multiple sources: A plausible conclusion is that a high-carb diet produces a low fasting glucose (let’s say, 80 mg/dl), a PHD type 20% carb diet an intermediate fasting glucose (95 mg/dl), and a very low-carb diet a high fasting glucose (say, 105 mg/dl).

Just for fun, I decided to see where these fasting glucose levels show up on the mortality plot from Balkau et al:

The 20% carb diet lines up pretty well with the mortality minimum, and both high-carb and very low-carb diets wind up at bins with slightly elevated mortality.

Now, I don’t believe we can infer from data on high-carb dieters what the relationship between blood glucose levels and mortality will be in low-carb dieters. It was Dr Rosedale, not me, who introduced this study into evidence.

But if we believe that lowest mortality really does occur with 2-hr post-challenge blood glucose around 100 mg/dl and fasting blood glucose below 100 mg/dl, as argued by the studies Dr Rosedale cited, and that this result applies to low-carb dieters, then I think the evidence is clear. One must eat some carbohydrates – at least 20-30% of energy.

This is the standard Perfect Health Diet recommendation. It seems that Dr Rosedale is supporting my diet, not his!

What About Diabetics?

Perhaps the boldest passage in Dr Rosedale’s reply was this:

We are all metabolically damaged to some extent. None of us has perfect insulin and leptin sensitivity….  It is for that reason that I say that we all have diabetes, some more than others, and should all be treated as such.

Well, if we all have diabetes, more or less, then I guess I have to consider whether our regular diet – which recommends about 20% of energy (400 calories) as carbs – is healthy for diabetics.

Now, before I begin this discussion, let me say that I don’t claim that this is optimal for diabetics. I think it is still an open question what the optimal diet for diabetics is, and different diabetics may experience a different optimum. I have often said that diabetics may benefit from going lower carb (and possibly higher protein) than our regular dietary recommendations. However, Dr Rosedale is here saying that even a healthy non-diabetic should eat a diet that is appropriate for diabetics. I want to see whether our regular diet meets that standard.

How do diabetics do on a 20% carb diet? Here’s some data that I found in a post by Stephan Guyenet at Whole Health Source. It’s from a 2004 study by Gannon & Nuttall (http://pmid.us/15331548) and the graph is from a later paper by Volek & Feinman (http://pmid.us/16288655/). Over a 24 hour period, blood glucose levels were tracked in Type II diabetics on their usual diets (blue and grey triangles) and after 5 weeks on a 55% carb – 15% protein – 30% fat (yellow circles) or 20% carb – 30% protein – 50% fat diet (blue circles):

The low-carb diet was a little higher in protein and lower in fat than we would recommend, but very close overall to our recommendations and spot-on in carbs.

What happened to blood glucose? It came close to non-diabetic levels. Fasting blood glucose dropped to 7 mmol/l (126 mg/dl), roughly the level at which diabetes is diagnosed. Postprandial blood glucose elevations were modest – peaking below 160 mg/dl which is about 20 mg/dl higher than in normal persons. Average daily blood glucose looks to be around 125 mg/dl.

What would have happened on a zero-carb diet? Fasting blood glucose probably would still have been elevated, near 126 mg/dl; this is common in diabetics because the loss of pancreatic beta cells creates a glucagon/insulin imbalance that leads to elevated fasting blood glucose. This blood glucose level would have been maintained throughout most of the day, with the postprandial peaks and troughs flattening. Average daily blood glucose level would have been similar to that on the 20% carb diet.

So the big benefit, in terms of glycemic control for diabetics, comes from reducing carbs from 55% to 20%. Further reductions in carb intake do not reduce average 24 hour blood glucose levels, but may reduce postprandial glucose spikes.

In fact, we have some Type II diabetics eating Perfect Health Diet style. Newell Wright reports good results:

I am a type II diabetic and a Perfect Health Diet follower, so I want to chime in with my experience….

I switched from the Atkins Induction diet to the Perfect Health Diet. I have been eating rice, potatoes, bananas, and other safe starches ever since, as well as fermented dairy products, such as plain, whole milk yogurt. I have also slowly lost another seven pounds. I enthusiastically recommend the book, Perfect Health Diet by Paul and Shou-Ching Jaminet.

Today, my fasting blood glucose reading was 105. Note that since following the Perfect Health Diet, my fasting blood glucose reading has gone down. Previously, I was suffering from the “dawn phenomenon.” My blood glucose levels overall were well below 140 one hour after a meal and 120 two hours after a meal. Only my fasting BG reading was out of whack, usually between 120 and 130, first thing in the morning.

For dinner tonight, I had a fatty pork rib, green beans, and a small baked potato with butter and sour cream. For dessert, I had a half cup of vanilla ice cream. One hour after eating, my blood glucose level was 128 and two hours after, it was 112.

So not only am I losing weight on the Perfect Health Diet, my blood glucose levels have actually improved, thanks to the increased carbs counteracting the dawn phenomenon, just as Dr. Kurt Harris (another proponent of safe starches) said it would.

So for me, as a type II diabetic, this “safe starches” exclusion is pointless…. [D]espite the type II diabetes, I am doing just fine on the Perfect Health Diet, thank you. I reject the diabetic exclusion of safe starches.

Note that Newell’s fasting blood glucose went down from 125 to 105 mg/dl when he raised his carb intake from Atkins Induction to Perfect Health Diet levels, and postprandial glucose levels on PHD were no higher than his fasting levels on Atkins Induction. It looks like he reduced blood glucose levels by adding starches to his diet.

To repeat: I’m not claiming that our regular diet, providing 20% of energy from “safe starches,” is optimal for diabetics. I don’t know what the optimal diabetes diet is, and it may be different for different diabetics. But I think there is plentiful evidence that even for diabetics, our “regular” diet is not a bad diet. And for some, it might be optimal.

Summary: Putting It All Together

It looks like 20% of energy is a sort of magic number for carbs. It:

  • Averts glucose deficiency symptoms while achieving normal insulin sensitivity and glycemic control on oral glucose tolerance tests;
  • Avoids significant hyperglycemic toxicity even in diabetics.

Why does this magic number, which happens to be the Perfect Health Diet recommendation for carb intake, do so well?

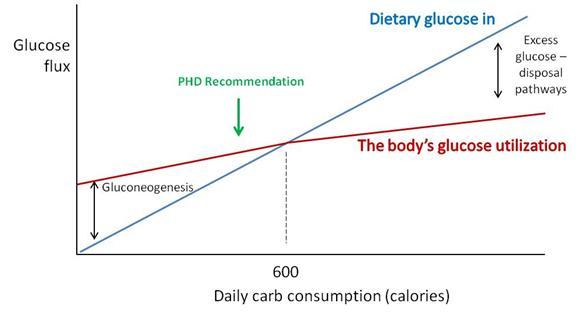
Perhaps a chart will make the science a little clearer.

“Dietary glucose in” (blue) represents the amount of carbs obtained from diet. “The body’s glucose utilization” (maroon) is how much glucose will be put to useful purposes at a given daily carb consumption. Glucose utilization does not vary as strongly as glucose intake; at low intakes a deficit is made up by gluconeogenesis (manufacture of glucose from protein) and at high intakes an excess of glucose is destroyed by thermogenesis or conversion of glucose to fat.

Where the blue and maroon lines cross, dietary glucose in matches the body’s glucose utilization. For most sedentary adults, this level will be around 600 carb calories per day. We recommend eating close to or slightly below this point (“PHD Recommendation”).

There are dangers in straying too far from this intersection point:

  • Eating too few carbs creates a risk of health impairment due to insufficient glucose or protein.
  • Eating too many carbs results in unnecessary exercise of glucose disposal pathways, and possible unhealthy fluctuations in blood glucose levels if those disposal pathways fail.

Hitting just below the intersection is a safe, low-stress point which will work well for most people.

For diabetics, the excess glucose disposal pathways are broken. However, this is not a major problem if you have no excess glucose to dispose of. Eating up to 20% of calories from carbs doesn’t require the use of disposal pathways – glucose can be stored as glycogen and then released as needed, so the effect of dietary glucose is primarily to reduce the amount of gluconeogenesis. Suppressing gluconeogenesis requires some residual insulin secretion ability, so Type I diabetics cannot achieve this, but most Type IIs can.

The upshot: A 20% carb diet meets the body’s glucose needs without much risk of hyperglycemic toxicity even in diabetics.

The Issue of Thyroid Hormones and Anti-Aging

The most distinctive element of Dr. Rosedale’s diet is its emphasis on longevity as the supreme measure of health, and its emphasis on calorie restriction (especially, carb and protein restriction) and metabolic suppression as the means to long life.

Our book, Perfect Health Diet, relied strongly on evidence from evolutionary selection to guide us toward the optimal diet.

Dr. Rosedale rejects evolutionary selection as a helpful criterion, since evolution did not necessarily select for longevity:

[I]f we evolved in a certain way and with certain physiologic responses to the way we eat, it was not for a long, healthy, post-reproductive lifespan. It was for reproductive success. The two are not at all synonymous, in fact often antagonistic. We have no footsteps to follow as far as the best way to eat for long healthy post reproductive life. We can only use the best science pertaining to the biology of aging and apply it to proper nutrition. That is what I feel I am doing.

We actually share much of Dr Rosedale’s perspective on what influences longevity; it is for longevity that we recommend slightly under-eating carb and protein compared to what evolution selects for. However, we don’t go as far in that direction as Dr Rosedale does.

We have written of the suppression of T3 thyroid hormone levels which is part of the body’s strategy for conserving glucose in times of scarcity, and how this is a risk factor for “euthyroid sick syndrome.” See Carbohydrates and the Thyroid, Aug 24, 2011.

Dr Rosedale acknowledges this and believes it to be beneficial:

I believe that Jaminet and most others misunderstand the physiologic response to low glucose, and the true meaning of low thyroid. Glucose scarcity (deficiency may be a misnomer) elicits an evolutionary response to perceived low fuel availability. This results in a shift in genetic expression to allow that organism to better survive the perceived famine…. As part of this genetic expression, and as part and parcel of nature’s mechanism to allow the maintenance of health and actually reduce the rate of aging, certain events will take place as seen in caloric restricted animals. These include a reduction in serum glucose, insulin, leptin, and free T3.

The reduction in free T3 is of great benefit, reducing temperature, metabolic damage and decreasing catabolism…. We are not talking about a hypothyroid condition. It is a purposeful reduction in thyroid activity to elicit health. Yes, reverse T3 is increased, as this is a normal, healthy, physiologic mechanism to reduce thyroid activity.

Note that Dr Rosedale acknowledges that his glucose-scarce diet reduces body temperature. Many Rosedale dieters have had this experience. Darrin didn’t like it:

This comment from Rosedale support may be of interest to you;

“The best place to measure is under the tongue. Ideal basal temperature is what you have when you first wake up in the morning, and on the Rosedale diet should be upper 96’s lower 97’s. We have found that when someone starts our diet, their basal temperature will go down about 1-2 degrees Fahrenheit which is a great improvement”.

Personally, i did not feel good on a lower body temp when i was low carb (sub 50g) & have been working hard (following phd diet & supps) to get my body temp back up. i would say my basal/morning oral temp is now around the 97.5F on average (up from around 96.5F average pre PHD).

Low body temperatures are associated with a variety of negative health outcomes. For instance, low body temperature is immunosuppressive, leads to poor outcomes in infections, and is a significant independent predictor for death in medical patients. Fever is curative for most infections, low body temperature is a risk factor for infections. Readers of our book know that we think infections are a major factor in aging and premature death. Whether a diet so restricted in carbs that it significantly lowers body temperature is really optimal for longevity is, I think, open to question.

There is a plausible case to be made for the Rosedale diet as a diet that sacrifices certain aspects of current health in the hope of extending lifespan. It cannot however claim to be the optimal diet for everyone. It is certainly not optimized for fertility, athleticism, or immunity against infections.

Conclusion

I am sympathetic to the broad perspective that underlies Dr Rosedale’s diet. Both our diets are low-carb, low-protein, and high-fat, and studies of longevity are the biggest factor motivating the recommendation to eat a fat-rich diet.

However, Dr Rosedale takes low-carb and low-protein dieting to an extreme that I think is not well supported by the evidence.

Dr Rosedale’s direct attempt at refuting our diet consists mainly of two claims:

  • Lower blood glucose is better than higher blood glucose.
  • The way to lower blood glucose is by eating fewer carbs.

Neither claim is supported. Mortality is a U-shaped function of blood glucose and blood glucose levels around 90 to 100 mg/dl are healthiest, not low blood glucose levels. Moreover, the diet that delivers the lowest blood glucose levels is a high-carb, insulin-sensitizing diet, such as the Kitavans eat, not a low-carb diet.

If I truly believed Dr Rosedale’s argument for lower blood glucose, he would have persuaded me to eat a high-carb Kitavan-style diet. However, I am not persuaded.

I believe that:

  • Optimal blood glucose levels are in the 90 to 100 mg/dl range. High-carb diets cause below-optimal levels of blood glucose, especially during fasts. (Indeed, high-carb dieters routinely experience hunger and irritability during long fasts.) Very low-carb diets cause elevated blood glucose due to the body’s efforts to conserve glucose by suppressing utilization. Excessive suppression of glucose utilization is unhealthy.
  • A 20% carb diet, while not optimal for every single person, is healthy for nearly everyone. Twenty percent may be the best single prediction of the optimal carb intake for the population as a whole. Even diabetics can do well eating 20% carbs.

And that is why we recommend moderate consumption of safe starches.

High LDL on Paleo Revisited: Low Carb & the Thyroid

One of the more mysterious conditions afflicting low-carb Paleo dieters has been high serum cholesterol. Two of our most popular posts were about this problem: Low Carb Paleo, and LDL is Soaring – Help! (Mar 2, 2011) enumerated some cases and asked readers to suggest answers; Answer Day: What Causes High LDL on Low-Carb Paleo? (Mar 4, 2011) suggested one possible remedy.

On the first post, one of the causes suggested by readers was hypothyroidism – an astute answer. Raj Ganpath wrote:

Weight loss (and VLC diet) resulting in hypothyroidism resulting in elevated cholesterol due to less pronounced LDL receptors?

Kratos said “Hypothyroidism from low carbs.” Mike Gruber said:

I’m the guy with the 585 TC. It went down (to 378 8 months or so ago, time to check again) when I started supplementing with iodine. My TSH has also been trending up the last few years, even before Paleo. So hypothyroidism is my primary suspect.

Those answers caused me to put the connection between hypothyroidism and LDL levels on my research “to do” list.

Chris Masterjohn’s Work on Thyroid Hormone and LDL Receptors

Chris Masterjohn has done a number of blog posts about the role of LDL receptors in cardiovascular disease. His talk at the Ancestral Health Symposium was on this topic, and a recent blog post, “The Central Role of Thyroid Hormone in Governing LDL Receptor Activity and the Risk of Heart Disease,” provides an overview.

His key observation is that thyroid hormone stimulates expression of the LDL receptor (1). T3 thyroid hormone binds to thyroid hormone receptors on the nuclear membrane, the pair (a “dimer”) is then imported into the nucleus where it acts as a transcription factor causing, among other effects, LDL receptors to be generated on the cell membrane.

So higher T3 = more LDL receptors = more LDL particles pulled into cells and stripped of their fatty cargo. So high T3 tends to reduce serum LDL cholesterol levels, but give cells more energy-providing fats. Low T3, conversely, would tend to raise serum cholesterol but deprive cells of energy.

Other Pieces of the Puzzle

Two other facts we’ve recently blogged about help us interpret this result:

We can now assemble a hypothesis linking low carb diets to high LDL. If one eats a glucose and/or protein restricted diet, T3 levels will fall to conserve glucose or protein. When T3 levels fall, LDL receptor expression is reduced. This prevents LDL from serving its fat transport function, but keeps the LDL particles in the blood where their immune function operates.

If LDL particles were being taken up from the blood via LDL receptors, they would have to be replaced – a resource-expensive operation – or immunity would suffer. Apparently evolution favors immunity, and gives up the lipid-transport functions of LDL in order to maintain immune functions during periods of food scarcity.

High LDL on Low Carb: Good health, bad diet?

Suppose LDL receptors are so thoroughly suppressed by low T3 that the lipid transport function of LDL is abolished. What happens to LDL particles in the blood?

Immunity becomes their only function. They hang around in the blood until they meet up with (bacterial) toxins. This contact causes the LDL lipoprotein to be oxidized, after which the particle attaches to macrophage scavenger receptors and is cleared by immune cells.

So, if T3 hormone levels are very low and there is an infection, LDL particles will get oxidized and cleared by immune cells, and LDL levels will stay low. But if there is no infection and no toxins to oxidize LDL, and the diet creates no oxidative stress (ie low levels of omega-6 fats and fructose), then LDL particles may stay in the blood for long periods of time.

If LDL particles continue to be generated, which happens in part when eating fatty food, then LDL levels might increase.

So we might take high LDL on Paleo as a possible sign of two things:

  • A chronic state of glucose deficiency, leading to very low T3 levels and suppressed clearance of LDL particles by lipid transport pathways.
  • Absence of infections or oxidative stress which would clear LDL particles by immune pathways.

The solution? Eat more carbs, and address any remaining cause of hypothyroidism, such as iodine or selenium deficiency. T3 levels should then rise and LDL levels return to normal.

Alternatively, there is evidence that some infections may induce euthyroid sick syndrome, a state of low T3 and high rT3, directly. And these infections may not oxidize LDL, thus they may not lead to loss of LDL particles by immune pathways. So such infections could be another cause of high LDL on Paleo.

Gregory Barton’s Experience

Gregory Barton is an Australian, 52 years old, living in Thailand, where he keeps goats, makes goat cheese and manages a large garden which can be seen on http://www.asiagoat.com/.

Gregory left a comment with an intriguing story, and I invited him to elaborate in a post. Here’s Gregory’s story. – Paul

Gregory’s Writing Begins Here

One of the claims of low carb dieting is that it will normalize the symptoms of metabolic syndrome. Blood pressure, blood sugar and blood lipids, it is claimed, will all come down on a low carb diet, in addition to weight. For most people this happens. But there is a significant minority of people on Paleo and other low carb diets whose blood lipids defy this claim. (See the list of low-carb celebrities with high LDL in this post.)

Why should this happen? Why should some people’s lipids fall on low carb while other people’s lipids rise? Suboptimal thyroid might be the proximate cause for lipids rising on a low carb or paleo diet. Broda Barnes and Lawrence Galton have this to say about thyroid disorders:

“Of all the problems that can affect physical or mental health, none is more common than thyroid gland disturbance. None is more readily and inexpensively corrected. And none is more often untreated, and even unsuspected.”  — Hypothyroidism: The Unsuspected Illness

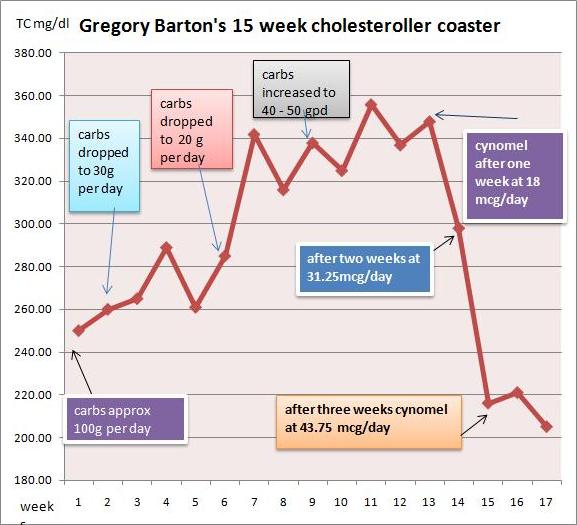
I went very low carb in April in an effort to address metabolic issues, eating as little as 15grams carbohydrate per day. I had great results with blood pressure, sleeping, blood sugar and weight loss. But lipids bucked the trend.

I had expected triglycerides and cholesterol to drop when I cut the carbs, but they did the opposite: They surged. By July my total cholesterol was 350, LDL 280, and triglycerides bobbed around between 150 and 220.

I did some research and found several competing theories for this kind of surge:

  1. Saturated fat: The increase in saturated fat created a superabundance of cholesterol which the liver cannot handle. Also, Loren Cordain has claimed that saturated fat downregulates LDL receptors.
  2. Temporary hyperlipidemia: The surge in lipids is the temporary consequence of the body purging visceral fat. Jenny Ruhl has argued that within a period of months the situation should settle down and lipids should normalize.
  3. Hibernation: The metabolism has gone into “hibernation” with the result that the thyroid hormone T4 is being converted into rT3, an isomer of the T3 molecule, which prevents the clearance of LDL.
  4. Malnutrition: In March, Paul wrote that malnutrition in general and copper deficiency in particular “… is, I believe, the single most likely cause of elevated LDL on low-carb Paleo diets.”
  5. Genetics: Dr. Davis has argued that some combinations of ApoE alleles may make a  person “unable to deal with fats and dietary cholesterol.”

I could accept that saturated fat would raise my cholesterol to some degree. However, I doubted that an increase in saturated fat, or purging of visceral fat, would be responsible for a 75% increase in TC from 200 to 350.

There are two basic factors controlling cholesterol levels: creation and clearance. If the surge was not entirely attributable to saturated fat, perhaps the better explanation was that the cholesterol was not being cleared properly. I was drawn to the hibernation theory.

But what causes the body to go into hibernation? According to Chris Masterjohn, a low carb diet could be the cause. Although he does not mention rT3, he warns,

“One thing to look out for is that extended low-carbing can decrease thyroid function, which will cause a bad increase in LDL-C, and be bad in itself. So be careful not to go to extremes, or if you do, to monitor thyroid function carefully.”

If low carb is the cause, then higher carb should be the cure. Indeed, Val Taylor, the owner of the yahoo rT3 group, commented that “it is possible that the rT3 could just be from a low carb diet.” She says, “I keep carbs at no lower than 60g per day for this reason.”

Cortisol and Getting “Stuck” in Hibernation

So what about temporary hyperlipidemia? Bears hibernate for winter, creating rT3, but manage to awaken in spring. Why should humans on low carb diets not be able to awaken from their hibernation? There are many people who complain of high cholesterol years after starting low carb.

A hormonal factor associated with staying in hibernation is high cortisol. It has been claimed that excessively high or low cortisol, sustained over long periods, may cause one to get “stuck” in hibernation mode. One of the moderators from the yahoo rT3 group said:

High or low cortisol can cause rT3 problems, as can chronic illness. It would be nice if correcting these things was all that was necessary. But it seems that the body gets stuck in high rT3 mode.

James LaValle & Stacy Lundin in Cracking the Metabolic Code: 9 Keys to Optimal Health wrote:

When a person experiences prolonged stress, the adrenals manufacture a large amount of the stress hormone cortisol. Cortisol inhibits the conversion of T4 to T3 and favours the conversion of T4 to rT3. If stress is prolonged a condition called reverse T3 dominance occurs and lasts even after the stress passes and cortisol levels fall. (my emphasis)

What I Did

First, I got my thyroid hormone levels tested. A blood test revealed that I had T4 at the top of the range and T3 below range. Ideally I would have tested rT3, but in Thailand the test is not available. I consulted Val Taylor, the owner of the yahoo rT3 group, who said that low T3 can cause lipids to go as high as mine have and, “as you have plenty of T4 there is no other reason for low T3 other than rT3.”

I decided to make these changes:

  1. Increase net carbs to ~50 grams per day. Having achieved my goals with all other metabolic markers I increased carbs, taking care that one hour postprandial blood sugar did not exceed 130 mg/dl.
  2. Supplement with T3 thyroid hormone.
  3. In case the malnutrition explanation was a factor, I began supplementing copper and eating my wife’s delicious liver pate three times per week.

I decided to supplement T3 for the following reasons:

  • The surge in TC was acute and very high. It was above the optimal range in O Primitivo’s mortality data.
  • I increased carbs by 20-30g/day for about a month. TC stabilized, but did not drop.
  • The rT3 theory is elegant and I was eager to test my claim that the bulk of the cholesterol was due to a problem with clearance rather than ‘superabundance’.

What happened?

I started taking cynomel, a T3 supplement, four weeks ago. After one week triglycerides dropped from 150 to 90. After two weeks TC dropped from 350 to 300 and after another week, to 220. Last week numbers were stable.

Based on Paul’s recent series on blood lipids, especially the post Blood Lipids and Infectious Disease, Part I (Jun 21, 2011), I think TC of 220 mg/dl is optimal. As far as serum cholesterol levels are concerned, the problem has been fixed.

I believe that thyroid hormone levels were the dominant factor in my high LDL. Saturated fat intake has remained constant throughout.

My current goal is to address the root causes of the rT3 dominance and wean myself off the T3 supplement. I hope to achieve this in the next few months. My working hypothesis is that the cause of my high rT3 / low T3 was some combination of very low carb dieting, elevated cortisol (perhaps aggravated by stress over my blood lipids!), or malnutrition.

Another possibility is toxins: Dr Davis claims that such chemicals as perchlorate residues from vegetable fertilizers and polyfluorooctanoic acid, the residue of non-stick cookware, may act as inhibitors of the 5′-deiodinase enzyme that converts T4 to T3. Finally, Val Taylor claims that blood sugar over 140 mg/dl causes rT3 dominance. I couldn’t find any studies confirming this claim, and don’t believe it is relevant to my case. Val recommends low carb for diabetics to prevent cholesterol and rT3 issues but warns not to go under 60g carb per day.

Issues with T3 Supplementation

There are some factors to consider before embarking upon T3 supplementation:

  1. Preparation: In order to tolerate T3 supplement you have to be sure that your iron level and your adrenals are strong enough. This requires quite a bit of testing. I’ve read of people who cut corners with unpleasant results.
  2. Practicalities: T3 supplementation requires daily temperature monitoring in order to assess your progress. People who are on the move throughout the day would find this difficult.
  3. Danger: Once you get on the T3 boat you can’t get off abruptly. Your T4 level will drop below range and you will be dependent on T3 until you wean yourself off. If you stopped abruptly you could develop a nasty reaction and even become comatose.

My advice for anyone doing very low carb

As Chris Masterjohn said, in the quote above, if you are going to do very low carb, check your thyroid levels. I would add: Increase the carbs if you find your free T3 falling to the bottom of the range. It might be a good idea to test also for cortisol. A 24-hour saliva test will give you an idea whether your cortisol levels are likely to contribute to an rT3 issue. It might also be a good idea to avoid very low carb if you are suffering from stress – such as lipid anxiety!

Gregory Barton’s Conclusion

I also think my experience may help prove thyroid hormone replacement to be an alternative, and superior, therapy to statins for very high cholesterol. Statins, in the words of Chris Masterjohn,

“… do nothing to ramp up the level of cholesterol-made goodies to promote strength, proper digestion, virility and fertility.  It is the vocation of thyroid hormone, by contrast, to do both.”

Paul’s Conclusion

Thanks, Gregory, for a great story and well-researched ideas. The rapid restoration of normal cholesterol levels with T3 supplementation would seem to prove that low T3 caused the high LDL levels.

However, I would be very reluctant to recommend T3 supplementation as a treatment for high LDL on Paleo.  If the cause of low T3 is eating too few carbs, then supplementing T3 will greatly increase the rate of glucose utilization and aggravate the glucose deficiency.

The proper solution, I think, is simply to eat more carbs, to provide other thyroid-supporting nutrients like selenium and iodine, and allow the body to adjust its T3 levels naturally. The adjustment might be quite rapid.

In Gregory’s case, his increased carb consumption of ~50 g/day was still near our minimum, and he may have been well below the carb+protein minimum of 150 g/day (since few people naturally eat more than about 75 g protein). So I think he might have given additional carbs a try before proceeding to the T3.

Gregory had a few questions for me:

GB: What if one is glucose intolerant and can’t tolerate more than 60 grams per day without hyperglycemia or weight gain?

PJ: I think almost everyone, even diabetics, can find a way to tolerate 60 g/day dietary carbs without hyperglycemia or weight gain, and should.

GB: What if raising carbs doesn’t normalize blood lipids and one finds oneself ‘stuck in rT3 mode’?

PJ: I’m not yet convinced there is such a thing as “stuck in rT3 mode” apart from being “stuck in a diet that provides too few carbs” or “stuck in a chronic infection.” If one finds one’s self stuck while eating a balanced diet, I would look for infectious causes and address those.

Finally, if I may sound like Seth Roberts for a moment, I believe this story shows the value of a new form of science: personal experimentation, exploration of ideas on blogs, and the sharing of experiences online. It takes medical researchers years – often decades – to track down the causes of simple phenomena, such as high LDL on low carb. We’re on pace to figure out the essentials in a year.

Low Serum Cholesterol in Newborn Babies

Don Matesz, who has embraced low-fat and low-cholesterol dieting, recently stated that “I now consider anything over ~160 mg/dl [to be] excess serum cholesterol” and cited in his support the Cordain-Eaton claims that healthy hunter-gatherers had low serum cholesterol. Of course, we looked at that and found that healthy hunter-gatherers generally had serum cholesterol over 200 mg/dl and that hunter-gatherers with low serum cholesterol generally had high infectious burdens and short lifespans. See:

When Erik referenced our series and asked, “What do you think of the argument that low cholesterol in hunter gatherer populations stems from infections and parasites?”, Don replied:

Mean total blood cholesterol of healthy human neonates is about 72 mg/dl.

Is this due to infections and parasites?

In case this question was not merely rhetorical, let me answer: No.

But it’s an interesting biology question. Why do neonates have low serum cholesterol?

Neonates and Infants

The study that Don cited [1] looked at cord blood from neonates. Cord blood is blood that circulates on the fetal side of the placenta in utero. As soon as the baby is delivered, the cord is cut and blood ceases to circulate.

So the cord blood serum cholesterol of 70.3 mg/dl is really sampling fetal cholesterol – the blood of babies who have never eaten and never breathed.

The not eating part is relevant, because HDL is generated from the metabolism of chylomicrons created in the intestine when fat is eaten, and LDL is generated from VLDL particles that carry excess calories as triglycerides from the liver. So eating generates LDL and HDL. We might expect that LDL and HDL, and thus TC, levels will rise as soon as the neonate starts feeding.

We can check this out by looking at cholesterol levels in infants. The following data is from Japan [2], but any healthy population would give similar results:

Serum total cholesterol in infants, mg/dl, by feeding method

Infant Age Formula-fed Partially breastfed Breastfed
One month 117 142 163
Six months 140 162 194

Source: Tables 2 and 3, Isomura et al 2011.

The key data is in the rightmost column, the breastfed babies. By one month postpartum, TC is 163 mg/dl (“excess serum cholesterol” on Don’s view). By six months, it is 194 mg/dl.

Formula fed babies had a much smaller rise in TC.

To understand the pattern of this data, let’s look at three issues:

  • Why do formula-fed babies have lower TC than breastfed babies?
  • Why do neonates have low TC?
  • Why do breastfed babies end up with TC near 200 mg/dl?

Formula is a lipid-deficient food

Why do formula fed babies have lower serum cholesterol? One contributing factor may be a dietary lipid deficiency.

Human breast milk is rich in cholesterol. One study found that the cholesterol content of human breast milk follows a diurnal rhythm with a low of 140 mg/L during sleeping hours and early morning, and a high of 220 mg/L in the afternoon and evening. Other studies agree that human breast milk always has more than 100 mg/L cholesterol. Babies typically drink 750 mL/day, so a breastfed baby’s daily cholesterol intake is 100 to 200 mg.

Scaled by body weight, this would be the equivalent of 1.5 to 3 grams cholesterol per day for adults – approximately ten times the typical cholesterol intake of American adults.

Clearly, evolution thinks babies should get plenty of cholesterol.

But cholesterol levels in formula are much lower:

Since … infant formulas contain very little cholesterol (10 to 30 mg/L) (Huisman et al., 1996; Wong et al., 1993), it is not surprising that plasma cholesterol concentrations are higher in infants fed human milk than in formula-fed infants.

I guess the formula makers don’t consider cholesterol to be a desirable nutrient. This may be an extremely consequential mistake.

Low TC in Neonates May Have Evolved to Suppress Immunity

So why do neonates have a very low TC?

In addition to fat and cholesterol transport, LDL and HDL both have immune functions. Low serum cholesterol signifies a loss of these immune functions. Normal immune function is associated with TC around 200 mg/dl or higher.

But infants are well known to have suppressed immunity. This is important: if the fetus had an ability to generate antibodies and mount an immune response, it might generate immune attacks against the mother leading to miscarriage.

After birth, a baby’s immune system gradually matures:

A baby’s immune system is not fully developed until he/she is about six months-old. In the meantime, pregnant mothers pass immunoglobulin antibodies from their bloodstream, through the placenta, and to the fetus. These antibodies are an essential part of the fetus’s immune system. They identify and bind to harmful substances, such as bacteria, viruses, and fungi that enter the body. This triggers other immune cells to destroy the foreign substance….

Immediately after birth, the newborn has high levels of the mother’s antibodies in the bloodstream. Babies who are breastfed continue to receive antibodies via breast milk…. This is called passive immunity because the mother is “passing” her antibodies to her child. This helps prevent the baby from developing diseases and infections.

During the next several months, the antibodies passed from the mother to the infant steadily decrease. When healthy babies are about two to three months old, the immune system will start producing its own antibodies. During this time, the baby will experience the body’s natural low point of antibodies in the bloodstream. This is because the maternal antibodies have decreased, and young children, who are making antibodies for the first time, produce them at a much slower rate than adults.

Once healthy babies reach six months of age, their antibodies are produced at a normal rate.

LDL particles, by presenting pathogen toxins to macrophages which can then present them on MHC molecules, play an important role in the generation of antibodies. (See Blood Lipids and Infectious Disease, Part II, July 12, 2011.) Low LDL signifies a reduced ability to generate antibodies.

Low LDL is therefore highly desirable as long as the baby remains in the womb, and in fact LDL levels are very low in utero.

But persistent low LDL after birth is dangerous: it makes the infant vulnerable to infections. Likewise, HDL has important immune functions (see HDL and Immunity, April 12, 2011). So LDL and HDL gradually rise to normal physiological levels, finally reaching a TC of 200 mg/dl after 6 months in breastfed babies – precisely when the babies attain normal immune function.

If TC of 190 mg/dl or higher signifies normal immune function, then formula fed babies are still immune suppressed at 6 months. Extrapolating the rise in TC, partially breast fed babies might achieve normal immune function at 12 months and formula fed babies might not achieve normal immunity until age 24 months!

Immunity Matters for Infant Health

I don’t want to delve too deeply into this, but infants are vulnerable to infections – this is why infant mortality has always been high. It still is today, and 6 months of age is still the canonical age when the danger lessens:

Globally, approximately 4,000,000 children less than 6 months of age die each year at a rate of 450 deaths per hour. In addition, high hospitalization costs for infected infants are incurred in the United States with an annual estimated cost of $690,000,000.

Formula feeding definitely escalates the risk:

In the United States, more than 40% of all infant hospitalizations are attributable to infectious disease … Diarrhoeal diseases and digestive tract infections are the most common infectious diseases in infants….

Breast feeding has been shown to have a number of beneficial effects in infants, including protection against infectious and allergic diseases. [3]

In this study, 41% of formula-fed infants developed infections between ages 5 and 8 months. [3]

A study from Brazil [4] shows that breastfeeding makes a huge difference in infant mortality:

In a population-based case-control study of infant mortality in two urban areas of southern Brazil, the type of milk in an infant’s diet was found to be an important risk factor for deaths from diarrhoeal and respiratory infections. Compared with infants who were breast-fed with no milk supplements, and after adjusting for confounding variables, those completely weaned had 14.2 and 3.6 times the risk of death from diarrhoea and respiratory infections, respectively. Part-weaning was associated with corresponding relative risks (RR) of 4.2 and 1.6. [4]

Now, deficient serum cholesterol is not the sole factor accounting for higher mortality in formula fed babies. But it is a contributing factor.

Conclusion

If serum cholesterol is healthiest below 160 mg/dl, then formula fed babies have excellent blood lipids despite a high disease and mortality rate, but breastfed babies are already in trouble at age one month and are suffering a shocking dyslipidemia at age six months, despite excellent health.

I think that’s absurd. A more logical interpretation of the evidence is this.

Healthy babies achieve serum cholesterol levels around the adult norm of 200 mg/dl by age six months.

Serum cholesterol levels below 190 mg/dl or so indicate immune suppression and increased risk of infectious disease – whatever the age of the human in question. Formula fed babies are immune suppressed for an extended period – well beyond the six month period of a healthy breastfed baby.

There are multiple causes of low serum cholesterol. A high infectious burden is one; never having eaten is another; a lipid-deficient diet is a third. But there is no evidence I am aware of suggesting that low serum cholesterol is a desirable condition.

References

[1] Mishkel MA. Neonatal plasma lipids as measured in cord blood. Can Med Assoc J. 1974 Oct 19; 111(8):775-80. http://pmid.us/4370703.

[2] Isomura H et al. Type of milk feeding affects hematological parameters and serum lipid profile in Japanese infants. Pediatr Int. 2011 Mar 21. http://pmid.us/21418403.

[3] Picaud JC et al. Incidence of infectious diseases in infants fed follow-on formula containing synbiotics: an observational study. Acta Paediatr. 2010 Nov;99(11):1695-700. http://pmid.us/20560895.

[4] Victora CG et al. Evidence for protection by breast-feeding against infant deaths from infectious diseases in Brazil. Lancet. 1987 Aug 8;2(8554):319-22. http://pmid.us/2886775.

Blood Lipids and Infectious Disease, Part II

OK, after a diversion into hunter-gatherer lipid profiles I’m back on the original goal of this series: trying to understand why serum cholesterol is protective against infections — and considering whether or under what circumstances that knowledge should affect how we eat.

In part I (Blood Lipids and Infectious Disease, Part I, Jun 21, 2011), we learned that mortality from infectious disease is essentially zero as long as serum cholesterol remains in the physiologically normal range of 200 to 240 mg/dl, and rises precipitously as serum cholesterol falls below 180 mg/dl.

Why is that? In a previous post we found that HDL has important immune functions (HDL and Immunity, April 12, 2011). Today, we’ll look at the immune functions of lipoproteins more generally.

The Logic of Evolution and the Multiple Functions of Lipoproteins

In understanding why these particles have immune functions, it may be helpful to understand the thrust of evolution.

By the time of the Cambrian explosion 530 million years ago, organisms had similar numbers of genes to organisms today, and most of these genes must have been similar in sequence to their modern descendants. We know this because their descendant genes in nearly all modern species are “homologous” and share nucleotide sequences.

So for the last 500 million years, evolution has not been adding genes or even changing genes dramatically. It’s been tweaking a fairly stable genome. And the direction of the tweaking has been toward making the genes interact in a wider and more complex number of ways with the other genes.

The effect is to give every molecule in the body a diversity of functions. Possibly serum lipoprotein particles started out merely as transporters. But they developed new functions. The most important additional functions were roles in immunity.

Because these particles circulate in the blood, and pathogens have to transit the blood in order to cause tissue infections, blood is the natural location for the strongest defenses against pathogens. For hundreds of millions of years, every blood component will have been under selective pressure to develop immune functions.

It’s commonly said that the primary function of LDL and HDL is lipid transport. But this is too narrow a view. Since pathogens are the primary cause of disease, it may be the immune functions of LDL and HDL which account for their significance as biomarkers of health and disease.

The Immune Functions of Lipoproteins

Most of the following discussion will draw from a recent review, “Plasma lipoproteins are important components of the immune system” [1]. References from this paper will be listed in parentheses, eg (1).

Lipoproteins have been shown to:

  1. Prevent bacterial, viral, and parasitic infections.
  2. Detoxify pathogen “die-off” toxins and protect against pathogen toxin-induced tissue damage.
  3. Present pathogen “die-off” toxins to the immune system to trigger antibody formation.

Detoxification and Toxin Defense

When a pathogen dies, it typically fragments and releases compounds which are toxic to humans. Such “die-off” toxins include lipopolysaccharides (LPS) and lipooligosaccharides (LOS) from Gram-negative bacteria, lipoteichoic acid (LTA) from Gram-positive bacteria, fungal cell wall components, and so on.

During infection, the number of such circulating toxins can be vastly larger than the number of pathogens. Such toxins can do a great deal of harm, and often account for most of the ill effects of disease. Medical researchers studying the often-fatal condition of sepsis commonly induce nearly all the characteristics of sepsis in animals merely by injecting LPS.

VLDL, LDL, lipoprotein(a) and HDL can all detoxify LPS and LTA; HDL is the most potent (2, 4, 5). Injecting reconstituted HDL (rHDL) into humans relieves endotoxemia (6) and LPS-induced inflammation in cirrhosis patients (7). Both LDL and HDL detoxify E. coli LPS (35).

LDL binds and inactivates some toxins, including Staphylococcus aureus ?-toxin (8), Yersinia pestis topH6-Ag (30). (Methicillin-resistant S. aureus, or MRSA, is an increasing cause of death in hospitals, and last year claimed my next-door neighbor. See The FDA Is On The Side of the Microbes, Aug 11, 2010).

LDL probably works against many other toxins too, since rats with low LDL have higher mortality when infected, but the mortality can be lessened with injections of human LDL (9). Injections of LDL prevent lethality in Vibrio vulnificus infections of mice (34).

In mice with the LDL receptor knocked out, LDL concentrations in blood are higher and there is enhanced immunity to Klebsiella pneumoniae (27) and Salmonella typhimurium (29). If the gene for apoE, a protein found in IDL which upregulates VLDL levels, is knocked out, mice become more susceptible to infection, so it appears that apoE also has immune functions (28). Mice lacking apoE are susceptible to Listeria monocytogenes (32) and Mycobacterium tuberculosis (33).

Lipoproteins may be even more important against viruses. HDL has a broad antiviral activity (18-20), and can prevent many virus species including influenza and hepatitis C from entering cells. VLDL and LDL have specific activity against certain types of virus including togaviruses and rhabdoviruses (3). Trypanosoma brucei, the parasite that causes sleeping sickness, does not always cause disease in humans because a subspecies can be destroyed by a subfraction of HDL particles which include haptoglobin-related protein and apolipoprotein L-I (10).

The role of oxLDL

Evolution has a way of turning lemons into lemonade, and fragile molecules into sensors. In the book we discuss how the body uses fragile polyunsaturated fats as signaling molecules, exploiting their proclivity to oxidize. Something similar happens with LDL.

LDL particles are fragile and easily oxidized. The body uses them as a sensor of infections, and as signaling molecules that control the response to infections.

For instance, LPS (an endotoxin) induces neutrophils to adhere to endothelial cells, promoting vascular inflammation. LPS also oxidizes LDL, creating a compound called oxPAPC which inhibits neutrophil adhesion to endothelial cells, thereby limiting the inflammatory response (12). Minimally oxidized LDL detoxifies LPS (13).

OxLDL is taken in not by the LDL receptor, but by receptors on immune cells called macrophages. When macrophages take up oxLDL they upregulate their scavenger receptors (classes A and E) by which they phagocytose (eat) bacteria and clear endotoxins (39). It has been shown that infection causes an increase in oxidation of LDL and that the resulting oxLDL promotes phagocytosis by macrophages of the specific pathogens which oxidized the LDL (42).

This may explain why atherosclerotic lesions contain large amounts of bacterial and viral DNA. Macrophages in these lesions have been stimulated by oxLDL to scavenge bacteria and viruses from the blood.

OxLDL stimulates antibody formation, including antibodies against phosphorylcholine (PC), a compound found on a wide range of pathogens including bacteria, parasites, and fungi (45-49). Anti-PC antibodies help to prevent upper airway infections (50-53).

It is thought that oxidation of LDL is an important part of the host defense to infections. OxLDL inhibits cell entry of hepatitis C (59) and Plasmodium sporozite (60).

The role of Lp(a)

Lp(a) is essentially an LDL particle with an extra apo(a) molecule bound to the apoB100 molecule by a disulfide bridge.

Some insight into the immune functions of Lp(a) developed after considering the role of plasminogen. Many pathogens recruit human plasminogen and use it to penetrate tissue barriers, enabling them to invade tissue (70, 71, 72). For instance, group A streptococcus releases an enzyme called streptokinase that activates human plasminogen and promotes invasion (73). Lp(a) has anti-fibrinolytic activity and recruits plasminogen itself, reducing availability for pathogens. For instance, Lp(a) blocks streptokinase activity (75), inhibits Staphylococcus aureus activation of plasminogen.

Moreover, Lp(a) inhibits the inflammatory response to LPS. As there is great variation in Lp(a) levels among individuals (76), this may account for variability in inflammatory response to infections.

The Exception: Candida

HDL may promote fungal infections. A recent study found that infusion of reconstituted HDL enhances the growth of Candida (25).

LDL also seems to promote fungal infections. In LDL receptor knockout mice, which have high levels of LDL, there is decreased resistance to Candida (37, 38).

OxLDL also loses its normal anti-infective role against Candida. Worse, it inhibits production of antibodies against Candida albicans (63), thus actually hurting anti-fungal immunity.

Candida is an unusual pathogen that is unusually well-adapted to living in the human body. It has learned to turn an important part of human immune defense to its own advantage.

Conclusion

High serum cholesterol protects against a host of bacterial and viral infections and some parasites, but increases risk for Candida fungal infections.

Related Posts

Other posts in this series include:

References

[1] Han R. Plasma lipoproteins are important components of the immune system. Microbiol Immunol. 2010 Apr;54(4):246-53. http://pmid.us/20377753.