Category Archives: Diets - Page 8

Mario Replies: Low Carb Diets and the Thyroid, II

We’ve been looking at papers put forth by Anthony Colpo in support of his idea that low-carb diets can cause “euthyroid sick syndrome” (see his original post on July 1 and a post expanding his case on August 20).  I gave my general perspective on this issue last week: Carbohydrates and the Thyroid, Aug 24, 2011. Briefly, an extreme low-carb diet can create a glucose deficiency, especially if endurance exercise or infection increases glucose requirements, and glucose deficiency invokes the body’s glucose conservation measures, which primarily consist of lower T3 and higher rT3 hormone levels – two hormonal markers of euthyroid sick syndrome. I also offered my view, unchanged from our book, on what level of dietary carbohydrate intake is needed to avoid a glucose deficiency.

Now it’s time to look more closely at the evidence to see if my perspective is consistent with the literature. Our thyroid expert, Mario Renato Iwakura, has been looking into Anthony’s papers to see if they report any negative effects from Perfect Health Diet-level carb intakes. In his first post (Low Carb High Fat Diets and the Thyroid, Aug 18, 2011), he showed that studies cited in Anthony’s July 1 post were generally very high omega-6 diets and therefore did not refute our diet, which prescribes low omega-6 intake. Anthony’s August 20 rebuttal cited a few more experiments which were not high in omega-6, and today Mario is going to look specifically at the issue of carbs. How much carbohydrate intake is needed to avert a glucose deficiency as indicated by decreased T3 and increased rT3?

Mario had assistance from JS Stanton of gnolls.org who reviewed the post pre-publication and contributed some helpful suggestions. Without further ado, here’s Mario! – Paul

After my post on low carb diets and thyroid function, Anthony Colpo wrote a reply that I will address with this post.

First, let me say that neither I nor Paul ever said that:

  1. A high carbohydrate diet has detrimental effects on the thyroid;
  2. Low-carb diets have any “metabolic advantage”; or
  3. A very low carbohydrate diet is healthy or good for the thyroid.

Second, Anthony has been making a case that low-carb diets can produce a condition called “euthyroid sick syndrome,” characterized by low T3 and high rT3. Anthony seems to have supposed that my post was intended to reply or refute his July 1 post. It was not; my post was intended as a treatment of thyroid health generally, and was designed to answer the question of whether the studies Anthony had cited in any way refuted the Perfect Health Diet prescription for thyroid patients.

In the developed world, most cases of hypothyroidism – up to 90% – are diagnosed as Hashimoto’s autoimmune thyroiditis. Hashimoto’s is a complex disease, whose causes are too complex to explore in this post, but in my opinion it is generally caused by exogenous toxins (gluten, mercury, bisphenol-A, bromide, etc) that disrupt gut flora and cause gut permeability and disturbed immunity that allows infections to enter the body and take root in thyroid tissue, after which in susceptible persons an autoimmune attack on the thyroid can develop.

Which infections are associated with Hashimoto’s is still an object of study, but we do know that many of the likely pathogens benefit from high gut, serum, or cellular glucose levels  and therefore we can suspect that a high carbohydrate diet might promote the disease and a low, but not too low, carbohydrate diet, such as PHD, might be therapeutic.

So even if some thyroid-related problems, like euthyroid sick syndrome, may become more likely on a low-carb diet, others, like Hashimoto’s, may be relieved by a low-carb diet. It is therefore necessary to look closely at each condition and at the literature to see which diet optimizes thyroid health – and whether specific thyroid disorders demand different diets.

In looking at the papers cited by Anthony, I’ll borrow his section headings so that readers have an easier time finding the part of his post that I am responding to.

“Here Comes the Boom!”

Anthony, in an attempt to refute my assertation that PUFA may cause thyroid impairment on LCHF diets, cites two papers.

The first was Danforth E Jr et al. [1] This paper reported a number of experiments with multiple low-carb diet variations. In all studies, provided fat was rich in omega-6 fats:

The excess fat in these diets averaged 895 kcal/d consisting of margarine, corn oil, a corn oil colloidal suspension, and fat-enriched soups and cookies. The ratio of saturated to unsaturated fatty acids in these diets was 1:2.5. [1]

However, there was a single experiment which was low in both fat and carb. Anthony wrote:

However, as you scan through the above paper, you will notice that one of the groups followed a zero-carb diet consisting of nothing but lean meat, fish, fowl, and vitamin and mineral supplements. In other words, they ate next to no PUFA.

This particular diet was actually a “protein-supplemented modified fast” consisting of:

a 6-wk period during which the subjects received a protein-supplemented modified fast including 1.2 g/kg ideal weight per d of lean meat, fish, or fowl. This was supplemented by 25 meq/d of potassium bicarbonate and citrate and 200 mg of calcium as carbonate, plus vitamins and iron. [1]

So an 80-kg man would have gotten 100 g lean meat. 100 g chicken breast supplies 165 calories total, 32 calories from fat and 133 from protein. So this “zero-carb diet” provided at most a few hundred calories per day. Anthony’s conclusion:

During this very low PUFA diet, T3 concentrations fell steadily and at six weeks were equivalent to those found after 7 days of fasting (88 ng/dl)!

Here’s the data from the study:

The initial concentration of T3 in these subjects was 155 ng/dl, fell to 87 ng/dl during the 7-d fast, and then rose to 146 ng/dl with refeeding. Initial rT3 concentrations were 25 ng/dl, rose with fasting to 57 ng/dl, and then fell again to 24 ng/dl with refeeding. Slower but similar changes in the concentrations of T3 and rT3 to those of fasting occurred with administration of a protein-supplemented modified fast for 1 wk. During the first week of the diet, T3 concentrations fell from 166 to 109 ng/l and rT3 concentrations rose from 31 to 53 ng/dl. [1]

In short: On a 7-day modified fast providing 130 protein calories per day, the fall in T3 levels is significantly less than on a 7-day true fast.

As the modified fast was continued, T3 concentrations continued to fall and at 6 wk were equivalent to those found after 1 wk of fasting (88 ng/dl). rT3 concentrations, however, returned to their initial values as the fast was continued (39 ng/dl). [1]

So even after 6 weeks, the rT3:T3 ratio was lower on the modified fast (39/88) than after 1 week on the true fast (57/87).

This all looks consistent with Perfect Health Diet arguments that we need at least 200 starch calories and at least 600 carb+protein calories to prevent a glucose deficiency; with Paul’s argument that high rT3 and low T3 is the body’s response to a glucose deficiency; and with the idea that mitigating the glucose deficiency by carb or protein intake will lower the rT3:T3 ratio. It does not speak at all to Perfect Health Diet-style low carb (400 calories from starches, adequate protein) being unhealthy.

Anthony next discusses Bisschop PH et al. [2] He even e-mailed Bisschop to be sure the diet was low in PUFA. But what diet caused a significant decrease in T3 levels? A diet supplying only 2% carbohydrate out of 2483 total calories, or 49.66 calories = 12.41g of carbohydrate. Again, Perfect Health Diet recommends 400 calories (100g) carbohydrate, and argues that, because the amount of glucose that can be manufactured from protein is hormonally limited, even if dietary protein is sufficient at least 200 readily digestible glucose calories should be eaten to avert the risk of a glucose deficiency.

Anthony quoted the following passage from Bisschop PE et al:

Apparently, isocaloric carbohydrate deprivation induces a catabolic state with respect to protein metabolism compared with diets with a normal composition and compared with starvation. This catabolic reaction to carbohydrate deprivation is associated with decreased insulin secretion. Apparently, exogenous carbohydrates and/or insulin induced by exogenous carbohydrates are required for a proper utilization of dietary proteins. [2]

Anthony goes further and says that low carb diets “suck the big one for building muscle”:

So what does explain the reduction in T3 seen on the low-carb diet? Well, remember how I said that Dr. Bisschop and his team also measured urinary nitrogen excretion in the male subjects? Urinary nitrogen excretion is a long-standing and widely employed marker for protein (as in, lean tissue) breakdown. Low-carb diets have repeatedly been shown to increase nitrogen excretion, which is one reason why they suck the big one for building muscle.

The carbohydrate deprivation diet comprised 2% of carbs and 15% of protein. On a 2483 calorie diet, this is only 420 carb+protein calories – insufficient to meet the minimum Paul estimated of 600-800 calories per day to avoid a glucose deficiency. The body simply isn’t being given enough amino acids to meet the body’s glucose requirements. Muscle breakdown necessarily follows.

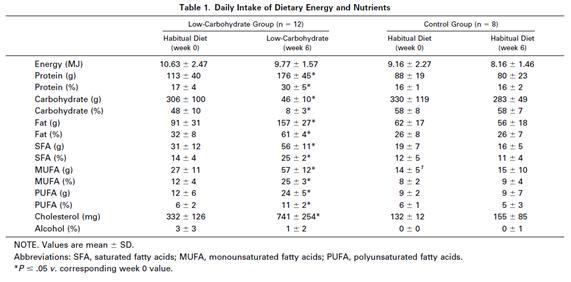
But, let’s see what happens when you provide more carb+protein. The Volek study [3] provided 8% carbs (184 calories) and 30% protein (704 calories) – still low-carb, but now enough carb and protein to avert a glucose deficiency. Here is Table 2 from Volek et al [3]:

The subjects in the Volek study were asked to maintain their current level of physical activity and to consume adequate dietary energy to maintain body mass. And yet fat mass was significantly (P < .05) decreased (-3.4 kg) and lean body mass significantly increased (+1.1 kg) at week 6.

Lesson: if you don’t want to lose muscle on a VLCD, eat extra protein and at least a bit of carbs!

“Why The Volek Study Proves Absolutely Nothing …”

Anthony wrote:

The study headed by Jeff Volek  is the only one allegedly showing no change in thyroid hormone levels on a low-carb diet, so of course it is eagerly cited by Mario as proof that I’m wrong. Just one wee problem: Volek et al didn’t even measure levels of T3, the critical thyroid hormone in question! Instead, as I explained in my article, the pro-low-carb and Atkins-sponsored Volek team chose to only measure T3 uptake, a test also known as “resin-binding T3 uptake”.

This, of course, is just fine by Mario, who happily extrapolates the results of unrelated studies examining the relationship between thyroid hormones and a bunch of other hormones; studies, I should point out, that did not involve low-carb diets.

The Volek study [3] was cited because it was unique: the only low-carb study that didn’t use a high PUFA diet. As for the failure to measure T3, I agree this was a flaw. However, you cannot reasonably argue that T3 may have decreased with no detectable effect on the human body. You absolutely cannot say that T3 can decrease with no effect on testosterone, IGF-1, glucagon, sex hormone-binding globulin (SHBG), fat mass, or lean body mass. Maybe in an alien body or in another parallel universe … but not in humans.

Anthony next cites Otten MH et al [4]. Study subjects were taken through a succession of diets, eating each diet for only 72h. The two diets that caused the greatest changes in T3 and rT3 were the first two: a diet of 100% fat and another of 50% fat and 50% protein.

Paul has argued that gluconeogenesis is hormonally limited and can generate at most 400 glucose calories per day; this is why zero-carb diets are dangerous. So it is no surprise that these zero-carb diets produce the elevated rT3 – depressed T3 pattern that is the body’s response to a glucose deficiency. Again, this does not argue against Perfect Health Diet-style low carb.

What is interesting about Otten et al is that the diet of 50% carbohydrate and 50% fat showed a decrease of 24% in T3 and an increase of 34% in rT3. It looks like even high-carb diets can induce high rT3 and low T3 if the diet is unbalanced and deficient in protein.

Perhaps the problem is not so much low-carb, but malnourishment in general! High rT3 and low T3 reduce metabolism and may help conserve protein during malnourishment, regardless of whether the threat to protein stores comes from dietary restriction of carbs or protein.

“Fifty Grams I Tell Ya, FIFTY GRAMS!!”

Anthony proceeds to comment on a study, Spaulding SW et al. [5], which was cited by Stabby in the comments. In this study, only fifty grams of carbohydrate on a high fat diet was enough to restore T3 levels to normal:

As anticipated, total fasting resulted in a 53% reduction in serum T3 in association with reciprocal 58% increase in rT3. Subjects receiving the no-carbohydrate hypocaloric diets for two weeks demonstrated a similar 47% decline in serum T3 but there was no significant change in rT3 with time. In contrast, the same subjects receiving isocaloric diets containing at least 50 g of carbohydrate showed no significant changes in either T3 or rT3 concentration. [5]

Anthony’s comment is this:

Mario and Stabby jump on this finding as if it is proof that only fifty grams of carbohydrate is needed to maintain optimal carbohydrate levels. In doing so, they totally ignore the fact that this result was hardly a universal finding. They totally ignore all the other studies showing T3 reductions at higher carbohydrate intakes.

Based on Paul’s view of things, it would be no surprise that this was not a universal finding. Paul estimates that 200 calories of dietary carbs, plus 400 calories from gluconeogenesis, is barely sufficient to prevent a glucose deficiency in a sedentary healthy person. Any perturbation – exercise, infection, protein restriction limiting the availability of substrates for gluconeogenesis – might induce a glucose deficiency.

But it is significant that when circumstances are right, 200 calories per day of carbs can eliminate the T3 drop and rT3 rise that is associated with glucose deficiency. So Spaulding et al is a positive contribution to the debate, and once again it tends to confirm Perfect Health Diet’s analysis.

Anthony cited several other studies in which 200 carb calories was insufficient to prevent a rise in T3. First, Mathieson et al [6]:

Ruth Mathieson and her colleagues from Virginia Polytech and State University placed fourteen obese free-living women on 530-calorie/day diets containing either 44 grams or 94 grams daily of carbohydrate. Both diets caused significant reductions in T3, with the ketogenic diet causing the largest decline.

Recall that Paul believes that 200 carb calories and 600 calories of carb+protein are the bare minimum needed to prevent a glucose deficiency, even when all circumstances are favorable. These diets only had 530 calories total. As carb+protein intake was insufficient to maintain glucose status, it is no surprise that the diets induced a fall in T3.

The other study cited by Anthony was Serog et al [7]. Anthony writes:

Serog et al examined four isocaloric (mean intake 2800 calories/day) diets lasting 1 week each. In two of these, a standard diet containing 45 percent carbohydrate was consumed. The remaining two diets were either low- or high-carbohydrate, and were consumed by all the subjects in random order between the two standard diet phases.

Average carbohydrate intake in grams was 250 grams on the standard diet, 71 grams on the low-carbohydrate diet, and 533 grams on the high-carbohydrate diet. On the standard and high-carbohydrate diets, T3 levels did not change, ranging from 163.3 to 169.5 ng. They declined on the low-carb diet to a mean 148.6 ng. Mirroring these changes, rT3 rose significantly only on the low-carb diet.

What was the fat used? You bet! Soy oil! From Table 1, composition of the Normal Protein Hypocaloric Diet (NHD): protein was provided as casein (14g), skimmed milk (34g), and soy (22g); fats were from soy (16g, 9g linoleic acid); carbohydrates were primarily dairy sugars.

Finally, Anthony cited a study by Davidson and Chopra [8] which found that T3 levels increased as carbohydrate intake increased from 20% toward 80% of energy. Paul himself discussed this study in last week’s post, in response to a cite by Danny Roddy. Paul’s observation was that high T3 levels are harmful to health, and that T3 may be elevated on the 80% carb diet in order to dispose of excess glucose (T3 stimulates glycolysis), so this could indicate a mechanism by which high-carb diets are health impairing. It does not prove that 80% carb diets are healthier than 20% carb diets.

Conclusion

Yes, it is possible to develop a glucose deficiency on low-carb diets. If this occurs, the body will conserve glucose by reducing T3 and increasing rT3.

However, there is as yet no evidence that T3 and rT3 will exit normal ranges when following Perfect Health Diet guidelines.

Until a well-designed study provides contrary evidence, I stand by my assertion that a diet with sufficient but not excess protein, moderate carbohydrate comprising a minority of calories, and high intake of saturated and monounsaturated fat but low intake of polyunsaturated fat is optimal for thyroid function. But this is the Perfect Health Diet!

References

[1] Danforth E Jr et al. Dietary-induced alterations in thyroid hormone metabolism during overnutrition. J Clin Invest. 1979 Nov;64(5):1336-47. http://pmid.us/500814

[2] Bisschop PH, et al. Isocaloric carbohydrate deprivation induces protein catabolism despite a low T3-syndrome in healthy men. Clin Endocrinol (Oxf). 2001 Jan;54(1):75-80. http://pmid.us/11167929

[3] Volek JS et al. Body composition and hormonal responses to a carbohydrate-restricted diet. Metabolism. 2002 Jul;51(7):864-70. http://pmid.us/12077732

[4] Otten MH et al. The role of dietary fat in peripheral thyroid hormone metabolism. Metabolism. 1980 Oct;29(10):930-5. http://pmid.us/7421583

[5] Spaulding SW et al. Effect of caloric restriction and dietary composition of serum T3 and reverse T3 in man. J Clin Endocrinol Metab. 1976 Jan;42(1):197-200. http://pmid.us/1249190

[6] Mathieson RA, et al. The effect of varying carbohydrate content of a very-low-caloric diet on resting metabolic rate and thyroid hormones. Metabolism, May, 1986; 35 (5): 394-8. http://pmid.us/3702673

[7] Serog P, et al. Effects of slimming and composition of diets on V02 and thyroid hormones in healthy subjects. Am J Clin Nutr. 1982 Jan;35(1):24-35.http://pmid.us/7064875

[8] Davidson MB, Chopra IJ. Effect of carbohydrate and noncarbohydrate sources of calories on plasma 3,5,3?-triiodothyronine concentrations in man. J Clin Endocrinol Metab. 1979 Apr;48(4):577-81. http://pmid.us/429502.

Carbohydrates and the Thyroid

Mario’s post last Thursday (Low Carb High Fat Diets and the Thyroid, Aug 18, 2011), looking at a series of studies cited in a July 1 post by Anthony Colpo, elicited a reply from Anthony.

The exchange turned out to be a blessing, because it is generating some insights on topics of fundamental importance.

Low-Carb Dangers

A motivating factor for our book was Paul’s bad experience with very low carb dieting. We felt obliged to warn the Paleo community that it was possible to become deficient in glucose and that this could be dangerous. We’ve blogged about “Zero Carb Dangers” (see especially Dangers of Zero-Carb Diets, II: Mucus Deficiency and Gastrointestinal Cancers; Danger of Zero-Carb Diets III: Scurvy; Dangers of Zero-Carb Diets, IV: Kidney Stones). Our work has persuaded many in the Paleo and low-carb communities to eat more “safe starches” including white rice. We recommend a carb intake that approaches the body’s total glucose utilization.

We do recommend ketogenic diets and low-carb diets as therapies for many neurological disorders and some infections, but believe that even ketogenic diets should generally include at least 200 glucose calories per day.

So when we consider claims that low-carb diets can be dangerous, it’s not without sympathy.

At the same time, given the therapeutic potential of low-carb and ketogenic dieting, and the likelihood that humans are evolutionarily adapted to a range of macronutrient intakes, we don’t think it’s appropriate to repudiate low-carb entirely.

This places an onus on us to closely examine the evidence, understand precisely when a low-carb diet passes from healthy to unhealthy, and make clear recommendations for how much dietary glucose is needed in different circumstances to avoid negative consequences.

The Issue of Low-Carb and the Thyroid

One problem that sometimes occurs on low-carb diets is a syndrome called “euthyroid sick syndrome,” characterized by low T3 and high reverse T3 hormone levels and elevated cortisol.

Here’s our friend and gracious podcast host, Danny Roddy:

[A low-carb] diet will lead to an elevation of catabolic stress hormones, while [a high-carb diet] has been shown to increase thyroid hormone triiodothyronine (T3), increase testosterone, and decrease cortisol, the anti-hair, pro-misery stress hormone (here, here, here (PDF), & here).

And here’s Anthony Colpo in his July 1 post:

[D]ecreasing carbohydrate intake to low levels results in diminished levels of T3 and/or increased rT3, something most aspiring fat-burners wish to avoid desperately.

Few things are more essential to good health than proper thyroid function. So this is clearly an issue we have to investigate and understand. It could impact our prescription for the minimum level of carb intake needed for good health.

Why Mario’s Post Emphasized Omega-6 Fats

Anthony seemed to think that Mario’s emphasis on the dangers of high-omega-6 diets was intended as a denial that low-carb specifically could be the cause of thyroid trouble. No.

The studies in question compared low-carb high-fat diets with other diets. In some but not all studies, thyroid function was impaired on the low-carb high-fat diet.

In looking at the studies cited by Anthony plus a few others, Mario found that thyroid function was impaired on all of the low-carb high-omega-6 diets but none of the (admittedly few) low-carb high-saturated-fat diets.

This led him to emphasize the role of the fatty acid type, rather than the amount of carbohydrates. It is also supportive of Perfect Health Diet claims that high omega-6 is toxic whereas high saturated fat is not.

Mario did not have space to treat the dangers of glucose deficiency for the thyroid, especially since the studies he was examining did not provide compelling evidence about the effects of dietary carbohydrate restriction (once the possibility of PUFA toxicity was accounted for). So he didn’t venture into this question, other than to assert the importance of “moderate” carb consumption.

But now we will – in the remainder of this post, and two upcoming guest posts.

Let’s explore the circumstances under which we might expect low-carb diets to cause “euthyroid sick syndrome.”

The Limits to Glucose Production

Let me begin by revisiting the initial post in our Zero-Carb Dangers series (Dangers of Zero-Carb Diets, I: Can There Be a Carbohydrate Deficiency?, Nov 10, 2010). I’ve been meaning to correct that post for some time, and this seems a good occasion.

That post emphasized size of the liver as a limit on its ability to synthesize glucose from protein. There is, indeed, a physical limit to the liver’s ability to manufacture glucose from protein. As long as unlimited fat is available for energy production and unlimited protein is available as a gluconeogenic substrate, the limit is determined by the oxygen supply to the liver and is about 400 g / 1600 calories per day.

However, this theoretical limit is never reached in healthy humans, except in some diabetics (as Nigel Kinbrum pointed out). The liver’s conversion of protein to glucose is controlled hormonally; insulin and glucagon are the most important players, with insulin inhibiting gluconeogenesis and glucagon promoting it.

Diabetics can have very high rates of gluconeogenesis because their pancreatic beta cells may no longer produce insulin even as their pancreatic alpha cells continue to produce glucagon.

In normal healthy humans, basal hormone levels are balanced so that during fasting or starvation, the liver and kidneys manufacture minimal but sufficient glucose while sparing protein as much as possible.

In a normal person, the liver and kidneys together never produce more than about 100 g / 400 calories glucose per day from protein. In the absence of hormonal dysregulation, this is a fairly hard limit.

Glucose Utilization and Glucose Deficiency

We discussed this in the book, and I won’t repeat the evidence. Suffice it to say that everyone consumes at least 600 glucose calories per day, a majority by the brain but also extensive amounts for structural components of the body – glycosylated proteins which coat every cell, and glycoproteins which are major components of mucus, joint lubricants, and connective tissue – and for immune function (since glucose is needed to produce the reactive oxygen species that kill pathogens).

Because limited research has been done on this subject, it’s possible that we’ve underestimated the body’s glucose needs. It could be as high as 800 glucose calories per day. It’s not likely to be lower.

This is for sedentary healthy people. Two factors may substantially increase glucose utilization:

  • Infection. Many pathogens consume glucose – indeed, people with parasitic infections can sometimes have great difficulty obtaining enough glucose from food – and the immune system also consumes glucose.
  • Athletic activity. Exercise can consume large amounts of glucose.

Let’s look at athletic activity. The Mayo Clinic lists the amount of calories burned per hour of exercise of various kinds, and the most intense types of exercise, such as running or cycling at race speeds (>20 mph), may burn 1,200 calories per hour. Most of these calories come from fat, but 30-40% may come from glycogen, and glucose is consumed to replace the glycogen. Thus, a runner or cyclist may burn up to 400 glucose calories per hour of training.

In a cyclist, runner, or swimmer who trains 2 hours per day, therefore, glucose needs may be quite a bit higher than in our sedentary healthy person. Such an athlete may be consuming ~1500 glucose calories per day.

Yet at most 400 calories of glucose per day can be manufactured from protein. It’s clear that athletes need to eat a fair amount of carbohydrate to avoid a glucose deficiency.

Anthony Colpo is a cyclist and athlete who routinely engages in intense endurance exercise. His unusually high glucose utilization is presumably what made him vulnerable to glucose deficiency syndromes – and therefore more sensitive than others to the dangers of low-carb diets.

The Basis for Our Carbohydrate Consumption Recommendations

Let’s go back to our sedentary healthy person, and let’s consider the minimum dietary glucose that person needs to avoid difficulty.

First let’s consider a person who eats a large amount of protein – 600 calories per day, about double the intake of an average American.

Roughly 200 calories per day may be needed for structural uses, leaving 400 calories per day for possible conversion to glucose.

But if protein consumption is lower, there may not be enough substrate to create 400 glucose calories per day. This may lead to hormonal changes that try to conserve protein by limiting gluconeogenesis.

Now let’s look on the glucose side. If 600-800 glucose calories are utilized by the body daily, and at most 400 of those can be manufactured from protein and at most ~300 can be displaced by ketones, then someone on a zero-carb diet is living right on the margin of glucose deficiency.

And this is before athletic activity or infections are considered.

If 200 glucose calories per day are consumed, and if 400 protein calories are consumed, and if MCT oil (a ketogenic substrate) is consumed to make it easier to generate ketones to displace glucose, then one might just barely meet the body’s structural glucose and protein needs on a ketogenic diet. This is why we recommend that ketogenic diets include at least 200 calories from starch.

But it’s not really desirable to live on the margin of glucose deficiency, especially if you’re not making it easy for your body to generate ketones. For this reason, our normal diet recommends 400 calories or more from starches.

The Trouble with Vegetables

We generally advise not counting vegetables as carb calorie sources. This often puzzles diabetics who note that vegetables have some sugar – typically, about 80 calories per pound – and that consuming vegetables raises their blood sugar levels.

The reason we recommend not counting vegetable calories is that digestion of vegetable matter is an energy-intensive process that consumes glucose. Gut cells consume glucose directly, and also vegetables have a lot of fiber which causes gut bacterial activity which in turn leads to immune activity which consumes glucose. This glucose consumption by the gut and immune system occurs over an extended period of time after vegetables are eaten – perhaps 6 hours. But vegetable sugars are digested quickly – mainly in the first hour. So you can have a surge of blood sugar due to vegetable sugars, even if the vegetables make no net contribution to daily glucose balance.

So it’s really starches and fruits that are the useful sources for meeting the body’s carb needs.

What Happens When There is a Glucose Deficiency?

When the body is deficient in glucose, the hormonal milieu changes to help maintain body functions while conserving glucose and protein.

Two of the important hormones are cortisol and T3.

T3, the most active thyroid hormone, has a strong effect on glucose utilization. T3 stimulates glucose transport into cells, and transport is the limiting factor in glucose utilization in many cell types. In hyperthyroidism, a condition of too much T3, there are very high levels of glucose utilization. Administration of T3 causes elevated rates of glycolysis regardless of insulin levels.

The body can reduce T3 levels by converting T4 into an inactive form called reverse T3 (rT3) rather than active T3. High rT3 levels with low T3 levels lead to reduced glucose transport into cells and reduced glucose utilization throughout the body.

Cortisol is a hormone that helps prevent hypoglycemia, a condition of low blood glucose. It reduces glucose utilization and increases gluconeogenesis.

So the syndrome of low T3, high rT3, and high cortisol can be understood as a diagnostic pattern of a systemic glucose deficiency.

What Is “Euthyroid Sick Syndrome”?

Euthyroid sick syndrome is defined as “a state … where the levels of T3 and/or T4 are at unusual levels, but the thyroid gland does not appear to be dysfunctional.” Specifically, “Reverse T3 are generally increased signifying inhibition of normal Type 1 enzyme or reduced clearance of reverse T3. Generally the levels of Free T3 will be lowered.”

Wikipedia’s list of causes includes:

  • Fasting, starvation (PAJ: These induce glucose deficiencies, especially if there is insufficient protein available to sustain even the normal 400 calories/day glucose synthesis.)
  • Sepsis (PAJ: Infection increases glucose requirements.)
  • Trauma (PAJ: Fabrication of structural glycoproteins and protein glycosylation is increased during wound repair.)
  • Malignancy (PAJ:  Cancers consume large amounts of glucose.)
  • Hypothermia (PAJ:  Shivering, like endurance exercise, consumes glycogen.)
  • Cirrhosis (PAJ: Damage to the liver may reduce its ability to synthesize glucose, forcing glucose conservation.)
  • Chronic renal failure (PAJ: The kidney is the other organ besides the liver that synthesizes glucose from protein. So kidney damage will reduce the body’s ability to synthesize glucose.)

Looking at this list, it seems that euthyroid sick syndrome may be just another name for a systemic glucose deficiency.

If glucose deficiency is the cause, then obviously low carb diets are going to be a risk factor for euthyroid sick syndrome.

This is not to say that low carb diets will automatically lead to euthyroid sick syndrome. A sedentary person free of infections may be quite normal and healthy on a very low carb diet. This is why most low carbers do not experience the condition.

But if other risk factors, like infection, cancer, or endurance exercise, are present, then the odds of developing euthyroid sick syndrome on a low carb diet may become quite high.

Diagnostic Value of rT3:T3 Ratio for Low-Carb Dieters

Here’s an interesting implication of today’s analysis.

The ratio of rT3 to T3 may have diagnostic value for glucose status and therefore for the presence of infections or cancers. It might not be a bad idea for low-carb dieters to monitor these hormone levels, and to eat enough “safe starches” to keep their rT3:T3 ratio at normal levels.

The rT3:T3 ratio is likely to be of much greater clinical value to low-carbers than to the average high-carb American. So even though doctors rarely test for it, low-carb dieters may find it quite useful.

Are High-Carb Diets Without Risk?

In the wake of Anthony’s reply I was amused by a Twitter conversation between @DannyRoddy and @StabbyRaccoon – two of the smartest and nicest people on the Web.

As noted above, Danny believes that high-carb diets might be beneficial by creating above-normal T3 levels:

I believe the real question is: what range radically increases T3?…

I’m more concerned where CHO starts dramatically increasing T3.

Stabby paid me the honor of valuing my opinion:

maybe Paul … could look into it.

Alright, let’s look (briefly) into it.

In the quote from Danny on potential risks of low-carb diets, he cited several papers. One of them was this:

To evaluate the effect of changes in dietary carbohydrate (CHO) and excessive caloric consumption on circulating thyroid hormone levels, six normal weight subjects were fed five separate diets: three isocaloric diets with 20%, 40%, or 80% CHO and two hypercaloric (+2000 calories) diets with 20% or 40% CHO for 5 days each as outpatients. T4, T3, and rT3 concentrations were measured in plasma samples collected on the morning of the sixth day. At least 1 week of the subjects’ usual diets intervened between each experimental diet.

Mean T4 and rT3 levels were similar after all diets. Pair-wise comparisons among all five diets revealed significantly (P < 0.005) increased T3 concentrations after both hypercaloric diets compared to the iso-20 and iso-40 diets, and after the iso-80 compared to the iso-20 diet. A multiple regression analysis of the data revealed the highest correlation of T3 levels with total calories (r = 0.68; P < 0.001) rather than with the intake of CHO (r = 0.46; P < 0.025), fat (r = 0.49; P < 0.02), or protein (r = 0.30; P = NS).

I haven’t read the full study yet and find this abstract mildly puzzling. On the one hand, the multiple regression analysis shows that fat, not carbohydrate, is the most effective macronutrient at raising T3. Maybe Danny should eat a high-fat diet to raise his T3.

On the other hand, the normo-caloric 80% carb diet had more T3 than the normo-caloric 20% carb diet. So maybe carbs do increase T3 more than fat.

Now, hypercaloric (positive energy balance) diets are associated with a variety of diseases including obesity and metabolic syndrome. Stephan Guyenet has argued that positive energy balance is itself inflammatory and damaging, and that high-reward foods which induce overeating may directly cause metabolic diseases.

In this study, T3 concentrations were increased similarly on both hypercaloric (2000 excess calories) 20% and 40% carb diets and normo-caloric 80% carb diets. Could it be that some of the ill effects of hypercaloric diets will also be present on normo-caloric high-carb diets?

Of course, with any hormone we have to ask what the right amount is. Usually both too much and too little are problematic. This is certainly true of thyroid hormones.

High T3 concentrations are characteristic of the disease hyperthyroidism and have negative effects. One of the effects of high T3 levels is enhanced transport of glucose into cells. For instance:

Pre-treatment of these cells with T3 moreover substantially enhances the stimulatory effect of insulin such that at maximally effective hormone concentrations the effects of T3 and insulin on glucose transport are more than additive and indeed nearly multiplicative …

The extra glucose transported into cells is disposed of through glycolysis. Glycolysis is the characteristic metabolism of cancer cells, so high T3 might promote the cancer phenotype.

Indeed, hyperthyroidism increases the risk of ovarian cancer by 80%.

Glycolysis also occurs in the cytosol, making glucose and downstream energy substrates like pyruvate and lactate available to bacteria. Thus, high T3 may promote bacterial infections.

Indeed, thyroid storms can cause sepsis.

Those who have been following CarbSane’s exposition of the dangers of lipotoxicity may be interested to find that high T3 not only increases circulating glucose levels and rates of glycolysis, but also circulating free fatty acid levels:

Hyperthyroidism, which was induced by administration of tri-iodothyronine (T3) to rats for 2, 5 or 10 days, increased fasting plasma concentrations of glucose, insulin and free fatty acids. Administration of T3 for 2 or 5 days increased the rates of glycolysis at all insulin concentrations studied …

Elevated free fatty acids seem to be the primary cause of diabetes.  Here elevated free fatty acids are associated with high glucose and with a hormonal trait – high T3 – associated with high-carb diets.

(Aside: This kind of evidence is why we have to be a bit cautious in assuming that free fatty acid levels, and thus diabetes risk, are higher on low-carb high-fat diets. Recently CarbSane and I had a brief discussion on this topic: see this post on her blog and the comment thread. She leans toward the idea that more dietary fat = more free fatty acids and thus more lipotoxicity; to me the issue is far from clear, as the need to dispose of glucose will tend to inhibit drawdown of free fatty acids. I think that moderate carb consumption, near the body’s glucose utilization, rather than high carb consumption may minimize lipotoxicity. However, concerns over lipotoxicity might lead us to revisit our suggestion of ketogenic diets for diabetes.)

Getting back to the question Stabby asked me to look into: I have only a provisional response. I have given only the most superficial of looks at the literature. I am mainly tossing out topics for further investigation (hopefully by others!).

But at a glance, I don’t see any obvious reasons to change the judgment of our book that moderate carb consumption, close to the body’s glucose utilization needs, is optimal. In my judgment, “dramatically increasing T3” by eating a high carbohydrate diet (if, indeed, a high-carb diet does this) is probably undesirable. Rather, it’s best to eat a moderate amount of carbohydrate that keeps T3 at physiologically normal, healthy levels. Both too much and too little T3 – and, perhaps, too much and too little dietary carbohydrate – may be dangerous.

Conclusions

In regard to Anthony Colpo, I’d like to extend an olive branch, and reiterate the following points:

  • The purpose of Mario’s post last Thursday was not to show that Anthony was right or wrong, but to find out whether we were right or wrong.
  • Although we are more sympathetic than Anthony to low-carb diets, we agree that they have risks. Yes, it is possible to become glucose deficient.
  • I stand by Mario’s post. I don’t believe there are any errors in it.
  • Nothing Mario said contradicted the main points of Anthony’s July 1 post to which it linked. Mario (and we) endorsed “moderate” carb consumption, not very low carb diets, and Mario’s focus on the dangers of high-omega-6 diets should not be construed as a denial of the dangers of very low-carb diets.

Anthony and I exchanged increasingly cordial emails over the weekend, are sending each other copies of our books, and I hope we will be on good terms even if our diet ideas and study interpretations are not identical.

In regard to rT3:T3 ratio, it might be interesting to compile some data on rT3:T3 ratios and carb intake among low-carbers. It may be that studying how rT3:T3 ratio varies with carb consumption will give us a clearer idea of optimal carbohydrate intake. I would expect there would be some “plateau region” of carb intake over which rT3 is low and T3 levels are stable. At very high carb intakes, T3 might be elevated in order to promote glucose disposal; at very low carb intakes, the euthyroid sick syndrome of elevated rT3 and depressed T3 might hold.

Finally, a look at upcoming posts. Yes, long as this post was, we’re not done exploring these issues.

Anthony cited some more papers in his reply to Mario, and Mario will respond in detail: what do those studies prove? The purpose of this is to evaluate our diet to see if our advice is sound, not to feature any disagreements Mario may have with Anthony, or to prove anyone wrong.

In the post after that, we’ll have a fascinating personal story from Gregory Barton. Gregory’s experience connects euthyroid sick syndrome to the vexing issue of high LDL on Paleo diets, and as such ties in with some points Chris Masterjohn has made on the role of thyroid hormone in LDL pathways. As such it may help us reach some closure on two of the outstanding problems that have troubled the low-carb Paleo community.

And if we’re not tired of the issue after those posts, commenter Valtsu has been sending me references to papers discussing links between infections and euthyroid sick syndrome. It looks like toxins and inflammatory cytokines released during infections can disrupt the ability of the hypothalamus to regulate thyroid hormone levels. This could have implications for other diseases besides euthyroid sick syndrome – including obesity, which often features disruption of the hypothalamus’s regulation of energy utilization.

So I think this little controversy is leading us to some productive discoveries. Therefore, I’d like to thank Anthony for raising the issues in the first place. Out of disagreement may come insight.

Low Carb High Fat Diets and the Thyroid

Last year we ran a series on “Zero-Carb Dangers,” which are health problems that can appear if carb intake – or carb+protein intake, since protein can to some degree make up for a deficit of glucose – are too low. Anthony Colpo has recently argued that hypothyroidism should be added to the list of potential zero-carb dangers; and that low-carb high-fat diets in general might create a risk of hypothyroidism. Similar arguments have been made by Matt Stone and others. Our resident thyroid expert, Mario Renato Iwakura, decided to look more deeply into the matter. What does the literature say? Here’s Mario.

There have been anedoctal reports on low carb forums about people becoming hypothyroid after following a low carb, high fat diet. Anthony Colpo recently wrote a blog post about carbohydrate, fat and protein intake and their effects on thyroid hormone levels, concluding that a high fat or high protein diet is detrimental and that a high carbohydrate diet is good for the thyroid [1].

What I will try do demonstrate here is that the sole conclusion we can draw from the literature, including the studies cited by Anthony and others, is that a high polyunsaturated fat (PUFA) diet is detrimental to thyroid health. There is no evidence that a diet, such as the Perfect Health Diet, that is high in saturated and monounsaturated fat, low in PUFA, and provides sufficient, moderate levels of protein and carbohydrate, has any detrimental effect on the thyroid. On the contrary, I believe that such a diet is optimal for thyroid health.

What Has Been Tested: High PUFA Diets

Colpo’s post is extensive and covered most, but not all, relevant studies published to date about the subject. Many of those studies have problems like short duration or calorie restriction. But in almost all, with the exception of one study by Jeff Volek and collaborators [2], the fat used in the high fat diet was predominantly polyunsaturated fat from vegetable oils. An example is the Vermont long term study [3]:

“The long-term study of fat overfeeding included four subjects studied before and after overeating fat for 3 mo. The excess fat in these diets averaged 895 kcal/d consisting of margarine, corn oil, a corn oil colloidal suspension, and fat enriched soups and cookies.  The ratio of saturated to unsaturated fatty acids in these diets was ~1:2.5.”

This ratio is precisely that found in corn oil. So, this diet’s fat  was probably 13.5% saturated, 29% monounsaturated, and 57.5% polyunsatured.

Or in Ullrich et al 1985 [4]:

“One diet was high in polyunsaturated fat (HF), with 10%, 55%, and 35% of total calories derived from protein, fat, and carbohydrate, respectively.”

Polyunsaturated Fat and the Thyroid.

Let’s look at the literature, starting with two studies not cited by Anthony.

In 1995, Vasquez et al tested four very low calorie diets, with variable amounts of carbs, fats and protein, in 48 obese women for 28 days [5]. All diets were in liquid form, and fat was predominantly PUFA. The composition of the four diets was:

50P/10C 50P/76C 70P/10C 70P/86C
Energy (kcal) 590 590 615 615
Protein (% cal) 35.5 33.7 45.8 43.0
Fat (% cal) 57.8 15.1 48.1 4.1
Carb (% cal) 6.7 51.2 6.1 52.9
T3 Day 0 2.0 2.2 1.6 1.8
T3 Day 28 1.1 1.7 1.0 1.4
Variation -45% -23% -37% -22%

T3 thyroid hormone levels decreased on all of these severely calorie restricted diets. However, when PUFA was high (50P/10C and 70P/10C) the decrease in T3 was much larger than when PUFA was low (50P/76C and 70P/86C).

In a 1992 paper, Vasquez et al compared two very low calorie diets (600kcal/day), one ketogenic and the other nonketogenic [6]. The fat sources were soybean oil and refined and stabilized vegetable oils.

Ketogenic Nonketogenic
Protein 35% 34%
Fat 58% 15%
Carbs 9% 51%
T3 Day 0 1.4 1.5
T3 Day 28 0.8 1.3
Variation -43% -13%

The various studies cited by Colpo also show decreases in T3 levels in diets high in PUFA. In Ullrich et al 1985 [4], a study of healthy young adults, although TSH, T4, and rT3 did not change significantly, T3 levels on a high polyunsaturated diet decreased more than on a high protein diet:

“The triiodothyronine (T3) declined more (P less than .05) following the HF diet than the HP diet (baseline 198 micrograms/dl, HP 138, HF 113). Thyroxine (T4) and reverse T3 (rT3) did not change significantly. Thyroid-stimulating hormone (TSH) declined equally after both diets”

In the Vermont study [3], where the low carb diet was high in PUFA fat, that was the case too:

“During maintenance eating, levels of T3 (triiodothyronine) were higher on the high-carb diet. When subjects on the low-carb diet began eating the higher-carb mixed weight gain diet, their T3 levels rose. T3 levels among those who went from the high-carb maintenance diet to the mixed diet remained unchanged. In contrast to T3, serum concentrations of T4 were unchanged by overeating or changes in dietary composition.” [1]

Low-PUFA High-Fat Diets and the Thyroid: Lack of Direct Evidence

Unfortunately we don’t have human studies comparing diets high in saturated fat and polyunsaturated fat and their effect on thyroid hormones synthesis. Neither do we have studies showing what happen to T3 levels after a high saturated/monosaturated fat diet is eaten. We will have to rely on indirect evidence.

Indirect Evidence: Calories Required to Maintain Weight.

There is a connection between thyroid activity and obesity. Reduced thyroid activity reduces energy expenditure (“calories out”) and promotes weight gain; normal thyroid function tends to promote normal weight. So we can use the vast number of obesity studies as indirect evidence for the effects of different types of diet on the thyroid.

Anthony emphasized this relationship in his post, noting findings of the Vermont study on overfeeding:

“Again, that both groups gained weight should come as no surprise. However, the group overfed the mixed diet required more calories (2,625 kcal/m2 per day) to maintain their new heavier weights than did the group overfed fat (1,840 kcal/m2 per day). Baseline differences in metabolism between the two groups were ruled out, as there was no difference in total calories required to maintain initial lean weights.”

So the high-PUFA diet promoted weight gain: it caused excess weight to be retained at a lower calorie intake. This is consistent with reduced thyroid activity.

Is this effect due to a high-fat diet generally, or to high-PUFA diets only? Some insight into this question may be found in a blog post by Stephan Guyenet [7]. Rats fed isocaloric diets in which the fat source was varied among three groups – a beef tallow group (primarily saturated fat, 3% PUFA), an olive oil group (primarily unsaturated, 10-15% PUFA), and a safflower oil group (78% PUFA) – had highly variable weight gains. The olive oil group gained 7.5% more weight than the beef tallow group, and the safflower oil group 12.3% more weight.  This is exactly the same pattern found in the Vermont overfeeding study in man: reduced energy expenditure as the consumption of PUFA increases.

Since 1945, it has been known that men fed a high carbohydrate and then a high saturated fat diet needed about the same amount of calories to mantain their weight in cold temperature [18]. Here is the data, expressed in terms of the percentage of baseline calorie intake that the men had to eat to maintain their weight:

The high-fat diet consisted largely of butter and cream; the high-carbohydrate diet of extra sugar. When eating the butter and cream, subjects had to eat more calories to maintain weight than when eating the sugary diet – 202% of baseline calorie intake vs 191%. Every subject had to increase calories when eating high-fat. This suggests higher thyroid hormone levels on the high-saturated fat diet than on a high-carb diet.

The Volek Study

Anthony cited a study by Jeff Volek and others [2] on body composition and hormonal responses to a carbohydrate-restricted diet and said that:

Upon commencement of the low-carbohydrate diet a small calorie deficit and a significant increase in protein intake occurred, resulting in a mean 3.3 kilogram fat loss and a 1.1 kilogram lean mass gain. There was a significant increase in total T4 (+10.8%), but for some reason the researchers did not directly measure T3 nor rT3. They instead tested T3 uptake, an indirect measure of thyroxine binding globulin (TBG) in the blood, which tells us little of any real value about changes in actual thyroid hormone levels. The researchers also measured IGF-1, glucagon, total and free testosterone, sex hormone-binding globulin (SHBG), insulin-like growth factor-I (IGF-I), and cortisol. The only significant change noted was a reduction in insulin following the low-carbohydrate diet.

The Volek study is very interesting because it was not calorie restricted (only carbohydrate was restricted) and was done in normal-weight man. The amount of polyunsaturated fat increased a little (from 6 to 11% of calories), but was still low; saturated and monosaturated fats were the main fats of the low carb-high fat diet. Although he did not directly measured T3 nor rT3 we have indirect evidence that they were not impaired.

One very well known fact is that hypothyroid patients, even when taking T4 hormones, usually struggle to lose fat. This occurs because, when thyroid hormones are low, especially when T3 (triidothyronine) is low [8], the basal metabolism is decreased. If the LCHF diet was impairing the thyroid these healthy normal weight men, who had been advised to eat enough calories to maintain their weight during the intervention, should have struggled to lose fat mass. In fact they lost 3.3 kg (7.3 pounds) in 6 weeks on an 8% reduction in calorie intake. The control group did not lose any weight despite an 11% reduction in calorie intake.

More, testosterone levels usually decrease when thyroid hormones are low [9][10]. IGF-1 levels are also decreased in hypothyroidism [11][12]. Glucagon levels are higher in hypothyroid patients [13]. Sex hormone-binding globulin (SHBG) is low in hypothyroidism [14][15][16]. But none of these parameters changed during the LCHF diet.

So this diet which was low in carb (8% of calories) and moderately high in protein (30%) and PUFA (11%) does not seems to affect the thyroid if saturated and monosaturated fat (50% of calories) are the main fat of the diet. Let’s compare the fatty acid profile of the Volek diet with that of human milk:

Saturated Monounsaturated Polyunsaturated
Volek diet 41% 41% 18%
Human milk 47.5% 40.5% 12%

Not too much difference. Perhaps PUFA intake needs to be higher than 11% of calories or 18% of fat to impact the thyroid.

Effects of high fat and thyroid responses to cold.

In 1945, Mitchell et al published two articles comparing the effects of proteins versus carbohydrates and fat versus carbohydrate on man’s tolerance to cold exposure [18][19]. Carbohydrate does better than protein, but worse than fat, at maintaining internal temperature as measured by rectal temperature.

On the first experiment, five men consumed a high protein diet (41% P, 40% F, 19% C) and five a high carbohydrate diet (11% P, 41% F, 48% C) for 5.5 months. Food intake was adjusted to mantain a constant body weight.

The effect of decrement in rectal and mean skin temperature during eight hour exposure to cold with light clothing:

Rectal Temp Skin Temp
High Protein 1.63 5.21
High Carb 1.05 3.65
Significance P=0.017 P=0.0096

On the second experiment, five men consumed a high fat diet (10% P, 73% F, 17% C) and five a high carbohydrate diet (10% P, 23% F, 67% C) for 56 days. Food intake was adjusted to maintain a constant body weight. The excess fat of the high fat group was provided by butter and cream.

Decrement in rectal temperature from the first two hour to the last two hours of 6 hours exposures to -20º F (-29º C), with variable number of intervening meals:

Number of intervening meals Difference 

0 and 1 meal

Difference 

0 and 2 meals

None One Two
High Carb 0.71 0.72 0.68 -0.01 0.02
High Fat 0.60 0.36 0.33 0.24 0.27
Significance None P=0.034 P=0.018 P=0.083 

P=0.051*

P=0.11 

P=0.009*

* These probabilities pertain only to the high fat diet

What is clear here, is that 6 hours exposures to -20º F decreased rectal temperature equally in both groups if no meal was ingested. Eating a high carb meal between the intervention did not produced any alteration. But, eating a high fat meal cut the decrement in rectal temperature in half.

Thyroid hormones are responsible for basal metabolic rate and heat production.

So, if a high saturated fat diet maintains body temperature better than a high carbohydrate diet when the body is subjected to cold, it would seem fair to assume that the thyroid functions better on this high saturated fat diet.

Conclusion

A diet with sufficient but not excess protein, moderate carbohydrate comprising a minority of calories, and high intake of saturated and monounsaturated fat but low intake of polyunsaturated fat would seem to be optimal for thyroid function. But this is the Perfect Health Diet!

References:

[1] Anthony Colpo. Is a Low Carb Diet Bad For Your Thyroid?.  http://anthonycolpo.com/?p=1743

[2] Volek JS et al. Body composition and hormonal responses to a carbohydrate-restricted diet. Metabolism. 2002 Jul;51(7):864-70. http://pmid.us/12077732

[3] Danforth E Jr et al. Dietary-induced alterations in thyroid hormone metabolism during overnutrition. J Clin Invest. 1979 Nov;64(5):1336-47. http://pmid.us/500814

[4] Ullrich IH et al. Effect of low-carbohydrate diets high in either fat or protein on thyroid function, plasma insulin, glucose, and triglycerides in healthy young adults. J Am Coll Nutr. 1985;4(4):451-9. http://pmid.us/3900181

[5] Vazquez JA et al. Protein metabolism during weight reduction with very-low-energy diets: evaluation of the independent effects of protein and carbohydrate on protein sparing. Am J Clin Nutr. 1995 Jul;62(1):93-103. http://pmid.us/7598072

[6] Vazquez JA et al. Protein sparing during treatment of obesity: ketogenic versus nonketogenic very low calorie diet. Metabolism. 1992 Apr;41(4):406-14. http://pmid.us/1556948

[7] Whole Health Source. Vegetable Oil and Weight Gain. http://wholehealthsource.blogspot.com/2008/12/vegetable-oil-and-weight-gain.html

[8] Danforth E Jr, Burger A. The role of thyroid hormones in the control of energy expenditure. Clin Endocrinol Metab. 1984 Nov;13(3):581-95. http://pmid.us/6391756

[9] Cavaliere H et al. Serum levels of total testosterone and sex hormone binding globulin in hypothyroid patients and normal subjects treated with incremental doses of L-T4 or L-T3. J Androl. 1988 May-Jun;9(3):215-9. http://pmid.us/3403362

[10] Kumar A et al. Hypoandrogenaemia is associated with subclinical hypothyroidism in men. Int J Androl. 2007 Feb;30(1):14-20. Epub 2006 Jul 24. http://pmid.us/16879621

[11] Akin F et al. Growth hormone/insulin-like growth factor axis in patients with subclinical thyroid dysfunction. Growth Horm IGF Res. 2009 Jun;19(3):252-5. Epub 2008 Dec 25. http://pmid.us/19111490

[12] Soliman AT et al. Linear growth, growth-hormone secretion and IGF-I generation in children with neglected hypothyroidism before and after thyroxine replacemen. J Trop Pediatr. 2008 Oct;54(5):347-9. Epub 2008 May 1. http://pmid.us/18450819

[13] Stanická S et al. Insulin sensitivity and counter-regulatory hormones in hypothyroidism and during thyroid hormone replacement therapy. Clin Chem Lab Med. 2005;43(7):715-20. http://pmid.us/16207130

[14] Dittrich R et al. Thyroid hormone receptors and reproduction. J Reprod Immunol. 2011 Jun 3. http://pmid.us/21641659

[15] Krassas GE et al. Thyroid function and human reproductive health. Endocr Rev. 2010 Oct;31(5):702-55. Epub 2010 Jun 23. http://pmid.us/20573783

[16] Carani C et al. Multicenter study on the prevalence of sexual symptoms in male hypo- and hyperthyroid patients. J Clin Endocrinol Metab. 2005 Dec;90(12):6472-9. Epub 2005 Oct 4. http://pmid.us/16204360

[17] Bandini LG et al. Metabolic differences in response to a high-fat vs. a high-carbohydrate diet, Obes Res. 1994 Jul;2(4):348-54. http://pmid.us/16358395

[18] Mitchell HH, Glickman N, et al. The tolerance of man to cold as affected by dietary modification; carbohydrate versus fat and the effect of the frequency of meals. Am J Physiol. 1946 Apr;146:84-96. http://pmid.us/21023298

[19] Mitchell HH, Glickman N, et al. The tolerance of man to cold as affected by dietary modifi-cation; proteins versus carbohydrate and the effect of variable protective clothing. Am J Physiol. 1946 Apr;146:66-83. http://pmid.us/21023297

[20] Smith RE et al. Metabolism and cellular function in cold acclimation. Physiol Rev. 1962 Jan;42:60-142. http://pmid.us/13914396


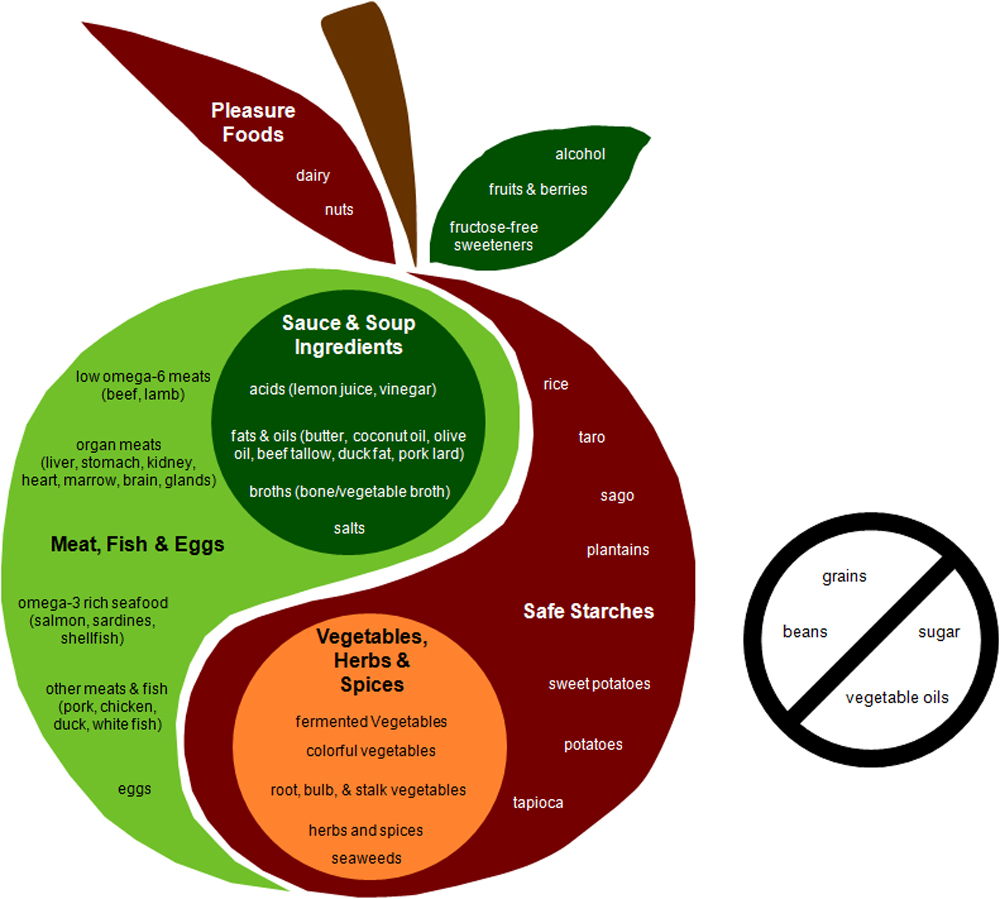
About the Food Plate

Thanks to everyone who gave us advice on the Perfect Health Diet food plate:

It’s very helpful to hear your thoughts. I thought I’d respond here.

Supplements

Garymar asks “where are the supplements?” Perhaps this was tongue in cheek, but it’s a fair question. To be honest it never occurred to us to put supplements in, as the graphic was meant to address the question “How do I construct a meal [or a day’s food]?”

That said, I notice the Harvard Healthy Eating Pyramid features a multivitamin plus vitamin D. Moreover the base of their pyramid has “Daily Exercise & Weight Control” sections! So there is a precedent.

On the other hand, they consider beef, rice, and potatoes foods to “Eat Sparingly,” and wheat as foundational, so I’m not sure they’re a good model.

YinYang

Kirk thought our diet is unbalanced toward fat, and so a symbol indicating balance was inappropriate. However, foods and macronutrients are different things; fat can come from plants (coconut oil, olive oil) as well as animals. Moreover, the plate is oriented toward meal construction, ie food, not nutrients.

Michelle, for one, was unsure how to relate macronutrients to food:

I am a reader who never quite caught on to how much of every macronutrient I should be eating in order to be PHD compliant.

Upon reading the book, I could not picture how much “400-600 carb calories” were, or “200 protein calories”.

One purpose of the food plate is to help solve this problem. Kirk himself took the correct inference from the diagram:

To my eye, the proposed diagram insinuates there should be equal servings of meat/fish/eggs/sauces/soups as balanced with servings of vegs/herbs/spices/safe-starches.

Yes! Because the plant foods we recommend have 100 to 600 calories per pound, while the animal foods and fats have 600 to 3,500 calories per pound, a diet that obtains most calories from animal foods can still get most of its matter from plant foods. As Gary pointed out:

On a high fat diet, the quantity of fat looks small compared to the quantity of vegetables.

Our diet really is fairly balanced between the food groups.

Our thanks to those who stuck up for the symbol, including Pam (“I like the yin-yang symbol a lot! i believe this is meant for portion (volume) right?”) and especially Ellen, who is an authority:

I like the use of the Taiji symbol…. I did not think it was meant to convey equal amounts of each food group as much as the *concept* of balance (and change) over all. This, in spite of having studied (with Master Jou among others) and taught Taji.

Artistry

Beth had a number of great suggestions. One was to merge the “Do Not Eat” foods into the apple by putting them in the apple’s shadow. In fact, we do have an apple with a shadow, and that might work well.

Erp suggested a snake (carrying the apple as in Genesis) or a worm coming out of the apple to represent forbidden foods. Sorry, erp, doesn’t sound appetizing!

Howard suggested we use the Zone Diet plate as a model. This is interesting because it actually has 3 plates, showing a 3-part strategy for constructing a meal. This “dynamic” imagery is something to consider.

Paul A had an excellent suggestion:

Nitpicky comment: wouldn’t it be more intuitive to have meats in the red section and plants in the green?

Yes. Another aspect we hadn’t thought of: in Chinese theory, most plant foods are considered “yin” (thus belonging on the left) and meat, fish and eggs as “yang” (on the right).

Next question: If we’re moving Safe Starches to the left and Meats to the right, would this be interpreted as a “farewell to Paleo”?

Are the “Pleasure Foods” too small?

Bethany asked if dairy was such a small part of the diet? The same could be asked for fruits and berries. (Mallory said, “I like fruits more than your plate does.” So do we, Mallory!) Or even for the “fructose-free sweeteners,” such as rice syrup, which are as fundamentally benign as the safe starches they are derived from.

Maybe we need to add more leaves to the apple stem. Especially if we take up erp’s suggestion to devote the stem to the chocolate food group!

On a related matter, Dale asked why sugar was excluded:

I like it … except for the no sugar part. People are going to eat it anyway so why not be sensible and suggest it in moderation?

Well, we support fruit, berries, and starch-derived sweeteners such as rice syrup. We’ve got ways to satisfy a sweet tooth. Is there really a rationale for including table sugar in a diet? I’m sure everyone will eat sucrose from time to time, but why should we endorse it?

Right Amount and Kind of Information?

Ellen thought we could include more information:

This might be too wordy, but perhaps you could indicate the range under the sections, i.e. meat, eggs, fish (1/2 to 1 lb/day).

MarkES (“a simple visual of food proportions when people look at their own plates”) and Erik (“I also agree with some of the other posters that there are too many words”) wanted less information. Mike Gruber was in the same camp:

Just a quick visual comparison between your chart and the competition leaves me with the impression that yours has too many words … will people read them? A chart is supposed to summarize something, and the more briefly the better.

This is an issue with no perfect solution. I don’t think we can put all information in the apple, and there will usually be some companion text that provides deeper explanations. But I don’t think we need to go quite so kindergartenish as the USDA Food Plate.

Michelle thought we might have missed the most important point of all:

[O]ur message at home is Eat Real Food, & Avoid Food Toxins. I’m not sure a glance at the PHD food plate would help them make sense of what to eat, in practical terms.

Hmmm. I had hoped the text made clear what desirable “Real Foods” and forbidden “Toxin-Rich Foods” were. Is there a better way to communicate the use of real foods? Perhaps little food images would work better than text.

A possible defect of including representative foods in text is that someone might mistakenly infer that un-named foods are forbidden. Hilary asks:

Should lime juice be included? Should yams be included on the list of safe starches?

Those are fine foods, but I don’t want the apple-plate to contain a laundry list of foods. The listed foods are representative — similar foods may also be eaten.

Conclusion

You’ve certainly given us food for thought — and ideas for desirable revisions. Thanks much!