Category Archives: Diets - Page 9

The PHD Food Plate

We thought we’d skip our usual food post today and instead ask for your opinion on the first draft of our Perfect Health Diet Food Plate.

But first, a few links. At the Ancestral Health Symposium Shou-Ching and I were delighted to meet Josephine and Henry Svendblad, who run the excellent Nutty Kitchen. We’ve been fans of Josephine and Henry since we first discovered their blog a year ago, and the respect is mutual. They told us that they’ve been tagging some of their recipes with a “Perfect Health Diet” tag. (Also their “Paleo 2.0” tagged dishes are PHD-compliant. Actually, everything at their site is PHD-compliant as far as I can tell.) It’s a great source for recipe ideas.

Also, our regular commenter Gary has created a site with easy, quick Perfect Health Diet recipes at his site, 10 Minute Meal. He explained in a recent comment:

I get enthusiastic about PHD and tell my friends about it, but the most frequent response I’d get was that it may be great, but it means home cooking everything. I’d counter that home cooking isn’t hard. So finally I set up a small website that shows how I’ve done my own interpretation of a PHD meal plan and the home cooking that make it possible to do it during the week, working 50-hour weeks and making 2 or 3 meals a day for me and my spouse.

If ten minute meals are what you’re looking for, check out Gary’s site.

Our Food Plate

The US government introduced its food plate earlier this year:

It seems a little simple, even for the US government.

We wanted to see if we could do better. Here’s our first draft (click to enlarge):
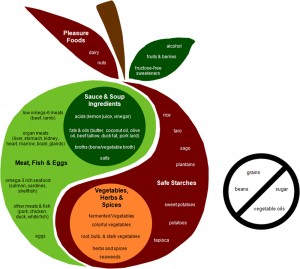
We’re very interested in your reaction. Does it give an accurate idea of the diet? How would you improve it?

Gary Taubes and Stephan Guyenet: Three Views on Obesity

In a post titled “Ancestral Health Symposium Drama”, Stephan Guyenet begins to expound his scientific differences with Gary Taubes.

Since my views differ a bit from both Stephan and Gary, I thought readers might enjoy a third view.

My General Perspective on Obesity

My view is that obesity is caused in the first place by malnutrition, toxins, and infections. Each can contribute in multiple ways:

  • Malnutrition can affect appetite and energy utilization. Micronutrient deficiencies will increase appetite, regardless of energy balance. Macronutrient deficiencies may also do this. The resulting increased calorie intake may be only partially balanced by increased activity and thermogenesis; fat gain in caloric surplus tends to be more weakly opposed by brain regulatory circuits than muscle loss during caloric deficit. Malnutrition can impair energy utilization by several pathways: for instance, loss of mitochondrial antioxidants may lead to oxidative damage that impairs mitochondrial health. Choline deficiency induces metabolic syndrome and obesity (see Choline Deficiency and Plant Oil Induced Diabetes, Nov 12, 2010). Long-term, malnutrition may induce methylation defects which affect epigenetic regulation of metabolism. These can be passed on from mother to child.
  • Toxins also have multiple pathways by which they induce obesity. For example, diets that combine fructose or alcohol with polyunsaturated fats are very effective at producing metabolic syndrome and obesity in animals, and food opioids affect the endocannibinoid pathways which can be important in obesity and appetite regulation. See Why We Get Fat: Food Toxins (Jan 20, 2011) and Wheat and Obesity: More from the China Study (Sep 4, 2010) for more.
  • Infections have also been linked to obesity. I’ve blogged about how adenovirus infections of adipose cells promote obesity (Obesity: Often An Infectious Disease, Sep 22, 2010), but another very important pathway is from gut infections to obesity. Briefly, gut pathogens release fat-soluble toxins which can enter systemic circulation, and also modulate immune function. Toxins from pathogens have been shown to induce metabolic syndrome in the liver, promoting obesity. Via the immune system, gut flora can promote obesity. I’ve briefly mentioned one pathway (in Thoughts on Obesity Inspired by Stephan, Jun 2, 2011): gut immune modulation in the gut has been shown to determine whether adipose tissue macrophages are in a pro-inflammatory or anti-inflammatory state. A pro-inflammatory state promotes obesity. Research into the many ways gut flora influence obesity is in early stages, but it’s clearly important.

Due to the diversity of factors which conspire to cause obesity, it is a rather heterogeneous disease. Its unifying character is that some combination of causal factors induces “metabolic damage,” such as leptin resistance, in a variety of organs, including the brain. Metabolic damage can affect both appetite regulation and energy homeostasis.

I’ve discussed Stephan’s views and food reward theory (Thoughts on Obesity Inspired by Stephan, Jun 2, 2011). Food reward theory offers a plausible explanation for many aspects of obesity. I agree that food reward is an important factor in obesity, but consider it one among several factors, and believe that different factors may dominate in different people. Also, it seems likely to me that food reward becomes a dominant factor in obesity only after some form of metabolic damage from malnutrition, toxins, or infections begins to affect the brain’s regulatory systems. In a healthy person a highly palatable diet might have little effect on weight for quite some time. Nor am I convinced that low food reward diets are necessarily the best approach for long term weight loss or for the health of the obese, though I do believe they are great for short-term weight loss.

Distinguishing my view from Stephan’s is difficult because the obesity-inducing diets used in animal studies are generally both toxic and malnourishing and highly palatable. The “cafeteria diet” of Cheetos and such – rich in wheat, sugar, and vegetable oil – is an example.

I haven’t previously blogged about Gary’s views, but I consider very low carb dieting to be an imperfect solution for good health generally. (NB: Low-carb, which I endorse, is for me 400-600 carb calories, very low-carb, which I deprecate, is <200 calories.) Ketogenic diets may be beneficial in some cases of obesity, but I believe they should still include some starchy carbohydrates.

The Exchange

Stephan has transcribed the Q&A between Gary and himself and offers revised answers. I’ll insert my thoughts:

GT: How does your food reward hypothesis hypothesis explain a culture in which mothers are obese and their children are starving?  Are the mothers eating Snickers bars and not sharing them with their children?

SG: The food reward/palatability hypothesis of obesity is not mine, it’s a hypothesis that originated in the 1970s, perhaps earlier, and is a major subject of ongoing obesity research.  I don’t expect it to explain every instance of obesity.  Obesity involves multiple factors, an important one of which is food reward and palatability.  That being said, you have to examine a culture’s food habits in some detail, both before and after a change in obesity prevalence, to determine if reward/palatability may have played a role.  I don’t know enough about that specific culture to judge whether food reward would have played a role there.

PJ: Famines occur in impoverished societies with disrupted social institutions. People in these cultures are driven to eat the cheapest calories, which are the toxic grains such as wheat. They also tend to be malnourished, especially during famines. Malnutrition and toxic foods can create the disease of obesity, especially in a suitable infectious disease context.  Once the disease of obesity is induced, periods of caloric availability lead to weight gain which may be defended during subsequent famines. This explains maternal obesity persisting during a period of food scarcity. The slenderness of their children is a result of the disease process not having had enough time to work. It may take decades for malnutrition and food toxicity to induce obesity in the child.

So the element of long-acting causal factors and history eliminates the apparent conflict between an obese mother and a starving slender child.

Because food reward could induce obesity in the mother prior to the famine which is defended later, and food reward may act differently in growing children, food reward theory may be able to explain the situation. But Stephan prudently allows for the possibility that other causes of obesity besides food reward may be at work.

GT: The Pima indians were obese in 1902, following 20-30 years of famine.  How would your theory explain this?

SG: The Pima were first contacted in 1539 by the Spanish, who apparently found them to be lean and healthy.  At the time, they were eating a high-carbohydrate, low-fat diet based on corn, beans, starchy squash, and a modest amount of gathered animal and plant foods from the forest and rivers in the area.  In 1869, the Gila river went dry for the first time, and 1886 was the last year water flowed onto their land, due to upstream river diversion by settlers.  They suffered famine, and were rescued by government rations consisting of white flour, sugar, lard, canned meats, salt and other canned and processed goods.  They subsequently became obese.  Their diet consisted mostly of bread cooked in lard, sweetened beverages and canned goods, and they also suddenly had salt.  I don’t see why that’s incompatible with the food reward hypothesis.  It is, however, difficult to reconcile with the carbohydrate hypothesis.

PJ: The Pima Indian story seems compatible with both Stephan’s and my views, since they ate a nourishing, low-toxicity, low-food reward diet when they were lean but a malnourishing, toxic, high-food reward diet when they became obese. It seems incompatible with Gary’s ideas, since the Pima ate a high-carb diet at all times. Thus it’s a bit surprising Gary is so fond of the Pima story. It weakens, not helps, his case.

GT: There are two possible hypotheses here.  The alternative hypothesis is that sugar and refined carbohydrate consumption changes the regulation of fat tissue, leading to obesity.  The studies you cited in which people lost weight by consuming bland liquid diets would have been low in sugar as well.  “We need an observation that can refute one of the two hypotheses”.

SG: The bland liquid diet in Hashim et al. that caused massive weight loss is called “Nutrament”.  It is 50% carbohydrate, 30% fat and 20% protein.  The primary three sources of carbohydrate in this formulation are lactose (from milk), sucrose (table sugar) and corn syrup.  The bland liquid used in the study by Cabanac et al. (Renutryl), which also caused weight loss, was high in refined glucose and sucrose.  I find this rather difficult to reconcile with the idea that sugar and refined carbohydrate are inherently obesogenic.

PJ:  It’s unclear to me what Gary’s “alternative hypothesis” is. Why are refined carbohydrates different from unrefined carbohydrates? Both may raise blood glucose and insulin levels similarly. If toxic plant foods are the problem, then he should say toxins rather than carbohydrates are the problem. If it’s the macronutrient that’s the problem, why does refining matter?

Stephan scores a point against both Gary and me here, but especially against Gary, since the liquid diets are fairly high in carbs. As there was some sucrose and polyunsaturated fat, this was not a non-toxic diet, and I don’t know if adequately micronutrients were provided – probably not – but on its face the food reward theory seems to work best in explaining this experiment.

GT: “How was it bland then?”

SG: The diet was a liquid formulation that (judging by the ingredients) probably tastes like powdered milk.  The subjects were drinking that for 100% of their calories.  That fits any reasonable definition of a low reward/palatability diet, regardless of the sugar.

GT: What about the Mexican-Americans in Star county, Texas, who were obese despite the fact that there was only one restaurant in the whole town?

SG: Again, you have to examine a culture’s food habits in some detail, both before and after a change in obesity prevalence, to determine if reward/palatability may have played a role.  I don’t know enough about that specific culture to judge whether food reward would have played a role there.

GT: How can we differentiate between altered palatability and altered carbohydrate intake as important factors in the rising obesity prevalence of industrializing nations?

SG: Increased carbohydrate intake is a particularly poor explanation for obesity in industrializing populations, as the majority of them (for example, most of Asia and Africa) are going from a diet very high in carbohydrate, to one that is lower in carbohydrate and higher in fat.  There are also a smaller number of cultures that developed obesity as they went from high-fat to higher carbohydrate, industrialized food.  Therefore, the ideas that carbohydrate or fat are inherently fattening don’t appear consistent with the evidence as a whole.  An alternative explanation whereby both fat and carbohydrate, as well as other factors, are important for reward/palatability, an excess of which contributes to obesity, fits the evidence better.

PJ: It seems to be easiest to induce obesity with a roughly equal mix of carbs and fat; both low-carb and low-fat diets tend to be less obesogenic. This result is compatible with Stephan’s views because carb and fat together are more rewarding than either alone, and with my views because carb-fat combinations can be highly toxic – for instance, a fructose-PUFA combination is more toxic than either alone; or carbs feed gut pathogens while fats carry their toxins into the body.

It is unclear how Gary would explain the evidence from both animal studies and human populations that obesity becomes more likely as high-carb diets shift toward more fat.

Of Glass Houses

Stephan is a model of scholarly virtue, so Gary’s challenge at the end of his talk was a shock. I thought Stephan’s original reply – “Thank you for the advice” – was perfect, but Stephan revises it:

GT: “I would just recommend in the future you should pay attention to populations that might refute your hypothesis rather than just presenting populations that support.  That’s always key in science.”

SG: People who live in glass houses shouldn’t throw stones.

Presumably Stephan is challenging Gary to address some of the populations who seem to refute his hypothesis: Asian populations that have become more obese while dropping carbs from 75% to 50% of diet, or the Pima who remained lean on a high-carb diet for centuries.

In other words, to seek a theory that can explain all phenomena, as a scientist should.

In general, I find Gary’s work rhetorically artful but not very helpful to scientific progress. He often neglects to consider the full implications of his own evidence. This is especially true when he ventures into molecular and cellular biology.

For instance, he uses genetic lipodystrophies to illustrate that fat storage can be a disease of molecular biology, rather than excess food consumption. Now, the mutations in these lipodystrophies are generally not in insulin, the insulin receptor, or even centrally located on insulin pathways. So the lipodystrophies show that other molecules besides insulin can be responsible for fat storage (or negative regulation of fat storage), and may be relevant to obesity.

But when he looks into which molecules might be responsible for obesity, he offers only one candidate: insulin.

More startling is his neglect of perhaps the single most important molecule in obesity, leptin. Stephan writes:

[H]e sent me a manuscript for his book Why We Get Fat and asked for my advice prior to its publication.  I explained to him that he needed to use the word “leptin” in the book, particularly when discussing animal models of obesity that are obese because of defects in leptin signaling (ob/ob mice and Zucker rats, for example).

This is just like his use of lipodystrophies: mice get obese due to mutations in leptin, but he doesn’t discuss the role of leptin, preferring to keep the spotlight on insulin.

I don’t want to sound harsh because I think Gary is on the side of the angels. He has done very beneficial work refuting saturated-fat-phobia and encouraging low-carb diets, which improve the health of nearly all westerners who adopt them (although the reason is probably reduced toxicity from wheat and sugar, rather than reduced carbohydrate calories).

But I think he would do well to be more generous to others. I was excited when he began blogging, but disappointed by his first post:

conventional wisdom … almost incomprehensibly naïve and wrong-headed … nonsensical notion … I’ve been consistently amazed at the ability of researchers … to accept some of the rote ideas … without seemingly giving it any conscious thought whatsoever, or without wanting to ask the kinds of questions that a reasonably smart junior high school student should ask if given the opportunity…. I don’t understand this failure of intellect … nonsensical explanations … he falls short, as he’s working outside his area of expertise … we’re being fed nonsense … we will typically pass that nonsense along … If the experts had ever been open to a little skeptical thinking from others or had they been appropriately skeptical themselves … What’s been needed (and still is) was for someone (a reasonably smart 14-year-old would suffice) to ask the obvious questions and then insist on intelligent answers.

I find such talk ungenerous; and ironic, because in places in that very post Gary’s own reasoning is unsound.

Biology is complex, none of us have all the answers, and a lifetime is too short to acquire all the answers. Since we have no choice but to live in glass houses, we should all be humble, and refrain from casting stones.

Serum Cholesterol Among Hunter-Gatherers: Conclusion

So far we’ve looked at serum cholesterol among Eskimos/Inuit (Serum Cholesterol Among the Eskimos and Inuit, July 1, 2011) and !Kung San bushmen (Serum Cholesterol Among African Hunter-Gatherers, July 5, 2011). The Inuit, who live in the Arctic and eat a high-fat low-carb diet, generally had serum TC over 200 mg/dl unless parasitic diseases were common and life expectancy was short. The !Kung San, who live in sub-Saharan Africa and eat more carbs, were below 160 mg/dl and ridden with parasitic diseases and short life expectancy.

I thought I’d wrap up the hunter-gatherer cholesterol series by looking at some tropical populations outside Africa. These peoples may help us evaluate the merit of several explanations that have been put forth for variations in serum cholesterol:

  • Genetic differences. Africans tend to have lower cholesterol than non-Africans, wherever they live. Is the difference genetic? Chris Masterjohn believes genetic differences might account for up to a 30 mg/dl difference in TC. Emily Deans suggests LDL receptor variants are the most important alleles.
  • Dietary differences such as fat intake. For decades it was said that higher fat diets produce higher TC, and this was the favored explanation for variations in serum cholesterol. However, when these ideas were tested in clinical trials, diet-induced changes in TC were inconsistent.
  • Infectious disease burden. Eukaryotic pathogens such as protozoa, worms, and fungi – ie, pathogens that have mitochondria and therefore can metabolize fat and ketones – are often able to take up human lipoproteins from blood and use their fats and cholesterol for their own purposes. This tends to lead to low TC in people with a high burden of parasites. Is parasite burden the key to hunter-gatherer cholesterol levels?

We started this detour (see Did Hunter-Gatherers Have Low Serum Cholesterol?, June 28, 2011) to evaluate the claims of S. Boyd Eaton, Loren Cordain, and collaborators [1], [2], [3], [30]. Their papers tended to promote the following syllogism:

  1. Diet determines TC.
  2. Low TC is healthy.
  3. Hunter-gatherers had low TC.
  4. Therefore, hunter-gatherer diets are healthy.

So to conclude today’s post, I’ll review: Which of these four theses is supported by the data?

Australian Aborigines

There are a fairly large number of papers on cholesterol levels in Australian aborigines. Unfortunately, the vast majority are from journals, such as the Medical Journal of Australia and the Australian and New Zealand Journal of Medicine, to which I don’t have electronic access.

Therefore I’ll just cite one, a 1957 paper from Schwartz et al in the Australian Journal of Experimental Biology and Medical Science. [31]

This paper looked at aborigines from central Australia. Occupying marginal territory, they were still living a hunter-gatherer lifestyle. But there weren’t many animal foods available, nor seafoods:

The animal fat intake of the Central Australian aborigines from the Haast’s Bluff region involved in this present study is decidedly low when compared with the average intake of white Australians. This low intake of fat results both from a scarcity of fat itself, and also from demands made upon available supplies by native customs. It is likely that the males eat more animal fat than the females, because of their readier access to it after hunting, but the difference is probably small. Wichitty grubs (larvae of several species of Xyleutes moths) are an important source of fat for both women and children, however. Somewhat less than 10 p.c. of the calories in the aboriginal diet is derived from animal fat, i.e. less than one-third of the calories so derived in the white Australian diet (N. B. Tindale, personal communication). [31]

To get even 10% of calories from animal fat, they had to eat a lot of grubs.

So did this low-fat diet produce high or low cholesterol?

Serum cholesterol: … There is no significant difference between the mean values for aboriginal male (217.0 mg/dl) and aboriginal female (207.9 mg/dl). [31]

This is right in line with the levels in Eskimos and Inuit, and in the minimum mortality range of 200 to 240 mg/dl.

Australian aborigines were said to have a mean TC of 146 mg/dl (male) and 132 mg/dl (female) in Eaton et al [1]. Australian aborigines were deleted from the list of hunter-gatherers with low cholesterol in a subsequent Cordain et al paper [2]. I don’t know why this was, but I can say that at least some Australian aboriginal populations had TC over 200 mg/dl.

Kitavans

Kitavans preserved their hunter-gatherer lifestyle until recently, and Staffan Lindeberg and colleagues were able to assess cholesterol levels using modern procedures. They reported serum total cholesterol in men of 4.7 mmol/l (182 mg/dl) and in women of 6.1 mmol/l (236 mg/dl), for a male-female average of 5.4 mmol/l (209 mg/dl). [32]

Health in Kitava was generally good, although life expectancy was only 45 years [33]. Causes of death were infectious disease (notably malaria) and accidents such as drowning and falling from coconut trees.

So we have another tropical, high-carb population with normal (200 to 240 mg/dl) serum cholesterol.

New Zealand Maoris

New Zealand Maoris are probably genetically similar to Australian aborigines and Kitavans. I didn’t survey the literature on New Zealand Maoris. However, I did come across one paper [35] that led me to an interesting 1980 study of Maoris by Dr Robert Beaglehole [36].

The study was quite simple:

The relation between serum cholesterol concentration and mortality was studied prospectively over 11 years in 630 New Zealand Maoris aged 25-74. Serum cholesterol concentration was measured at initial examination in 1962-3 in 94% of the subjects and whether each was dead or alive was determined in 1974. The causes of death were divided into three categories: cancer, cardiovascular disease, and “other.” [36]

Mean serum cholesterol was 5.50 mmol/l (213 mg/dl) among women, 5.82 mmol/l (225 mg/dl) among men, for a population mean of 219 mg/dl.

Dr Beaglehole found that mortality increased as serum cholesterol decreased. Mortality was 40% to 70% higher in Maoris with TC of 160 mg/dl than in Maoris with TC of 260 mg/dl.

The association with cancer mortality was strongest: cancer mortality was 9.6% among the low-TC group (TC < 5.1 mmol/l = 197 mg/dl), 5.8% among the medium-TC group, and 3.5% among the high-TC group (TC > 5.8 mmol/l = 224 mg/dl).

West Malaysian aborigines

Just to balance the above studies I looked for a paper showing low serum cholesterol in an aboriginal population. I found a 1972 paper by Burns-Cox et al studying aborigines in West Malaysia. [37]

Like other traditional populations living active lives, these aborigines were lean and free of heart disease. They ate a high-carb diet:

Coronary heart disease has never been found in Malaysian aborigines. We report the position regarding some of the risk factors usually associated with coronary heart disease in 73 adult aborigine men.

They lived a physically active life on a diet largely of unrefined carbohydrate in the jungles of central West Malaysia. None was obese and blood pressures remained low at all ages. [37]

Their serum cholesterol levels were low – 141 to 156 mg/dl:

While the mean serum cholesterols were low, varying between 141 and 156 mg/100 ml at different ages, the mean fasting serum triglyceride levels of 135 to 164 mg/100 ml were comparable with those found in the West. This may have been due to their high carbohydrate intake. [37]

They were mostly healthy – except that they were infested with intestinal worms and malaria:

The aborigines are thin, extremely fit physically, and for many centuries have lived in the dense hilly jungles of central West Malaysia. They have a high rate of infestation with intestinal worms and malaria but appear well nourished. Their diet consists chiefly of hand-milled rice as a staple, supplemented with cassava, millet, maize, fish, and fruit, nearly all of which they grow or gather themselves. Dairy produce is taken only in very small quantities in the form of reconstituted powdered milk and it is the large volume of starchy foods which accounts for their bulky diet. [37]

Once again, we find that low serum cholesterol is associated with a high burden of eukaryotic pathogens.

Another feature that this population shares with the !Kung San is small stature. Mean averaged 5’1” (155 cm) in height and averaged 105 lb (48 kg) in weight.

Conclusion

Let’s look at the four parts of the syllogism I’ve attributed to Eaton and Cordain:

Diet determines TC. Wrong. It looks like burden of parasites is the major determinant of serum cholesterol in hunter-gatherers and human populations globally.

Low TC is healthy. Wrong. It is associated with high infectious burden, small stature, high mortality, and short lifespan.

Hunter-gatherers had low TC. Some did, some didn’t. So let’s look at a specific claim, this from the classic Cordain-Eaton paper from 2002, “The paradoxical nature of hunter-gatherer diets: meat-based, yet non-atherogenic” (thanks, Rob!):

Over the past 64 y, anthropological research has consistently demonstrated relatively low serum cholesterol and triaglycerol levels among indigenous populations that derive the majority of their diet from animal products. [30]

Wrong. Anthropological research has not consistently demonstrated low serum cholesterol and triglycerol levels from hunter-gatherers, regardless of whether the primary dietary source was animals (Eskimo/Inuit) or plants (Kitavans, Central Australian aborigines). Rather, those with high parasite burdens had low cholesterol, regardless of diet, and healthy populations without parasites had serum cholesterol over 200 mg/dl regardless of diet.

Therefore, hunter-gatherer diets are healthy. True! Except insofar as dietary practices, such as the Eskimo practice of eating raw intestines from recently killed animals, predisposed them to picking up parasitic infections.

Overall I think the data should dispose us to look toward infectious burden, rather than genetics or diet, as the primary determinant of serum cholesterol among hunter-gatherers. If genetic differences influence mean TC among hunter-gatherer populations, it is probably because of evolutionary adaptations to local pathogens, such as the heavy parasite burden in sub-Saharan Africa.

Related Posts

The posts in this series are:

References

[1] Eaton SB, Konner M, Shostak M. Stone agers in the fast lane: chronic degenerative diseases in evolutionary perspective. Am J Med. 1988 Apr;84(4):739-49. http://pmid.us/3135745. Full text: http://www.direct-ms.org/pdf/EvolutionPaleolithic/EatonStone%20Agers%20Fast%20Lane.pdf

[2] O’Keefe JH Jr, Cordain L, Harris WH, Moe RM, Vogel R. Optimal low-density lipoprotein is 50 to 70 mg/dl: lower is better and physiologically normal. J Am Coll Cardiol. 2004 Jun 2;43(11):2142-6. http://pmid.us/15172426.

[3] Konner M, Eaton SB. Paleolithic nutrition: twenty-five years later. Nutr Clin Pract. 2010 Dec;25(6):594-602. http://pmid.us/21139123. Full text: http://ncp.sagepub.com/content/25/6/594.full.

[30] Cordain L et al. The paradoxical nature of hunter-gatherer diets: meat-based, yet non-atherogenic. Eur J Clin Nutr. 2002 Mar;56 Suppl 1:S42-52. http://pmid.us/11965522.

[31] Schwartz CJ et al. Serum cholesterol and phospholipid levels of Australian aborigines. Aust J Exp Biol Med Sci. 1957 Oct;35(5):449-56. http://pmid.us/13499168. Full text: http://www.nature.com.ezp-prod1.hul.harvard.edu/icb/journal/v35/n5/pdf/icb195747a.pdf.

[32] Lindeberg S et al. Cardiovascular risk factors in a Melanesian population apparently free from stroke and ischaemic heart disease: the Kitava study. J Intern Med. 1994 Sep;236(3):331-40. http://pmid.us/8077891.

[33] Lindeberg S et al. Age relations of cardiovascular risk factors in a traditional Melanesian society: the Kitava Study. Am J Clin Nutr. 1997 Oct;66(4):845-52. http://pmid.us/9322559.

[35] Walker AR. Cholesterol and mortality rates. Br Med J. 1980 May 31;280(6227):1320. http://pmid.us/7388525.

[36] Beaglehole R et al. Cholesterol and mortality in New Zealand Maoris. Br Med J. 1980 Feb 2;280(6210):285-7. http://pmid.us/7357343. Free full text: http://www.ncbi.nlm.nih.gov/pmc/articles/PMC1600122/?tool=pubmed.

[37] Burns-Cox CJ et al. Risk factors and the absence of coronary heart disease in aborigines in West Malaysia. Br Heart J. 1972 Sep;34(9):953-8. http://pmid.us/4116420.

Serum Cholesterol Among African Hunter-Gatherers

We’re in the midst of a little diversion looking at the cholesterol levels of hunter-gatherers around the world. This investigation was precipitated by the surprising claim by some Paleo authorities that hunter-gatherers had much lower cholesterol levels than any modern human population (Did Hunter-Gatherers Have Low Serum Cholesterol?, Jun 28, 2011).

We started by looking at Eskimos and Inuit (Serum Cholesterol Among the Eskimos and Inuit, July 1, 2011). We found that healthy Eskimo and Inuit groups seem to consistently have mean serum cholesterol between 200 and 230 mg/dl, with lower mean serum cholesterol levels found only in short-lived populations suffering from tuberculosis and parasite infections.

Today we’ll look at the populations with the lowest reported serum cholesterol levels: African hunter-gatherers. Africans made up 3 of the 5 groups claimed to have low serum cholesterol in the original Eaton et al paper [1] and 4 of the 5 in the later Cordain et al paper [2].

Cholesterol levels in modern Africans

Before looking at African hunter-gatherers, I think it’s worthwhile to look at modern Africans and African-Americans.

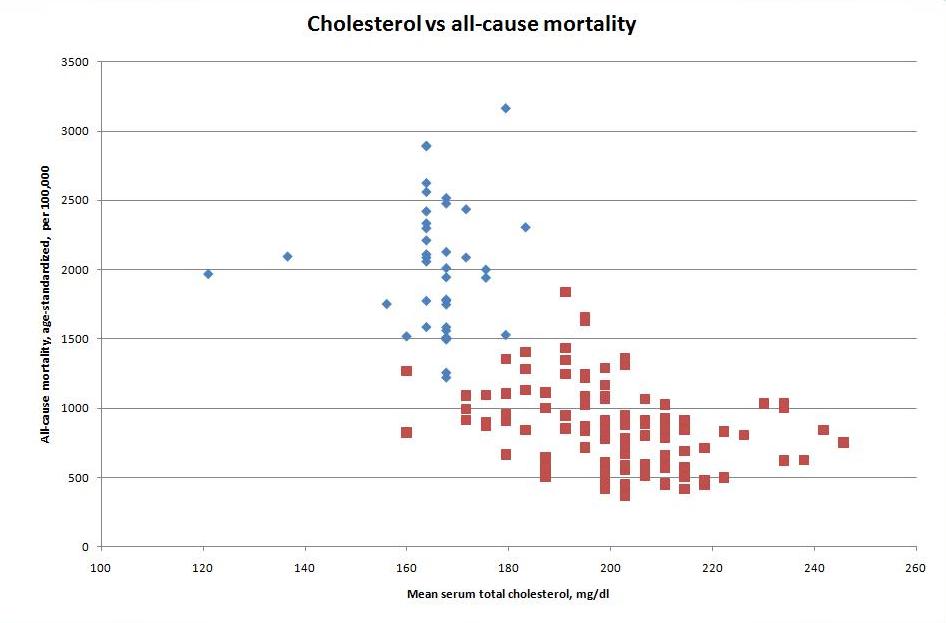
African nations have the lowest serum cholesterol levels and highest mortality levels in the world:

  • The 39 sub-Saharan African countries in O Primitivo’s cholesterol database have an average serum total cholesterol (TC) of 165.7 mg/dl (4.285 mmol/l). For comparison, the other 122 nations have an average serum TC of 201.1 mg/dl (5.20 mmol/l).
  • When the 161 countries in the database are ranked by mortality, sub-Saharan African nations occupy all but three of places 123 through 161. The non-African nations with highest mortality are Laos (#130), Cambodia (#131), and Haiti (#137). Haiti’s population is 95% of African descent, by far the largest African population share in the Americas. The only sub-Saharan African nations ranking above #123 are the island nations of Cape Verde, Comoros, and Sao Tome and Principe.

Here are the nations in O Primitivo’s database. Sub-Saharan African countries are in blue, others in red:

Sub-Saharan African TCs cluster around 165 mg/dl, while in the rest of the world varies much more widely but generally ranges between 170 and 240 mg/dl. The only countries outside sub-Saharan Africa with a mean TC below 170 mg/dl are Bangladesh and Tunisia.

Now, African-Americans. Here are mean serum cholesterol levels from the various NHANES studies:

Mean serum cholesterol levels (mg/dl) in Americans age 20-74 from NHANES

Group 1960-1962 1971-1974 1976-1980 1988-1994 1999-2000
All 222 216 215 205 204
Whites 222 216.5 214.5 205 205
Blacks 215.5 216.5 213 202.5 195.5
Hispanics 209 205 202.5

This table makes visibly clear the triumph of modern medicine: mean serum cholesterol levels have been heroically brought down from 222 mg/dl in 1960 to 204 mg/dl today.

This data is useful, because African-Americans eat a diet similar to that of other Americans. They are also, by global standards, fairly healthy. All-cause mortality in 2005-7 in Contra Costa, California (a quick search failed to bring up numbers for the US as a whole) was 683.9 per 100,000 for whites and 1002.7 for blacks (Source).

If we look above at O Primitivo’s data, a mortality of 1002.7 is lower than that of any sub-Saharan African nation and would suggest a TC around 195 mg/dl – right where African-Americans are today. White mortality of 683.9 would suggest a mean TC between 200 and 220 – right where white Americans are.

To me, this data suggests:

  • If there is a genetic difference in Africans that lowers cholesterol, it’s not large – probably less than 10 mg/dl.
  • Africans fit spot-on the cholesterol vs mortality curve established by non-African nations. So if there are genetic differences in Africans, they haven’t altered the mortality risk of low cholesterol levels.
  • In any ethnicity or race, low serum cholesterol indicates impaired health – probably due to infections – and higher mortality.

In interpreting the serum cholesterol of African hunter-gatherers, we should keep in mind this pattern. Low TC is probably only minimally a matter of genetics or diet. It’s primarily about infectious burden.

Now let’s look at African hunter-gatherer populations. Unfortunately, there is a paucity of data in Pubmed.

Hadza

A search in Pubmed for “Hadza cholesterol” produces one paper [4]. Unfortunately it dates from 1972 and electronic availability for that journal begins in 2001, so I was unable to read it.

Congo Pygmies

There are no papers in Pubmed searches for “pygmy cholesterol” or “pygmies cholesterol,” nor does “Congo cholesterol” return anything resembling a hunter-gatherer cholesterol study.

According to Wikipedia (“Pygmy peoples”), “The best known pygmies are the Aka, Efé and Mbuti of central Africa.” However, “Aka cholesterol,” “Efé cholesterol,” and “Mbuti cholesterol” return no results either.

!Kung San, Khoisan, Kalahari San, Bushmen

These people may be referred to by a variety of names, as Wikipedia (“Bushmen”) notes:

The indigenous people of southern Africa … are variously referred to as Bushmen, San, Sho, Barwa, Kung, or Khwe. These people were traditionally hunter-gatherers, part of the Khoisan group …

Searching on all these terms, I was able to find only a few reports on cholesterol levels, not all of whom were eating the hunter-gatherer diet. Here’s a summary.

Cholesterol Levels of San Bushmen

Paper [ref] Mean TC Notes
Miller et al 1968 [23] 77 mg/dl Stale samples, poorly preserved samples, “difficult” technique not normally used for cholesterol measurement
Truswell & Hansen 1968 [24] 110 mg/dl Stale unfrozen samples, obsolete technique
Bersohn & Tobias 1966 123 mg/dl Unknown technique; reported by Truswell & Hansen [24]; farm bushmen were 145 mg/dl.
Tichelaar et al 1992 [26] 143 mg/dl Semi-settled
van der Westhuyzen J et al. [21] 158 mg/dl Semi-settled

Early reports showed the lowest TCs. The one from Klara Miller and colleagues in the Archives of Internal Medicine of 1968 [23], is not available to me as full text, but this is the abstract:

Samples of the plasma from nine male adult bushmen were analyzed for their lipid content. The mean results obtained (total cholesterol = 77 mg/100 ml, phospholipids = 107 mg/100 ml, and triglycerides= 49 mg/100 ml) were extremely low. The probable reasons for this finding are the very low dietary fat content and habitually high physical activity of Kalahari bushmen. [23]

These numbers are extraordinarily low for both TC and serum phospholipids.

My other early source was a 1968 letter to Lancet by Truswell and Hansen [24] commenting on the Miller et al report:

SIR,-We can add some more data to the values for serum lipids in 9 Kalahari bushmen which you reviewed in your annotation (Aug. 17, p. 395). Our findings confirm that these hunter-gatherers have among the lowest serum-cholesterol levels in the world.

In October, 1967, and again in April-May this year we joined the Harvard social anthropologists De Vore and Lee to investigate the medical and nutritional state of the !Kung bushmen they have been studying in the northern Kalahari, Botswana. We collected venous blood from some of these bushmen. Sera were allowed to separate by clot-retraction and decanted into tubes containing a little dried methiolate solution. The sealed serum-tubes were kept in a portable gas refrigerator while we were in the desert and were carried with us in a cool box, with ice-packs, when we travelled back to Cape Town by jeep and plane. Cholesterol was measured by the standard Abell method.

The results of 67 determinations in 54 bushmen are shown in the accompanying table. The mean serum-cholesterol levels were between 100 and 121 mg. per 100 ml. The extreme range in individual bushmen was from 57 to 178 mg. per 100 ml. A Bantu control serum collected in the desert on our first visit contained 166 mg. cholesterol per 100 ml. Our own serum-cholesterol levels, taken on the second visit, were 184 and 219 mg. per 100 ml….

Our values agree very well with the mean serum-cholesterol level of 121 mg. per 100 ml. reported by Bersohn and Tobias [Tobias, P. V. in The Biology of Human Adaptability (edited by P. T. Baker and J. S. Weiner); p. 190. Oxford, 1966.] in nomadic bushmen in the central Kalahari. These workers found that farm bushmen had rather high serum-cholesterol levels, averaging 145 mg. per 100 ml.

The lower concentrations found by Miller et al., averaging 77 mg. per 100 ml., might have resulted from the more difficult quantitative method they used, involving recovery from thin-layer chromatographic plates or, as they suggest, from harsher conditions in the southern Kalahari….

Some bushmen in the northern Kalahari obtain milk from Herero tribesmen who manage to keep cattle and have now settled between the bushmen in the same area. The 5 Dobe adults who said they got moderate amounts of milk had a mean cholesterol of 130 mg. per 100 ml., compared with 108 mg. per 100 ml. in 5 who drank little milk, and 114 mg. per 100 ml. in the 10 who were eating pure bush food. Most of the bushmen’s dietary fat probably comes from nuts, such as mongongo or mangetti (Ricinodendron rautanenii), which Lee estimates to be the largest source of calories in the Dobe region. They contain 38-58% fat.’

It looks like we have 3 reported measurements in San hunter-gatherers: 77 mg/dl by Miller et al, about 110 mg/dl from Truswell and Hansen, and 121 mg/dl from Tobias. All are remarkably low, far below the levels found in any contemporary population.

In all cases the samples were stored for weeks or months before being measured far from the place they were drawn – a thousand miles away in Cape Town in the case of Truswell & Hansen. Because the region lacked electricity, it was impossible to keep the samples frozen and difficult to keep them cool. In Miller’s case, the method is described as “difficult.”

We concluded from the study of Eskimos by Corcoran and Rabinowitch 1937 (Serum Cholesterol Among the Eskimos and Inuit, July 1) that stale samples preserved for a long journey and then measured by the method of Abell can produce false, low cholesterol readings. That may have happened also in the case of the three San investigators.

By the 1990s, sample and measurement techniques were greatly improved. Here are the methods used in a 1992 paper by Tichelaar et al [26]:

Blood samples were taken in heparinized containers, and separated plasma samples were deep-frozen until analysis could be carried out, which was always within two weeks. Total cholesterol (TC) and triacylglycerol (TAG) concentrations were determined enzymatically (Boehringer Mannheim GmbH Diagnostica, Mannheim, Germany; CHOD-PAP and GPO-PAP kits, respectively). [26]

Heparinized sample tubes, deep-frozen samples, measurement within two weeks, and enzymatic measurement in modern kits – none of these were features of the earlier lipid measurements on !Kung San hunter-gatherers.

Tichelaar et al studied young adult Bushmen, Hereros and Kavangos. The Bushmen were “in transition”:

The Bushmen studied were no longer purely nomadic; most of them live for variable times in association with Herero villages, but tend to migrate from one place to another depending upon work and food availability. They are accordingly very much “in transition.” [26]

Mean serum cholesterol was 3.71 mmol/l (143 mg/dl) in Bushmen, 4.21 mmol/l (163 mg/dl) in Hereros, and 3.61 mmol/l (140 mg/dl) in Kavangos. These numbers are low, but not as low as the numbers quoted by Eaton et al [1]. They are also not far removed from those of South African Xhosas and Vendas, who measured 4.08 and 4.23 mmol/l respectively (158 and 164 mg/dl). [26]

The Tichelaar sample of Bushmen had an average age of 29. Their plasma fatty acids were relatively good: omega-6 fatty acid levels were far below those of South African whites (9.3% vs 24.4%), and they had the highest EPA:AA ratio among the African groups. However, they drank 2 to 4 liters per day of home-brewed beer, and “vegetable and fruit consumption is little to none at all.” [26] No specific health statistics are given, but Tichelaar indicate that the infectious disease burden was high:

The change from their traditional lifestyle has resulted in a high incidence of malnutrition (9), especially reduced fat and protein stores (70% and 75%, respectively). The severe malnutrition is primarily responsible for the predominance of infectious disease in Bushmen, especially tuberculosis (9). One fact that was extremely clear was the high incidence of alcoholism.

A 1987 study by van der Westhuyzen et al from the Journal of Tropical Medicine and Hygiene [21] corroborates the picture provided by Tichelaar et al. They studied a settled population of !Kung San in Namibia. They confirm that alcohol abuse and malnutrition (including thiamin deficiency) were widespread. Mean serum cholesterol was 4.1 mmol/l (158 mg/dl) [21].

I got a little more insight into the health of settled !Kung San from another 1984 study [22]. It provides details about the timing and health effects of the transition from hunter-gatherer to settled lifestyle:

In 1969 we carried out a study of iron, folate, and vitamin B12 nutrition in a group of!Kung living a hunter-gatherer existence in the Kalahari desert in northwestern Botswana (1). We now report on a study of a comparable group of !Kung who have followed a settled way of life in Chum!kwe, Namibia, some 40 km west of the area ofthe original study (Fig 1).

This group, who are genetically and linguistically identical (2) to the subjects of the previous study (1) have resided at Chum!kwe for at least 15 yr. At Chum!kwe they underwent slow change during the 1960’s and now constitute a settled population which has ceased to hunt game or gather wild vegetation. The men undertake casual employment and food is purchased from local stores, or provided by Government agencies. The diet consists predominantly of maize, supplemented with small and irregular quantities of meat and vegetables, a diet which resembles that of the Black peoples inhabiting the rural areas ofSouthern Africa.

The subjects comprised a group of !Kung San (Bushmen) who, until relatively recently, were hunter-gatherers inhabiting the northwestern Kalahari (Fig 1). All the subjects now reside at Chum!kwe in Namibia 40 km to the west, where they have resided for at least 15 yr….

The diet of the San has changed considerably in the period since the previous study in 1969 (1). The staple food, commercial maize meal, is eaten as a porridge or fermented with cane sugar to make beer. Frequently, this porridge or beer is the only food consumed in a day. This basic diet is supplemented irregularly with canned fruit, vegetables, and meat. One family cultivated a few melons and squashes, but pastoralism is practised on such a small scale as to be negligible. There appears to be a high consumption of alcoholic beverages by the community, and beer, either homebrewed or commercial, is consumed by all members of the society, even very young children. The former is brewed in plastic containers.

Marshall and Ritchie (3) have reported on the economy of the Chum!kwe !Kung as they found it in 1981 and they have compared it with that existing in 1958 when the people still followed a hunting and gathering way of life. This latter way of life is described by Marshall (2). In 1981 the bulk of their dietary needs were met by purchases from the local store: made up of coffee, flour, sugar, maize meal, and canned foods; consisting of maize beer, and a small amount (<1%) of liquor. A smaller proportion of their diet came from Government agencies, and very little animal husbandary, gardening, and the gathering of wild fruits and vegetables. A negligible part of their diet came from hunting activities.

When one considers that in 1958, much of these people’s dietary intake came from the hunting of wild animals it will be appreciated that major changes have occurred….

Until 1980 !Kung inhabitants of Chum!kwe had lived in traditional settlements, well spaced from one another. In that year the government established three housing schemes or townships, consisting of 23, 18, and 14 single roomed houses built from cinder blocks with communal pit type lavatories and bathhouse and a single water tap situated in the centre of the township.

The people spend most of their time outside the houses and, in fact, do their cooking on, and sleep around, a fire which they light in front of the house, facing the central courtyard. The lavatories are never used because the inhabitants walk off into the surrounding bush to relieve themselves. Litter and refuse accumulate in these townships. We have observed that many of the traditional settlements in Chum!kwe moved twice, some moved three times, between August 1980 and December 1981. As a result, those that do move tend to be cleaner than the Government housing projects….

The present study has shown that the change in lifestyle undergone by the San between 1969 and 1981 has been accompanied by a deterioration in their previously excellent iron and folate nutrition and in an increase in the incidence of anemia, most of which is almost certainly nutritional in origin. Alcoholism, previously unknown, has become a major problem.

It is probably not feasible for the San to return to a hunter-gatherer existence because the available land could support only a fraction of the present populations in that mode; neither do the San wish to return to the past. [22]

So the transition to settled life occurred in the 1960s. The !Kung San now depend on government support. Their diet is corn porridge, corn beer, wheat and sugar. They are malnourished and show signs of liver damage. Their settlements are filthy, so much so that they don’t use the lavatories; when a settlement becomes intolerable they create a new one; some communities moved three times in 16 months.

Let me record here two other facts about the !Kung San that may be relevant:

  • They are small — comparable in height and weight to Central African pygmies. The average height of Bushmen males is 158 cm (5 foot 1 inch), and average weight is 46 kg (101 pounds). The average height of Bushmen females is 145 cm (4 foot 9 inch), and average weight is 38 kg (83 pounds). [27]
  • They are short-lived . The life expectancy of !Kung San in the period 1963-1974, which spans the period of transition from hunter-gatherer to settled life, may have been a bit over 50 years – or, conceivably, as low as 35 years:

How shall we interpret this?

First, let’s consider the recently acquired numbers of 143 and 158 mg/dl, which used modern measurement techniques on well-preserved samples and should be trustworthy.

These numbers are precisely what we would expect from an infection-ridden African population with short (~50 year) lifespan. Most sub-Saharan African countries with high infectious disease burdens and shortened lifespan have mean population serum cholesterol close to this.

For instance, Mauritania has mean serum cholesterol of 157 mg/dl. Life expectancy in Mauritania is 61 years. Nigeria has mean serum cholesterol of 136.9 mg/dl and a life expectancy of 47.6 years. Cameroon has mean serum cholesterol of 120.9 mg/dl – the lowest in the world – and a life expectancy of 54 years. Infectious disease risk is rated high in Mauritania and very high in Nigeria and Cameroon.

If TCs among the settled !Kung San meet our expectations, where does this leave us in regard to  to the low serum cholesterol reported for the hunter-gatherer San in the 1960s? My expectations would be:

  • If San hunter-gatherers were healthier than the settled !Kung San, then their serum TC should have been higher than the settled !Kung San TC of 143 to 158 mg/dl. In this case the 1960s measurements would have to be in error.
  • On the other hand, if San hunter-gatherers were sicker than the settled San, then a TC of 120 – similar to that of modern Cameroon – or even lower becomes plausible.

I don’t think either possibility can be ruled out.

The hunter-gatherers may have had poor health. Although anthropologists consider malnutrition more prevalent in the settled !Kung San, their data is not sufficient to show that life expectancy or infectious disease burden became worse when the !Kung San gave up their hunter-gatherer life. And recall also the statement by Fernandes-Costa et al: “neither do the San wish to return to the past.” [22] The hunter-gatherer lifestyle seems to have been no idyll.

The data may have been wrong. If the early measurements performed on stale, poorly refrigerated samples with pre-modern techniques underestimated !Kung San hunter-gatherer TC by 33%, a plausible estimate for the amount by which Corcoran & Rabinowitch 1937 may have underestimated Eskimo TC, then it would bring the measurements of Truswell & Hansen [24] and Bersohn & Tobias right in line with modern-day African TCs.

Conclusion

The !Kung San provide some support to the claims in Eaton et al [1] that hunter-gatherers had low serum cholesterol.

However, the data offers no support to the thesis, argued vigorously in O’Keefe et al [2], that low serum cholesterol levels are healthy. Rather, the evidence from Africa is that low serum cholesterol levels reflect a high burden of infectious disease, especially parasitic disease, and are invariably associated with shortened lifespan.

African hunter-gatherer serum cholesterol levels were probably below 160 mg/dl, maybe well below, and their low cholesterol levels marked a lifespan that was little more than 50 years.

Related Posts

The posts in this series are:

References

[1] Eaton SB, Konner M, Shostak M. Stone agers in the fast lane: chronic degenerative diseases in evolutionary perspective. Am J Med. 1988 Apr;84(4):739-49. http://pmid.us/3135745. Full text: http://www.direct-ms.org/pdf/EvolutionPaleolithic/EatonStone%20Agers%20Fast%20Lane.pdf

[2] O’Keefe JH Jr, Cordain L, Harris WH, Moe RM, Vogel R. Optimal low-density lipoprotein is 50 to 70 mg/dl: lower is better and physiologically normal. J Am Coll Cardiol. 2004 Jun 2;43(11):2142-6. http://pmid.us/15172426.

[3] Konner M, Eaton SB. Paleolithic nutrition: twenty-five years later. Nutr Clin Pract. 2010 Dec;25(6):594-602. http://pmid.us/21139123. Full text: http://ncp.sagepub.com/content/25/6/594.full.

[4] Barnicot NA et al. Blood pressure and serum cholesterol in the Hadza of Tanzania. Hum Biol. 1972 Feb;44(1):87-116. http://pmid.us/5024023.

[21] van der Westhuyzen J et al. Thiamin status and biochemical indices of malnutrition and alcoholism in settled communities of !Kung San. J Trop Med Hyg. 1987 Dec;90(6):283-9. http://pmid.us/3430661

[22] Fernandes-Costa FJ et al. Transition from a hunter-gatherer to a settled lifestyle in the !Kung San: effect on iron, folate, and vitamin B12 nutrition. Am J Clin Nutr. 1984 Dec;40(6):1295-303. http://pmid.us/6150635.

[23] Miller K et al. Lipid values in Kalahari bushmen. Arch Intern Med. 1968 May;121(5):414-7. http://pmid.us/5645718.

[24] Truswell AS, Hansen JD. Serum-lipids in bushmen. Lancet. 1968 Sep 21;2(7569):684. http://pmid.us/4175517.

[26] Tichelaar HY et al. Plasma lipids and fatty acids in urbanized Bushmen, Hereros and Kavangos of southern Africa (Namibia). Lipids. 1992 Sep;27(9):729-32. http://pmid.us/1487973.

[27] Joffe BI et al. Metabolic responses to oral glucose in the Kalahari Bushmen. Br Med J. 1971 Oct 23;4(5781):206-8. http://pmid.us/5115571.