Category Archives: Disease - Page 3

Does PHD Immediately Normalize the Bodyweight Set Point?

The results from the Perfect Health Retreats continue to surprise me.

Retreat attendees come for all sorts of reasons. In terms of weight, they have so far had a fairly similar profile to the general middle-aged population, with almost half being obese and another quarter overweight. That’s enough obese and overweight participants to give us insight into the effects of our advice for weight loss.

Weight Loss Experience at the Perfect Health Retreat

When I was preparing my Ancestral Health Symposium talk on weight loss, I noticed a remarkable pattern that I didn’t have time to discuss in my talk. The pattern was that the amount of weight loss during retreats was proportional to the excess weight of the participants.

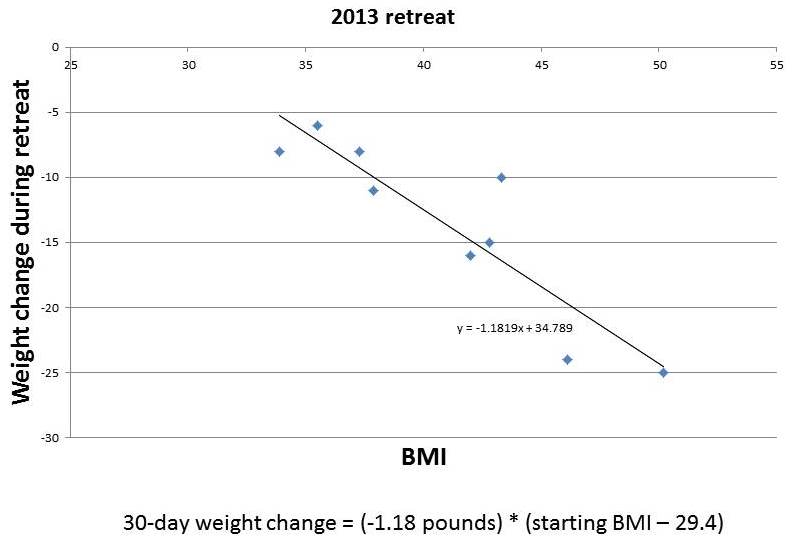
Here are some charts, with the amount of weight loss during the retreat plotted against BMI. From our 2013 retreats, which lasted 30 days, I’ve plotted just the obese participants:

01 Weight Change During 2013 PH Retreats

And from our May 2014 retreat, which lasted two weeks, I’ve plotted the obese and overweight participants:

02 Weight Change During 2014 May PH Retreat

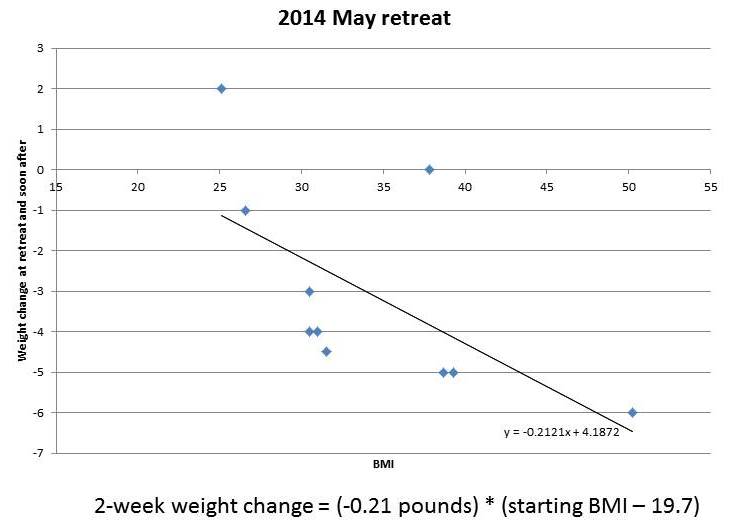
You can see that the amount of weight lost in this short period is roughly proportional to starting BMI. It tracks remarkably closely to a straight line. I’ve put the equations for the lines underneath each figure.

If weight loss follows these straight lines, then you can easily envision what would happen to someone with a high starting BMI, say 50, who lived at the retreat permanently. He would lose weight rapidly at first. As his weight (and BMI) declined, his rate of weight loss would slow, tracking the line. As he approached a destination BMI in the 20-29 range, his rate of weight loss would approach zero. His weight would stabilize at this destination BMI.

(Parenthetically, let me comment on a few features of the charted data. First, it doesn’t surprise me that the destination BMI in the 2013 retreats was higher than that in the 2014 retreats; our program was still under development in 2013, the retreats are much more optimized now; for example, the 2013 retreats were held in a rather dimly lit facility with few windows, yet we know that circadian rhythm entrainment is huge for weight loss. Second, it doesn’t surprise me that the 2014 data is noisier than the 2013 data; the shorter retreat means that other factors, such as jet lag from traveling to the retreat, influence outcomes more significantly; also, in May 2014 we didn’t weigh anyone at the retreat so weights were self-reported from home by guests, making the weights not as reflective of the retreat environment and the time between weighings somewhat variable. Third, it doesn’t surprise me that the rate of weight loss at the 2014 retreat was slower than at the 2013 retreat; 2014 retreat participants were explicitly encouraged not to restrict calories, and wine, snacks, and desserts were served daily, whereas in 2013 the proprietor encouraged some calorie restriction and did not serve alcohol.)

The destination BMIs – the weights at which the fitted lines indicate weight loss would stop – are remarkably close to normal weight.

Implications for a Body Weight “Set Point”

Obesity researchers have found the concept of a body weight “set point” to be useful in explaining obesity. However, they generally find that the “set point” is well above normal weight, even after weight loss interventions.

Our Perfect Health Retreat weight loss experiences are consistent with the existence of a set point. However, Retreat experiences are best understood as telling us that:

  1. The body has a desired weight – a set point – that weight inexorably migrates toward.
  2. The pressure or force driving weight change, as indicated by the rate of weight change, is proportional to the deviation of actual weight from the set point. A larger deviation from the set point creates a greater pressure for weight change and a more rapid migration toward the set point. As the set point is approached, the rate of weight change slows down.
  3. In the context of our retreats, in which people follow the Perfect Health diet and lifestyle, the set point is reset to a normal weight within a few days of their arrival at the retreat.

If PHD does indeed reset the set point to normal in a few days, it is consistent with the theme of my Ancestral Health Symposium talk: it is diet and lifestyle that determine weight; fix those and your weight will inexorably normalize.

But this conclusion is radically contrary to the beliefs of academic obesity researchers. The general view is that changing the set point is extremely difficult, in part because the determinants of the set point extend back in time many decades:

Your heredity and your environment-starting back at the moment of your conception-determine your set point. Over the long term, excess food and insufficient exercise will override your body’s natural tendency to stay at its set point and lead to a higher, less healthy set point.

This implies that normalizing the set point will also require years or decades, because that is how long it takes for the influence of past set-point-raising factors to expire.

The Center for the Study of Nutrition Medicine, led by the distinguished obesity researcher George Blackburn, advises that one can’t sustainably lose more than 10% of body weight in six months:

Scientific evidence supports losing no more than 10% of your body weight at a time. It turns out that the body’s set point and its many regulatory hormones dictate the effectiveness of the 10% loss. That’s the amount of weight you can lose before your body starts to fight back. Many clinical studies have confirmed this phenomenon. Of course, some people can lose more than 10% at a time, but precious few can then maintain that loss.

After you maintain your new, lower weight for 6 months, you can repeat the cycle and reset your set point again by losing another 10%.

Is Dr. Blackburn’s conclusion, confirmed by “many clinical studies,” valid for PHDers? To test that, we need a longer time series.

The largest weight losses at the Perfect Health Retreat have been about 10% of body weight in 30 days. If Dr. Blackburn is right, then after people on PHD lose 10% of the body weight – i.e., after one or two months on PHD – then we should see weight loss stall or enter a yo-yo pattern for the remainder of six months, until the set point adjusts lower and weight loss can resume.

Alternatively, if PHD immediately and permanently resets the set point to a normal weight, the rate of weight loss in PHDers should track a straight line just like in the retreat data. We should see continuous weight loss with no stalls – although there will be a steady slowing of weight loss as a normal weight is approached. In the long run, weight is normalized permanently, and there is no weight regain as long as the person remains on PHD.

Which is it?

The long-term pattern of weight loss on PHD

Fortunately we have a few cases in which PHD readers have faithfully followed our advice, tracked their weight closely, and shared the data with us.

Before I discuss their weight loss experiences, let me describe the weight loss path we would expect to see if the pattern observed at the retreats holds up. The weight loss pattern observed at the retreats is described in a simple equation:

06 weight loss formula 1
Here w is body weight, sp is set point, τ is a characteristic time for weight loss, and Δw is the change in weight achieved in a retreat of length Δt.

Those of you who took calculus will recognize that as a differential equation which we can integrate. It leads to the following formula for weight as a function of time:

07 weight loss formula 2
Here e is a mathematical constant that is about 2.718. This is the formula for what is called an “exponential decay.” Weight starts at w(0), the weight at time zero, and it decays steadily toward the target weight, sp. The characteristic time, τ, is the time needed to progress 63.2% of the way toward sp.

So if PHD is really re-setting the set point to a normal weight within a few days, after which the set point doesn’t change — it just stays at the same weight, normal — then we should see weight loss follow this exponential decay.

OK, now let me get to cases.

The case of Jay Wright

Previously on this site we discussed Jay Wright’s weight loss journey. Here is his weight in blue, and I’ve fitted an exponential decay to it in red:

05 Jay Wright Weight History after starting PHD

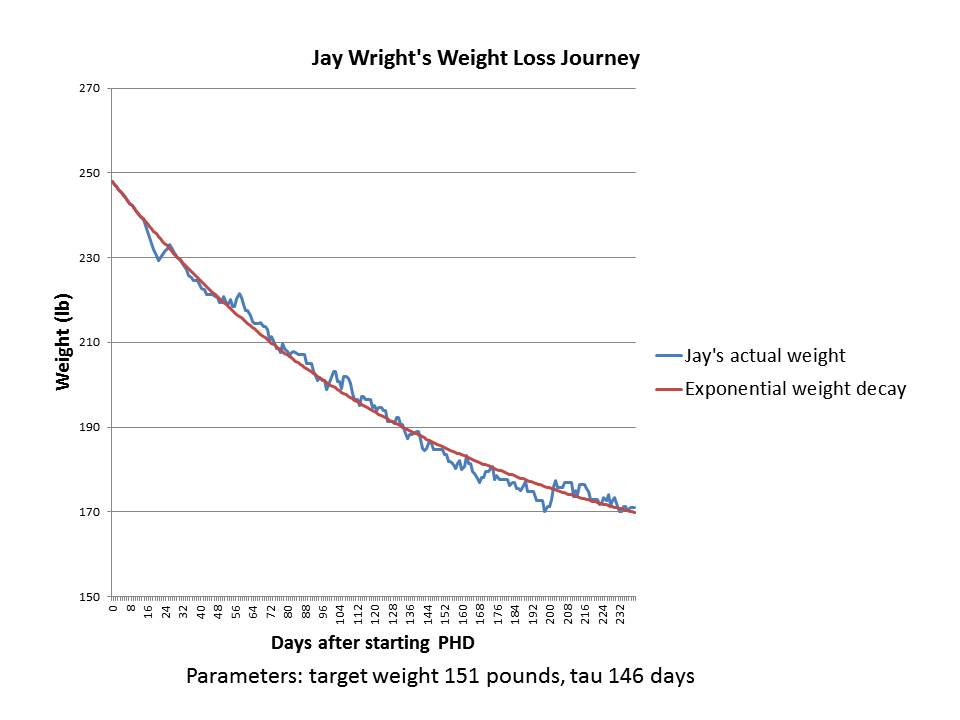
It’s a pretty good fit with a set point of 151 pounds and a characteristic time of 146 days.

Jay’s weight loss took place in 2011. In several years since then, his weight has remained stable around 170 pounds. I believe Jay’s height is 5’10”, so his BMI at 170 pounds is 24.4 and his BMI at the fitted target weight of 151 pounds would have been 21.7.

As you can see by reading Jay’s story, during his period of weight loss he was intentionally restricting calories to 1200 calories per day; but when he got to his goal weight of 170-175 pounds he stopped restricting calories and ate to appetite. I’ll speculate that intentional calorie restriction may lower the set point by a few BMI points, say from 24.4 to 21.7, so that Jay’s “set point” during his weight loss period was 151 pounds but it reverted to 170 pounds once he began eating ad libitum.

The case of Isaac Knoflicek

Our second case was posted by Isaac Knoflicek on the PHD Facebook group a few weeks ago. Here was his weight loss chart. He described it this way:

~110 lost, first chunk was bike commuting, then after about a year of that I started PHD and the weight came off like crazy.

Isaac gave me his weight loss data. Here is what happened after he began PHD:

04 Isaac Knoflicek Weight Loss History after starting PHD

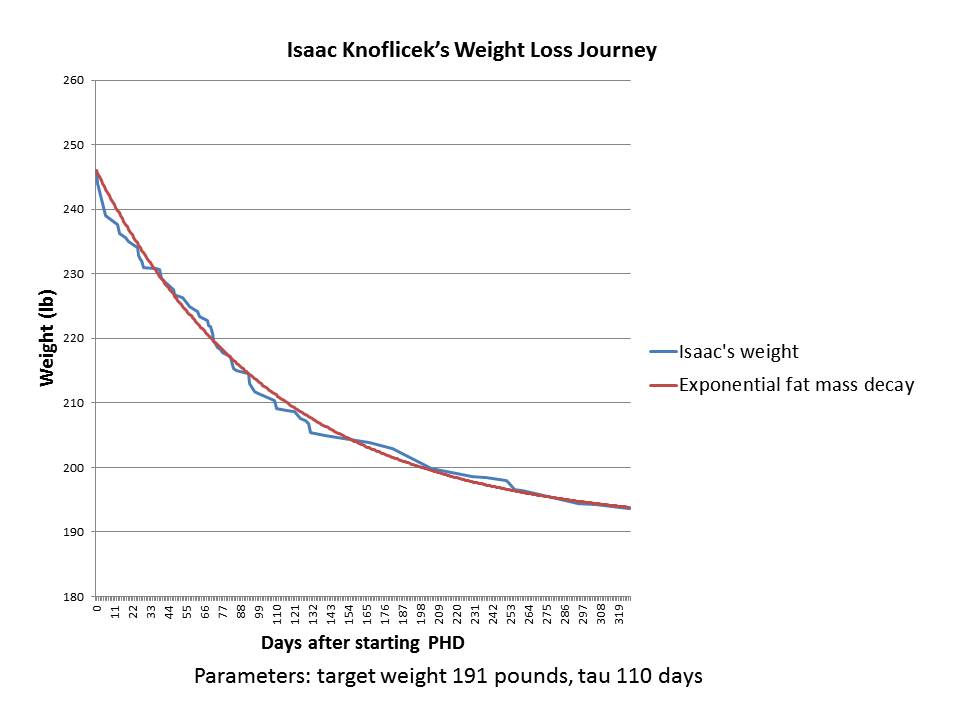
As you can see, it’s a great fit to an exponential decay – an even better fit than in Jay’s case.

Isaac is 6’3” (190.5 cm) tall, so the target weight of 191 pounds is a BMI of 23.9 – absolutely normal.

Although Isaac’s data ended in early 2013, he wrote, “I’ve spent the last year and a half making smaller tweaks but generally staying around the same weight.” That’s consistent with him having gotten close to his target weight; and with his set point having been permanently reset to a normal weight, so that there is no biological pressure for weight regain.

Here are Isaac’s before and after photos:
08 IsaacKnoflicek before09 Isaac Knoflicek after

Implications

Every obese person who has come to our retreats has lost weight (save one whose weight was unchanged), and in most cases weight loss tracked closely to the same pattern for all participants: a linear relationship between weight loss rate and starting BMI. The line reaches a zero weight loss rate near a normal BMI.

The implication is that for nearly all retreat participants, PHD actually fixes all the factors of overweight or obesity and leads to a normalization of the body weight set point. Although our experience at the retreats is still limited, the statistics are good enough to infer that PHD should work for most, if not all, non-diabetic obese people.

Another implication is that it’s possible to normalize set point in just a few days. If set point wasn’t normalized in a few days, weight loss rates over a 14-day retreat could not track a straight line.

Very likely, the reason the set point has appeared persistently high to academic researchers is that the weight loss approaches they have studied don’t actually address most factors in obesity. My Ancestral Health Symposium talk explains that weight is set by a multifactorial process and if multiple obesogenic factors are left uncorrected, the set point will remain elevated.

A third implication is that there is a characteristic physiological time for weight loss, and it may not be possible to accelerate weight loss much. The fastest rate of weight loss we observe is about 4 months to move 63% of the way toward normal weight from current weight. Based on rates of weight loss at the retreats, 6 to 8 months is more typical.

Fourth, it’s not obvious that calorie restriction is either necessary or desirable for long-term weight loss. If all calorie restriction does is temporarily lower the set point by a few BMI points, without affecting the characteristic time for weight loss τ, then calorie restriction may have little effect on either the ultimate weight or on how long it takes to reach it. Calorie restriction may be an energy-sapping, misery-inducing tactic that succeeds only in reducing weight slightly for a few months, with no long-term benefit. And it may have health risks.

Finally, the “last ten pounds problem” has produced a lot of angst. People often lose weight successfully to a weight about 10 pounds above their personal target, then find it extremely difficult to lose the last 10 pounds. We can now see why the last ten pounds can be so hard to lose. First, any minor defect in diet or lifestyle may raise the set point slightly. Second, weight generally rises with age, and people may use their younger weights as targets; so they may be underestimating their body’s physiological weight target. But mainly, it may just be that weight loss becomes very slow once you are within ten pounds of the set point. At 10 pounds above the set point, it takes 6 months to lose 6 pounds, even if you do everything perfectly. That’s only 1 pound per month. From 4 pounds above the set point, it takes 6 months to lose another 2.4 pounds – only 0.4 pounds per month. Then the pace of weight loss slows further. Once the rate of weight change slows to 0.1 pounds per week or less, it will appear to have gone to zero.

Conclusion

To convince skeptics, we will need more data. But I’m going to jump directly to these conclusions:

  • For most people, PHD (including both diet and lifestyle practices) will cure obesity – in the sense of normalizing body weight set point – in a few days.
  • Although the set point is normalized almost immediately, weight loss takes time. Even if you do everything perfectly, it takes about 6 months to shed 63% of excess weight, a year to lose 86%, 18 months to lose 95%, and 2 years to lose 98%. The last few pounds take a long time to go away.

Curious if I’m right? If you are overweight and would like to test this personally, come to our retreats and help us generate more data.

PHRetreat_img9_600x400px

My Ancestral Health Symposium talk on Weight Loss

The Case of the Killer Protein

Earlier this week a paper was released to much fanfare, claiming that diets with over 20% of energy as animal protein might be as life-threatening as smoking.

  • The Huffington Post said, “Atkins aficionados, Paleo enthusiasts, and Dukan devotees, you may want to reconsider what’s on your plate. While high-protein diets have been all the rage over the last few years for their waist-whittling goodness, a new study says they could be as bad for you as smoking.”
  • Scientific American said “People who eat a high-protein diet during middle age are more likely to die of cancer than those who eat less protein, a new study finds.”
  • NPR said, “Americans who ate a diet rich in animal protein during middle age were significantly more likely to die from cancer and other causes.” They added, “In an age when advocates of the Paleo Diet and other low-carb eating plans such as Atkins talk up the virtues of protein because of its satiating effects, expect plenty of people to be skeptical of the new findings.” A sound prognostication!

Ray, Alex, Navy87Guy, Kat, Sam, and others asked for my thoughts.

What the Researchers Did

The article appeared in Cell Metabolism, a high-impact journal which likes long complex papers reporting years of work. [1] A common strategy for getting into such journals is to piece together a great variety of work into one article, weaving a narrative theme to unite them. That’s what this article did, using the theme “high protein diets may shorten lifespan” to link several relatively disconnected projects.

The NHANES Findings

The work that generated most of the buzz was an analysis of data from the National Health and Nutrition Examination Survey (NHANES). They looked at a group of 6,381 NHANES respondents and found, “Respondents aged 50–65 reporting high protein intake had a 75% increase in overall mortality and a 4-fold increase in cancer death risk during the following 18 years. These associations were either abolished or attenuated if the proteins were plant derived.”

Here’s their Figure 1:

Longo et al Figure 1

Two oddities in this result raise red flags:

  • First, protein appears harmful at age 50, neutral at age 65, and beneficial at age 80. This reversal of effects is incompatible with most mechanisms by which protein could affect aging or disease risk. In animal studies, we see the opposite: protein restriction extends maximum lifespan, which means that at high ages, mortality is lower, but increases risk of early death, which means that in middle age mortality is higher.
  • Second, they report that the effect was specific to animal protein: “[W]hen the percent calories from animal protein was controlled for, the association between total protein and all-cause or cancer mortality was eliminated or significantly reduced, respectively, suggesting animal proteins are responsible for a significant portion of these relationships. When we controlled for the effect of plant-based protein, there was no change in the association between protein intake and mortality, indicating that high levels of animal proteins promote mortality.” Yet, plant and animal proteins are biologically similar.

These two oddities strongly suggest that the appearance of negative health outcomes from protein is due to confounding factors – behaviors or foods associated with animal protein consumption in middle age, rather than effects caused by the protein itself.

When we look at how the analysis was performed, we find more reasons to doubt that protein is at fault. All of this data was found using a model which adjusted for the following covariates:

Model 1 (baseline model): Adjusted for age, sex, race/ethnicity, education, waist circumference, smoking, chronic conditions (diabetes, cancer, myocardial infarction), trying to lose weight in the last year, diet changed in the last year, reported intake representative of typical diet, and total calories.

Adjustment for a host of health-related conditions – waist circumference, diabetes, cancer, myocardian infarction, and even total calories which is effectively a proxy for obesity – can radically distort results, and even transform effects from positive to negative. I’ve discussed this issue previously in The Case of the Killer Vitamins.

In practice, many factors are highly correlated. The variables being studied – protein intake, waist circumference, total calorie intake, and others – are beset by the problem of collinearity. Attempting multiple regression analysis on collinear variables can generate very peculiar results. The more the number of adjustment factors grows, the more strange things tend to happen to data.

If they wanted us to understand whether their results are trustworthy, authors would present raw data, and then a sensitivity analysis that shows how introducing each covariate individually affects the results, then showing how including combinations of two covariates affects the results, and so forth. This would help us judge how robust the results are to alternative methods of analysis.

Of course, authors do not do this. Instead, they ask us to trust the analysis they have chosen to present – which is only one of billions they could have done. (This study adjusted for 13 covariates. The NHANES survey may have gathered data on, say, 40 variables. There are 40 choose 13, or 12 billion, possible multivariate regression analyses that could be performed using 13 covariates on this data set. Each of the 12 billion analyses would generate different outcomes.)

Are the authors trustworthy? Unfortunately, most academics today are not. Career and funding pressures are severe, and by and large those who are good at gaming the funding and publishing processes have triumphed professionally over careful, diligent truth seekers. It is much easier to construct a narrative that will garner attention and publicity and interest, than to carefully exclude non-robust results and publish only those results that are solidly supported.

Frankly, I give little credence to their NHANES analysis. And, judging by comments in the press, other epidemiologists don’t seem to give it much credence either. From the NPR article:

But could eating meat and cheese really be as bad for you as smoking, as the university news release describing the new Cell Metabolism paper suggested?

Well, that may be an exaggeration, according to Dr. Frank Hu, a researcher at the Harvard School of Public Health who studies the links between health, diet and lifestyle.

“The harmful effects of smoking on cancer and mortality are well-established to be substantial, while the harmful effects of red meat consumption are modest in comparison,” Hu wrote to us in an email.

The Mouse Experiments

So let’s turn to the next part of the study, the mouse experiments:

Eighteen-week-old male C57BL/6 mice were fed continuously for 39 days with experimental, isocaloric diets designed to provide either a high (18%) or a low (4%–7%) amount of calories derived from protein …

The low protein diets are really starvation diets, in terms of protein intake. The reason the low protein diets were sometimes 4% and sometimes 7% was because mice will often lose weight on 4% protein diets due to starvation (in the paper’s experiments on BALB/c mice, “the mice had to be switched from a 4% to a 7% kcal from protein diet within the first week in order to prevent weight loss.”). Animal control officers do not allow experiments to continue if the mice are obviously starving.

[B]oth groups were implanted subcutaneously with 20,000 syngeneic murine melanoma cells (B16).

This is an unusually small number of cells. Typically, cancer researchers implant a million cells to create a syngeneic tumor. Presumably they used this small number of cells in order to ensure that some mice would not develop tumors during the 39 day experiment. As it happened, this was a lucky (canny?) choice of cell quantity: while 10 of 10 mice on the high-protein diet developed tumors during the experiment, only 9 of 10 mice on the low-protein diet did. If they had used more cells, all mice on both diets would have developed tumors; if they had used fewer cells, some mice on the high protein diet would have failed to develop tumors. Either way, the results would appear less damning for the high protein diet.

The outcomes:

Longo et al Figure 3
Due to the small number of cells injected, it takes at least two weeks before tumors are detectable in size (normally they would be visible in ten days). They seem to be similar in size at about two weeks after implantation.

However, when the tumors reach larger sizes, growth is impaired on the low protein diets. A mouse weighs 20 grams, and a 2000 mm3 tumor weighs 2 grams, or 10% of body weight – equivalent to a 15-pound tumor in humans. Growing a tumor of this size requires building a large amount of tissue — blood vessels, extracellular matrix, and more. The ability to construct new tissue is constrained on a protein-starved diet, so it’s not surprising that tumor growth is slower when the tumor is large and protein is severely restricted.

Animal protocols generally require that mice be sacrificed when tumors reach 2000 mm3. Extrapolating the tumor growth curves, it looks like the mice in experiment (B) would be sacrificed 5 weeks after implantation on the high protein diet, or 8 weeks after implantation on the low protein diet; in experiment (G), mice on the high protein diet would be sacrificed about 9 weeks after implantation, while mice on low protein diets would have been sacrificed about 11 weeks after implantation.

In other words, tumors still kill you, just a bit more slowly if you are starving yourself.

It’s important to note a couple of things. First, the word “starving” is appropriate. 4% to 7% protein intakes are starvation levels for mice. In a nice blog post closely relevant to this topic, Chris Masterjohn notes that a 5% protein intake completely stunts the growth of young rats:

Chris rhetorically asks: “How many of us would deliberately feed a two-year old a diet that would cause them to stop growing altogether?”

Second, as Chris also points out in the same post, such low protein intakes actually make cancer more likely in the context of exposure to mutagens. For instance, aflatoxin exposure leads to cancer (or pre-cancerous neoplasms) much more frequently in rats on low-protein diets than in rats on high-protein diets:

In this experiment, there were two diets, 5% protein and 20% protein, and two diet periods, one during exposure to aflatoxin and one afterward. Rats exposed to aflatoxin while on a 5% protein diet were far more likely to develop neoplasms than rats exposed to aflatoxin on a higher protein diet. That is, the “20-5” rats had far fewer cancers than the “5-5” rats, and the “20-20” rats had far fewer cancers than the “5-20” rats. High protein for the win!

However, once the rats had neoplasms, the tumors grew more slowly on the low-protein diet. Just as the new study found.

So, if your goal is to avoid getting cancer, it is better to eat adequate protein. If you already have cancer, or if researchers have injected you with highly metastatic melanoma cells, you can buy yourself slightly slower tumor growth by starving yourself of protein. In laboratory mice, this extends lifespan a few weeks because they are not allowed to die from cancer, but are sacrificed when tumors reach a specific size. In humans, however, cancer death commonly follows from cachexia, or wasting of lean tissue. A low protein diet might promote cachexia and accelerate cancer death in humans. It is not possible to infer from this study that there would be a clinical benefit to a low protein diet in human cancer patients.

Other Negative Effects of Low-Protein Diets

The study noted a significant negative effect of low protein diets in older mice. While young mice (18 weeks, equivalent to young adults) lost only a few percent of body weight on the starvation low protein diets, elderly mice (2 years old) wasted away on low protein diets. The data:

Longo et al Figure 4

Both young and old mice managed to gain a bit of weight on the high protein diets, and both young and old mice lost weight on the low protein diets. The weight loss was much more severe in elderly than young mice.

Considering that wasting away commonly precedes death in the elderly, this is not a good sign for the low protein diets. The authors themselves argue that this is consistent with the NHANES finding that high protein diets become beneficial after age 65: “old but not young mice on a low protein diet lost 10% of their weight by day 15, in agreement with the effect of aging on turning the beneficial effects of protein restriction on mortality into negative effects.”

However, while I think it is clear that the dramatic weight loss in the elderly mice fed low protein is harmful, it is far from clear that the slight weight loss of the younger mice was harmless. Though they maintained their weight better than elderly mice, they may have been starving as well. To actually support the NHANES survey, the researchers should have maintained the mice on low or high protein diets for several years, and seen which group lived longer. They did not do this.

If they had, I speculate that the high protein mice would have lived longer.

Conclusion

This is a study in the line of T. Colin Campbell and other vegetarians who have tried to show that animal protein promotes cancer and mortality. These studies are unconvincing. They simply do not prove the conclusions they purport to draw.

The Perfect Health Diet takes a middle ground in regard to protein: We recommend eating about 15% protein, and argue that both high protein and low protein diets are likely to be harmful; high protein diets by accelerating aging or by making protein available to gut bacteria for fermentation, producing a less beneficial gut flora and generating nitrogenous toxins; low protein diets by starving the body of a key nutrient needed to maintain bodily functions, especially liver, kidney, and immune function.

Nothing in this study persuades me that those recommendations need revision.

References

[1] Levine ME et al. Low Protein Intake Is Associated with a Major Reduction in IGF-1, Cancer, and Overall Mortality in the 65 and Younger but Not Older Population. Cell Metabolism 19, 407–417, March 4, 2014. http://www.cell.com/cell-metabolism/retrieve/pii/S155041311400062X.

Curing Ankylosing Spondylitis

UPDATE: Steven has a new video update, to which I have added an updated commentary: Update: Attacking Ankylosing Spondylitis with PHD, November 18, 2014. FURTHER UPDATE, September 2015: Steven has created his own website with more information, www.recoveryfromas.com. Check it out!

Ankylosing spondylitis is a fearsome disease. The Mayo Clinic states:

Ankylosing spondylitis is an inflammatory disease that can cause some of the vertebrae in your spine to fuse together. This fusing makes the spine less flexible and can result in a hunched-forward posture. A severe case of ankylosing spondylitis can make it impossible for you to lift your head high enough to see forward….

Inflammation also can occur in other parts of your body — such as your eyes and bowels.

There is no cure for ankylosing spondylitis, but treatments can decrease your pain and lessen your symptoms.

But the “no cure” part is probably mistaken. Yesterday I received an email from Steven Morgan:

Hey Paul,

Your website and book saved my ass and gave me a chance to recover from Ankylosing Spondylitis, no small feat.  I made a video about it here:  http://www.youtube.com/watch?v=qvgjJTLrM3M

There was a thread on your site about high cholesterol and possible causes when going Paleo.  That thread was HUGE in my recovery….  My cholesterol fell over 200 points in two months!

Anyhow, you’re the best.  Thank you!

Cheers,

Steven

Here’s Steven’s story:

In a follow-up email, Steven elaborated:

My health is fantastic lately!  I’m still able to push the edges of what I can tolerate, and am enjoying eating butter, some white-rice based gluten-free breads, some vegetables, and occasionally cheddar cheese.  Sure beats just the 5 foods I took on my trip!  Well, to be honest, after several months of just eating coconut, cacao, pemmican, fish, and white rice, I grew quite fond of it all.  It’s amazing how your palate can change.

I gave Steven a few suggestions that I think would help anyone with AS:

  • Nutrition:
    • Vitamin A (1/4 to 1/3 lb liver per week plus spinach, sweet potatoes, yams, carrots, persimmons)
    • Vitamin D from sun and supplements.
    • Vitamin C
    • Collagen from soups and stews with joints, bones, tendons, and tripe.
    • Zinc and iodine.
  • Circadian rhythm entrainment
  • Intermittent fasting

Steven wants to share experiences with other ankylosing spondylitis sufferers; he asked me to “let folks know I’d be happy to connect; I’m especially interested in connecting with other people who have AS!” You can reach Steven by email at stevenmorganjr@gmail.com.

Conclusion

The Mayo Clinic is correct that medicine offers no cure for ankylosing spondylitis; but diet and lifestyle may do better. AS is probably an infectious condition caused by a pathogenic gut flora. Improved immune function and remodeling of the gut microbiome ought to be able to work a cure.

Steven experimented with a no-starch diet, but had better results on something more PHD like. As we’ve discussed, eating carbs is important for formation of the intestinal mucosal barrier and for proper immune function. A very low-carb diet often delivers short-term relief by starving pathogens, but it doesn’t support a probiotic gut flora and can bring long-term problems from suppressed immunity and impaired gut barrier integrity. That often leads to food sensitivities like those Steven suffered from. It’s better to obtain sufficient dietary carbohydrates to support a healthy gut. White rice is often one of the easier carbs to start with.

Thanks for writing, Steven! Your experiences and video should give hope to AS sufferers everywhere!