Category Archives: Disease - Page 8

The Trouble with Pork, Part 2

So it looks like pork consumption is correlated with cirrhosis of the liver, liver cancer, and multiple sclerosis (Pork: Did Leviticus 11:7 Have It Right?, Feb 8, 2011). Why?

There are a number of potential dangers from pork, and to give each due consideration will require two posts. I’ll look at a few candidates today, and save my top candidate for Thursday.

Omega-6 Fats

Omega-6 fats are a health villain: Excess omega-6 contributes to general inflammation, fatty liver disease, metabolic syndrome, obesity, and impaired immune function.

And pork can be a major source of omega-6 fats. Nutritiondata.com lists the omega-6 fraction of lard at 11%. But the omega-6 fraction can be highly variable, depending on the pig’s diet. Chris Masterjohn recently reported that the lard used in the “high-fat” research diet was 32% polyunsaturated, nearly all of it omega-6:

The graph shows the difference between the actual fatty acid profile as determined by direct analysis of the lard and the previously reported fatty acid profile, which had been estimated using the USDA database.  We can see that the actual fatty acid profile is much higher in PUFAs, at the expense of both saturated and monounsaturated fats.  In fact, the company had originally estimated the diet to provide 17 percent of its fat as PUFA, but now estimates it to provide a whopping 32 percent!

Chris further reported that feeding the pigs a pasture and acorns diet would reduce lard PUFA levels to 8.7%, and feeding them a Pacific Islander PHD-for-pigs diet of coconut, fish, and sweet potatoes would reduce lard PUFA levels to 3%.

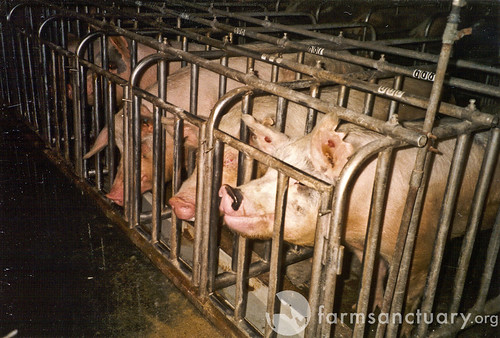
So the omega-6 content can cover a 10-fold range, 3% to 32%, with the highest omega-6 content in corn- and wheat-fed pigs who have been caged for fattening. Corn oil and wheat germ oil are 90% PUFA, and caging prevents exercise and thus inhibits the disposal of excess PUFA. Caging is a common practice in industrial food production; here is a picture of sows in gestation crates:

And here are some Chinese pigs in shipping cages for transport to market:

The Wall Street Journal reported Monday that McDonald’s, following Chipotle, has asked its pork suppliers to stop using gestation stalls, and the largest US hog producer, Smithfield Farms, has begun a 10-year plan to move pigs from small stalls into roomier “group housing systems.” So perhaps the omega-6 content of commercial pork will come down.

How much omega-6 are people actually getting from pork? In the Bridges database, the range in pork consumption across countries was 2 to 80 kg/yr, or 5 to 200 g/day. If this is from industrially raised pigs whose fat is 30% omega-6, then this works out to 0.25% to 10% of energy as omega-6 fats from pork. In most countries, pork is either the primary source of omega-6 fats or the second source after vegetable oils.

Moral of the story: If you’re going to eat a lot of pork, there are real benefits to finding a source of naturally raised pigs fed a healthy diet.

Aside: On a similar diet, human adipose tissue develops almost identical omega-6 levels to pig lard. The Finnish Mental Hospital Study [1] [2] [3], discussed in our book on pages 63-65, showed that on a normal dairy-rich hospital diet human adipose tissue is less than 10% omega-6, but on a soybean oil rich diet adipose tissue becomes 32% omega-6.

American diets have traversed this range in recent decades. Here is a plot of subcutaneous fat omega-6 levels from Stephan Guyenet:

But can omega-6 fats explain the remarkable correlation between pork consumption and liver cirrhosis mortality, hepatocellular carcinoma, and multiple sclerosis?

Polyunsaturated fats are usually a factor in liver diseases. As we discuss in the book (pp 57-58), polyunsaturated fats – either omega-6 or omega-3 – combined with alcohol or fructose are a recipe for fatty liver disease and metabolic syndrome, especially if micronutrient deficiencies figure in the mix. Two of the studies cited in the book:

  • Mice fed 27.5% of calories as alcohol developed severe liver disease and metabolic syndrome when given a corn oil diet (rich in omega-6), but no disease at all when given a cocoa butter diet (low in omega-6). (The first line of this paper reads, “The protective effect of dietary saturated fatty acids against the development of alcoholic liver disease has long been known”.) [4]
  • Scientists induced liver disease in mice by feeding alcohol plus corn oil.  They then substituted a saturated-fat rich mix based on beef tallow and coconut oil for 20%, 45%, and 67% of the corn oil. The more saturated fat, the healthier the liver. [5]

George Henderson, who got us started on this series, links to more papers connecting omega-6 fats to liver cirrhosis.

So: Pork can be a major source of omega-6 fats; and omega-6 fats are a cause of liver cirrhosis.

However, there are several reasons for thinking that omega-6 fats cannot be the primary reason pork raises mortality from our three diseases.

First, vegetable oil consumption seems to be largely uncorrelated with the pork-associated diseases. If omega-6 fats were the primary cause then vegetable oils should have been as strongly correlated as pork. Yet there are plenty of cases of high vegetable oil and low pork consumption (eg Israel), or low vegetable oil and high pork consumption. Disease rates track pork consumption only.

Second, high intake of omega-6 fats causes a mild elevation of risk for a wide range of diseases, much like obesity (which high omega-6 intake causes). Yet pork is associated with extreme elevation of three diseases, and little association with other diseases – not at all the pattern we would expect for omega-6 fats.

Overall, I think we can say that omega-6 fats are probably a contributing factor in liver disease and liver cancer, possibly in multiple sclerosis, but they are unlikely to be the primary factor in the high correlation between pork consumption and liver cirrhosis mortality, liver cancer mortality, and multiple sclerosis.

Processed Meat Toxins

In many countries, most pork consumption is in the form of processed meats. In the United States, about two-thirds of pork is processed. Here is a table (hat tip: Mary Lewis):

Smoked ham is 28% of US pork consumption, sausage is 13%, bacon 6%, processed lunchmeat 6%, and other forms of processed pork another 10%. Among fresh pork cuts, pork chops lead with 11% of US consumption.

In epidemiological studies, processed meat consumption is often associated with poor health. The strongest association is for colorectal cancer [6] and other cancers of the digestive tract, liver, and prostate.

The main types of processing are curing and smoking. Smoking introduces to the meat smoke toxins such as phenols, aldehydes, and polycyclic aromatic hydrocarbons. Curing uses salt, sugar, and nitrite, and while these are fairly benign on their own, various toxins can be formed from them, notably glycation products from the sugar and “N-nitroso compounds” such as nitrosamines from the nitrite.

Some people have concerns about the salt in processed pork. MScott provided evidence that the salt could promote peroxidation of omega-6 fats. Vladimir Heiskanen sent me a link to a blog post arguing that upsetting the sodium-potassium balance could be important:

Dr. Kublina also stressed that people must understand the massive impact that processing has on foods. She cites, for example, that 100 g of unprocessed pork contains 61 mg of sodium and 340 mg of potassium, but turning this into ham alters that ratio significantly, to yield a whopping 921 mg of sodium and, to boot, reduces the potassium content to 240 mg.

On the other hand, john linked to a paper showing that bacon protected against colon cancer, probably due to its salt content. Personally, I think salt is quite healthy, even at the levels contained in bacon, as long as one drinks water and eats vegetables for potassium.

Of all the toxins in processed pork, the most plausible causal agent for our three diseases are the N-nitroso compounds. These compounds are highly abundant in processed pork:

N-nitroso content of food items ranged from <0.01?g/100 g. to 142 ?g/100 g and the richest sources were sausage, smoked meats, bacon, and luncheon meats. [7]

The most common N-nitroso compound in pork products is N-nitrosodimethylamine (NDMA), followed by N-nitrosopiperidine (NPIP), N-nitrosodiethylamine (NDEA), N-nitrosopyrrolidine (NPYR), N-nitrosomorpholine, and N-nitrosothiazolidine (NTHZ).

Nitrosamine levels are increased by high-temperature cooking: “Frying of bacon and cured, smoked pork bellies led to substantially increased levels of NPYR.” [8] In general, high-temperature cooking of meats is a bad idea, as it can generate mutagenic and carcinogenic compounds even in fresh meat. [9]

N-nitroso compounds are known causal agents for liver cancer. Scientists commonly use N-nitrosodiethylamine (NDEA) to induce hepatocellular carcinoma in rats (669 citations, eg [10]). In primates, N-nitroso compounds specifically cause cancers of the liver:

Conversely, all except two of the N-nitroso compounds were carcinogenic. Diethylnitrosamine (DENA) was the most potent and predictable hepatocarcinogen in cynomolgus, rhesus, and African green monkeys. [11]

A Finnish study found an increased risk of colorectal cancer with exposure to N-nitrosodimethylamine (NDMA) from smoked and salted meats, mainly fish and pork [12]. In China, intake of N-nitroso compounds correlates with the incidence of esophageal cancer. [13]

So it seems like we have a likely causal agent here linking pork to liver cancer.

But not so fast!

Although N-nitroso compounds undoubtedly can cause liver cancer, there is a big obstacle to attributing the correlation of human liver cancer with pork consumption to the N-nitroso compounds in processed pork. This is that human liver cancer rates seem to be more strongly related to consumption of fresh pork than processed pork.

I’ve seen several studies showing this, and none showing the reverse. Here’s an example: “A prospective study of red and processed meat intake in relation to cancer risk” [14]. Remember, red meat includes pork, and pork is the most dangerous red meat; processed meat is mainly processed pork.

Here is the hazard ratio of various cancers for the top quintile versus bottom quintile of red meat intake:

Liver cancer has the highest hazard ratio, 1.61.

Here are the hazard ratios for processed meat:

.

Liver cancer is eleventh most likely among the cancers, and the hazard is insignificant.

Here’s another study, an analysis of colorectal cancer rates in the European Prospective Investigation into Cancer (EPIC), which also supports the idea that (a) pork is worse than beef and (b) fresh pork is worse than processed pork:

In analyses of subgroups of red meats, colorectal cancer risk was statistically significantly associated with intake of pork (for highest versus lowest intake, HR = 1.18, 95% CI = 0.95 to 1.48, Ptrend = .02) and lamb (HR = 1.22, 95% CI = 0.96 to 1.55, Ptrend = .03) but not with beef/veal (HR = 1.03, 95% CI = 0.86 to 1.24, Ptrend = .76). In analyses in which intake of each meat was mutually adjusted for intake of the other meats, only the trend for increased colorectal cancer risk with increased pork intake remained statistically significant (Ptrend = .03). Intakes of ham (for highest versus lowest intake, HR = 1.12, 95% CI = 0.90 to 1.37, Ptrend = .44), of bacon (HR = 0.96, 95% CI = 0.79 to 1.17, Ptrend = .34), and of other processed meats (mainly sausages) (HR = 1.05, 95% CI = 0.84 to 1.32, Ptrend =.22) were not independently related to colorectal cancer risk. [15]

Beef is harmless, lamb is not statistically significant after adjustment for pork intake, but pork was harmful in all analyses. However, processed pork had lower hazard ratios than fresh pork, and bacon even appeared protective!

Before I conclude this post, let me present one more fact. This is that fiber consumption is protective against pork-induced cancer. Here is representative data, from [15]:

Look at panel B: With high fiber intake there is essentially no additional cancer risk; but if fiber intake is low, then pork consumption is much more effective at elevating cancer rates.

Conclusion

So let’s add up the evidence and see where it leads:

  • First, the only potentially dangerous component of fresh natural pork, omega-6 fats, can’t account for the data.
  • Second, processed pork, which has other dangerous compounds like N-nitroso compounds, actually appears safer than fresh pork.
  • Third, fiber is protective against pork dangers.

To me these suggest that an infectious pathogen is the cause we are looking for.

Consider: Traditional methods of processing pork, such as salting, smoking, and curing, are antimicrobial. They were developed to help preserve pork from pathogens. So if processed pork is less risky than fresh pork, we should look for a pathogen that is reduced in number by processing.

If a pathogen is the cause, then it makes sense that fiber would be protective. Fiber increases gut bacterial populations. Gut bacteria get “first crack” at food and release proteases and other compounds that can kill pathogens. Also, a large gut bacterial population makes for a vigilant immune system at the gut barrier, making it more likely that pathogens will fail to enter the body. The gut flora are a valuable part of the gut’s immune defenses.

In my next post I’ll look at the pathogens that can infect both pigs and humans, and see (1) if there is a likely candidate for the association of pork consumption with liver cirrhosis, liver cancer, and multiple sclerosis, and (2) how we can best protect ourselves against this threat.

Related Posts

Posts in this series:

References

[1] Miettinen M et al. Effect of cholesterol-lowering diet on mortality from coronary heart-disease and other causes. A twelve-year clinical trial in men and women. Lancet. 1972 Oct 21;2(7782):835-8. http://pmid.us/4116551.

[2] Turpeinen O et al. Dietary prevention of coronary heart disease: the Finnish Mental Hospital Study. Int J Epidemiol. 1979 Jun;8(2):99-118. http://pmid.us/393644.

[3] Miettinen M et al. Dietary prevention of coronary heart disease in women: the Finnish mental hospital study. Int J Epidemiol. 1983 Mar;12(1):17-25. http://pmid.us/6840954.

[4] You M et al. Role of adiponectin in the protective action of dietary saturated fat against alcoholic fatty liver in mice. Hepatology. 2005 Sep;42(3):568-77. http://pmid.us/16108051.

[5] Ronis MJ et al. Dietary saturated fat reduces alcoholic hepatotoxicity in rats by altering fatty acid metabolism and membrane composition. J Nutr. 2004 Apr;134(4):904-12. http://pmid.us/15051845.

[6] Santarelli RL et al. Processed meat and colorectal cancer: a review of epidemiologic and experimental evidence. Nutr Cancer. 2008;60(2):131-44. http://pmid.us/18444144.

[7] Stuff JE et al. Construction of an N-nitroso database for assessing dietary intake. J Food Compost Anal. 2009 Dec 1;22(Suppl 1):S42-S47. http://pmid.us/20161416.

[8] Ellen G et al. N-nitrosamines and residual nitrite in cured meats from the Dutch market. Z Lebensm Unters Forsch. 1986 Jan;182(1):14-8.  http://pmid.us/3953157.

[9] Sinha R. An epidemiologic approach to studying heterocyclic amines. Mutat Res. 2002 Sep 30;506-507:197-204. http://pmid.us/12351159.

[10] Peto R et al. Effects on 4080 rats of chronic ingestion of N-nitrosodiethylamine or N-nitrosodimethylamine: a detailed dose-response study. Cancer Res. 1991 Dec 1;51(23 Pt 2):6415-51. http://pmid.us/1933906.

[11] Thorgeirsson UP et al. Tumor incidence in a chemical carcinogenesis study of nonhuman primates. Regul Toxicol Pharmacol. 1994 Apr;19(2):130-51. http://pmid.us/8041912.

[12] Knekt P et al. Risk of colorectal and other gastro-intestinal cancers after exposure to nitrate, nitrite and N-nitroso compounds: a follow-up study. Int J Cancer. 1999 Mar 15;80(6):852-6. http://pmid.us/10074917.

[13] Lin K et al. Dietary exposure and urinary excretion of total N-nitroso compounds, nitrosamino acids and volatile nitrosamine in inhabitants of high- and low-risk areas for esophageal cancer in southern China. Int J Cancer. 2002 Nov 20;102(3):207-11. http://pmid.us/12397637.

[14] Cross AJ et al. A prospective study of red and processed meat intake in relation to cancer risk. PLoS Med. 2007 Dec;4(12):e325. http://pmid.us/18076279.

[15] Norat T et al. Meat, fish, and colorectal cancer risk: the European Prospective Investigation into cancer and nutrition. J Natl Cancer Inst. 2005 Jun 15;97(12):906-16. http://pmid.us/15956652.

Pork: Did Leviticus 11:7 Have It Right?

If we were to rank popular meats by their healthfulness, the order would be (1) fish and shellfish, (2) ruminants (beef, lamb, goat), and (3) birds (duck, chicken, turkey). In last place would be pork.

Given the iconic place of bacon in the Paleo movement, it’s worth exploring the evidence against pork.  George Henderson has given us a great place to start:  “Nanji and Bridges identified possible problems with pork plus moderate alcohol in 1985 and other researchers have confirmed the pattern since.”

Pork Consumption and Liver Cirrhosis

Pork consumption has a strong epidemiological association with cirrhosis of the liver. Startlingly, pork may be even more strongly associated with alcoholic cirrhosis than alcohol itself!

The evidence was summarized by Francis Bridges in a recent (2009) paper [1], building on earlier work by Nanji and French [2]. A relation between pork consumption and cirrhosis of the liver is apparent across countries and has been consistently maintained for at least 40 years.

Here is the correlation between pork consumption and mortality from liver cirrhosis in 2003 [1]:

The correlation coefficient of 0.83 is extremely high – rarely seen in epidemiology. Correlation coefficients range from -1.0 to 1.0, and a coefficient of 1.0 would indicate that cirrhosis mortality was strictly proportional to pork consumption. The very low p-value confirms the statistical association.

Here is the relation between alcohol consumption and mortality from liver cirrhosis:

The correlation coefficient is lower than for pork consumption.

In epidemiological studies, beef, lamb, and pork are often grouped together as “red meat.” However, this may conceal differences between pork and the ruminant meats. Bridges found that beef actually appeared protective against cirrhosis:

In the present study using 2003 data, a significant negative association between dietary beef and rates of cirrhosis mortality was found…. [D]ietary beef may be a protective factor regarding the pathogenesis of alcoholic cirrhosis. [1]

This would be consistent with considerable evidence, discussed in our book (pp 57-58), showing that saturated fat is protective against liver disease, while polyunsaturated fat causes it. Epidemiological data confirms that saturated fat is protective; here is Bridges again [1]:

[A]nalysis of data from 17 countries indicated that diets high in cholesterol and saturated fat protected (i.e., inversely correlated) against alcoholic cirrhosis while polyunsaturated fats promoted (positively correlated) cirrhosis [8].

Beef is high in saturated fat, low in polyunsaturated fat. Pork is relatively high in polyunsaturated fat.

If the fat composition is playing a role, perhaps it is not that surprising that pork is more strongly related to cirrhosis than alcohol.

Either fructose or alcohol can react with polyunsaturated fat to produce liver disease. Sugar consumption, for example in soft drinks, may be just as likely to combine with pork to cause a cirrhotic liver as alcohol. But no other common dietary component can substitute for the role of polyunsaturated fat in causing liver disease.

Here Nanji and French summarize the correlation of pork with liver disease even in the absence of alcohol:

In countries with low alcohol consumption, no correlation was obtained between alcohol consumption and cirrhosis. However, a significant correlation was obtained between cirrhosis and pork. A similar relationship was seen in the ten Canadian provinces, where there was no correlation between cirrhosis mortality and alcohol consumption, but a significant correlation was obtained with pork. [2]

But fat composition is hardly likely to be the sole issue with pork. Most polyunsaturated fats in modern diets are derived from vegetable oils, not pork. It seems that there must be something else in pork besides polyunsaturated fat that is causing liver disease.

Pork and Liver Cancer

We would expect that if pork can cause liver cirrhosis it will also promote liver cancer, since injured and inflamed tissues are more likely to become cancerous.

Indeed, there is an association between pork consumption and the primary liver cancer, hepatocellular carcinoma. Nanji and French [3] write:

The authors investigated the possibility that dietary fat, meat, beef, and pork consumption might be factors that would, in addition to alcohol, correlate with mortality from hepatocellular carcinoma (HCC) in different countries….

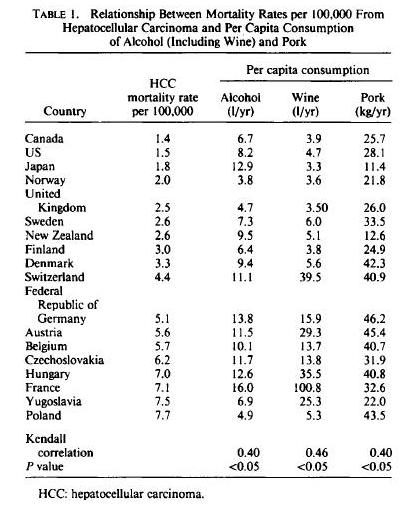
The correlation between HCC and alcohol was 0.40 (p < 0.05); that with pork consumption was also 0.40 (p < 0.05). There was no correlation with total fat meat, beef, and cigarette and tobacco consumption.

Here is the raw data by country:

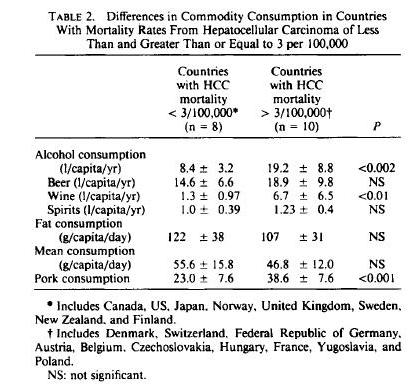
Another way of looking at the data is based on countries with low and high incidence of HCC. Countries with high incidence of HCC eat more pork and drink more alcohol, but actually eat less animal fat:

Pork and Multiple Sclerosis

Nanji and Norad [4] looked for other diseases that correlate with pork consumption, and hit upon multiple sclerosis. The connection is remarkable:

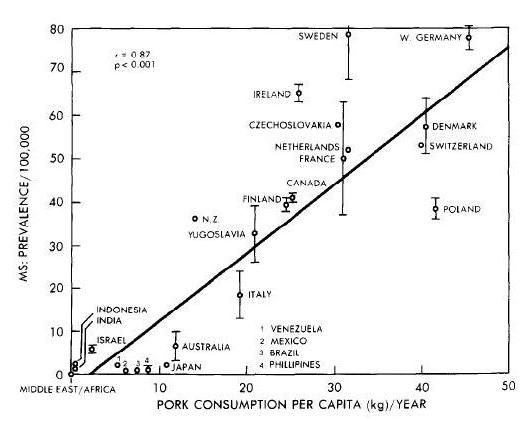
A significant correlation was obtained between prevalence of multiple sclerosis and … pork consumption (r = 0.87, p less than 0.001). There was no significant correlation with beef consumption. [4]

As noted earlier, a correlation coefficient of 0.87 is extremely high, and a p-value below 0.001 also shows a very strong relationship. MS is much more likely to befall pork eaters. Such a strong correlation makes it look like pork, or something found in pork, is the cause of MS.

Nanji and Norad further note that beef, the “other red meat,” is not associated with MS:

The correlation between pork consumption and MS prevalence was highly significant. Also, of major significance was the absence of a significant correlation between MS prevalence and beef consumption. This is consistent with the observations that MS is rare in countries where pork is forbidden by religious customs (e.g. Middle East) and has a low prevalence in countries where beef consumption far exceeds pork consumption (e.g. Brazil, Australia). [4]

The correlation between pork and MS may be seen here:

Lauer [5] verified the pork-MS link, but found it to be characteristic of processed pork:

When … quantitative data are taken into account, and a combined factor “smoked meat” or “smoked pork” is formed, the association is very high throughout. This factor is also compatible with the high risk of multiple sclerosis in Scotland and particularly in the Orkney and Shetland Islands and with the only transitorily high incidence in the Faroe Islands [6], whereas coffee can hardly explain both epidemiological features.

Arguments for the biological plausibility of some agents occurring in smoked and cured meat (in particular nitrophenol haptens and their protein conjugates) have been put forward [7]. There appears at present to be no plausibility for the factor “margarine”, which was also not compatible with the temporal pattern of multiple sclerosis in the Faroe Islands. [6]

Conclusion

There are remarkably strong correlations between pork consumption and liver disease, liver cancer, and multiple sclerosis.

What can be behind those relationships? The relatively high omega-6 fat content of pork may be a contributing factor, but it can’t be the whole story. It seems there is something else in pork that makes pork consumption risky.

What is it about pork that is so dangerous, and what does it mean for our dietary advice? That will be the topic of my next post.

Related Posts

Posts in this series:

References

[1] Bridges FS. Relationship between dietary beef, fat, and pork and alcoholic cirrhosis. Int J Environ Res Public Health. 2009 Sep;6(9):2417-25. http://pmid.us/19826553.

[2] Nanji AA, French SW. Relationship between pork consumption and cirrhosis.  Lancet. 1985 Mar 23;1(8430):681-3. http://pmid.us/2858627.

[3] Nanji AA, French SW. Hepatocellular carcinoma. Relationship to wine and pork consumption. Cancer. 1985 Dec 1;56(11):2711-2. http://pmid.us/2996744.

[4] Nanji AA, Narod S. Multiple sclerosis, latitude and dietary fat: is pork the missing link?  Med Hypotheses. 1986 Jul;20(3):279-82. http://pmid.us/3638477.

[5] Lauer K. The food pattern in geographical relation to the risk of multiple sclerosis in the Mediterranean and Near East region. J Epidemiol Community Health. 1991 Sep;45(3):251-2. http://pmid.us/1757770.

[6] Lauer K. Dietary changes in relation to multiple sclerosis in the Faroe Islands: an evaluation of literary sources. Neuroepidemiology. 1989;8(4):200-6. http://pmid.us/2755551.

[7] Lauer K. Environmental nitrophenols and autoimmunity. Mol Immunol. 1990 Jul;27(7):697-8. http://pmid.us/2395440.

[8] Nanji AA, French SW. Dietary factors and alcoholic cirrhosis. Alcohol Clin Exp Res. 1986 Jun;10(3):271-3. http://pmid.us/3526949.

Around the Web; Why I Blog Edition

[1] Why I Blog: A few weeks ago Joan asked my advice for her sister, who has suffered from eczema for over 40 years:

My 59 year old sister has Chronic Fatigue Syndrome…. Since her teens she has had from time to time small scaly patches that resolve with omega-6 supplementation…. At the present time she is taking 2 tablespoons of organic cold-pressed safflower oil 4X a day to control it. If she misses a dose her arms and face rapidly develop eczema which in a short time opens up and oozes.

As it happens, the primary symptom of an omega-6 deficiency is eczema. We discuss this in the book on p 55:

In humans, the main symptom of an omega-6 deficiency is a dry scaly skin rash. In the 1940s and 1950s, it was common to feed infants a fat-free milk formula – skim milk with sugar.  After some months, these infants developed eczema which could be cured by providing lard, which is about 10% PUFA.

Why was she becoming omega-6 deficient despite eating 8 tbsp (120 ml) a day of safflower oil? If omega-6 is deficient the body won’t consume it for energy. But omega-6 (and omega-3) fats are also destroyed by oxidation; our book discusses this on pp 65-67. Controlled oxidation of the longer 20-carbon omega-6 fatty acids to eicosanoids is exploited by the body as a signal of infections and stimulant of immune activity. Uncontrolled oxidation turns omega-6 fats into dangerous aldehydes.

To destroy 100 ml of safflower oil per day requires a huge level of oxidative stress. It indicates some sort of infection, and a severe deficiency of antioxidants. So I advised supplementation with zinc, copper, selenium, vitamin C, vitamin E and glutathione, as well as vitamins D, A, and K2 which help fight infections.

This week Joan gave us an update:

Hi Paul,

You will remember 12 days ago I asked you about my sister who has CFS and was taking 100 mls a day of safflower oil to keep eczema under control….

Your advice was spot on and the results have been miraculous. She started supplementation with zinc, copper, selenium, vitamins C, E, D and K and NAC. Within 24 hours her eczema was much improved and she began reducing the safflower oil. Now 10 days later she is down to 10 mls of safflower oil and is confident she can discontinue it completely in a few days. Her eczema has completely cleared and her skin is looking good.

Not only that, but some of her CFS symptoms have improved. Her constant headache is not as severe, irregular heartbeat episodes have almost completely stopped and she is tolerating slightly more physical activity. Needless to say she is absolutely delighted and wants me to pass on her deepest gratitude to you. Her words are, “It’s a miracle”. Once again Proverbs 13:12 springs to mind. “Hope deferred makes the heart sick, but a longing fulfilled is a tree of life.” Her sense of despair and resignation has gone and you have given her hope of a better future. Words seem inadequate to express thanks for that.

Congratulations, Joan’s sister! And thank you, Joan, for passing on your sister’s results. It made my day. And that’s why we blog – to try to develop and share knowledge of dietary and nutritional healing methods that, without our work, would be overlooked, leaving people to suffer needlessly.

[2] Vigilance is the Price of Liberty: Steve Cooksey, Diabetes Warrior, is being threatened by the North Carolina Board of Dietitians for giving dietary advice without a license. His crimes can be seen on this notice from the official investigation review:

If people are writing you with diabetic specific questions and you are responding you are no longer just providing information – you are counseling – you need a license to provide this service.

Here you are giving this person advice based on what she has said to you…. Counseling/advising requires a license.

You guided her (for her friend) to your meal plan – indirectly you conducted an assessment and provided advice/nutritional counseling.

The director of the Board of Dietitians consoled him: “even IF convicted, it would only be a misdemeanor.” Steve is looking for an attorney.

Of course, laws like this would make it illegal for me to respond to questions too. “Miracles” like that of Joan’s sister would be outlawed, in the hope that a few politically connected dietitians might make a few more dollars.

And it doesn’t end with licensing. The licensees get subject to standards of practice and have to conform or risk loss of their livelihood. Their ability to innovate is stifled; in time bureaucraticized medicine can sap even their will or ability to serve patients.

All of us should be outraged at these corrupt attempts to deprive us of freedom of speech, and of freedom to enter a profession as entrepreneurs with innovative approaches.

[3] Music to Read By: Rhapsody in Blue, played by piano and tap shoes:

[4] Interesting Items this Week:

Friend of the blog Allan Balliett is up and running with his Biodynamics Now podcast at www.bdnow.org. He’s kicked off the podcast with two star guests: Joel Salatin, self-described “Christian-libertarian-environmentalist-capitalist-lunatic-Farmer,” and Sally Fallon Morell, leader of the Weston A Price Foundation. An interview with Dr Thomas Cowan, author of The Fourfold Path to Healing and a Weston Price Foundation affiliated doctor, is coming up soon; visit Allan’s blog to leave questions for Dr Cowan.

Via Allan’s interview, I learned that Sally Fallon has fulfilled a dream. She owns a farm and is making cheeses.

We were very happy to see our diet mentioned in the Sunday, Jan 22, 2012 US Wellness Meats newsletter. GrasslandBeef.com, of course, is a great source of PHD-compatible food.

Chris Kresser has a new podcast: Why It’s So Hard To Lose Weight – And Keep It Off.

Prof Dr Andro compares BPA, soy, and corn oil: which is the best endocrine disruptor?

Via Russ Farris, a new paper suggests that high levels of vitamin D increase inflammation and raise CRP.

Dan’s Plan credits bacon with saving the life of a 4 year old boy.

Chris Masterjohn says zinc defends against AGE production, and that vitamins A and D protect against autoimmune disease.

Michael Ellsberg explains how he overcame bipolar disorder.

Gary Taubes has an update. His colleague Peter Attia is blogging at “The War on Insulin” and they are starting an “insurgency” to wage this war. Meanwhile, a medical student at Virginia Commonwealth, Larry Istrail, has started the Ancestral Weight Loss Registry.

Seth Roberts defends personal science.

It pays to have a good marriage: an 85-year-old woman beat off a moose attack on her 82-year-old husband.

Future Pundit gives us an interesting fact about autism: the twin with the smaller birth weight is more likely to become autistic.

Iodide heart scans confirm that it’s risky to suddenly increase iodine intake: people who take a high dose of iodine for imaging studies are more likely to develop thyroid disease in subsequent years. Iodine is good for us, but protect your thyroid by starting low, combining it with selenium, and increasing the dose very slowly.

A testimonial at robbwolf.com: Paleo works better than immune suppression for ulcerative colitis.

Homeopathy for nematodes? Drinking 0.01 proof alcohol is sufficient to extend the lifespan of worms.

A mystery illness is afflicting upstate New York teens. Video at the link. Erin Brockovich is involved.

Jamie Scott continues his series on the adipogenic nature of omega-6 fats.

Emily Deans reports that Lactobacillus rhamnosus knows how to control our mood.

CarbSane reports that saturated fat is more likely than polyunsaturated fat to induce gestational diabetes.

Stephan Guyenet adds a nail to the coffin of the insulin-obesity hypothesis, but Peter Dobromylskyj pulls one out: he shows that adipose tissue needs insulin receptors if hypothalamic damage is to be obesogenic in mice.

Via Shari Bambino on Facebook, it seems you can’t trust cheap supermarket olive oil. Much of it is soybean oil mixed with low-grade olive-pomace oil.

Mat Lalonde critiques evolutionary arguments for Paleo, but some of his counter-arguments are just as flawed as the views he criticizes.

Steve Phinney and Rick Johnson discuss ketogenic diets.

[5] Cute animal:

Via naked capitalism.

[6] Dr Mercola finds our dietary advice helpful: The “safe starches” debate is still making converts:

After trying both approaches, my experience suggests that Dr. Jaminet’s position is more clinically relevant….

When I eliminated all my grains and starchy vegetables, I actually experienced some negative effects. My energy levels declined considerably, and my cholesterol, which is normally about 150, rose to over 200. It appears I was suffering a glucose deficiency and this can trigger lipoprotein abnormalities. It also seemed to worsen my kidney function. So, while carbohydrate restriction is a miracle move for most people, like most good things in life, you can overdo it.

This information really underscores how important glucose is as a nutrient, and some people can’t manufacture glucose from protein as well as others, so they need SOME starches in their diet or else they will suffer from metabolic stress….

My experience now shows me that I need to have some source of non-vegetable carbs. I still seek to avoid nearly all grains, except for rice and potatoes. I typically limit my total carbohydrate calories to about 25 percent of total daily intake, and my protein to about 15 percent, with the additional 60 percent coming from healthful fats like butter, egg yolks, avocados, coconut oil, nuts and animal fat.

However, that is what works for me. You must listen to YOUR body and perform your own experiment. The bottom line is how your body responds, and you’re the ONLY one who can determine that.

On Facebook, A.b. Dada noted health improvements when adding rice and potatoes to a too-low-carb diet:

I added back white potatoes and even white rice based on Dr. Harris’ advice and definitely feel better (less orthostatic hypotension) — plus I’m actually slimmer than I’ve ever been, yet my muscles are much stronger.

Low carb for 12 years before this year!

There were a lot of nice comments on the “Is It Good to Eat Sugar?” post, including good ones from ET and Jim Jozwiak that I’ll probably discuss this coming week.

[7] More cute animals: From the BBC, “That’s Life,” 1986:

[8] Shou-Ching’s Photo Art:

[9] Weekly Video: Jazz concert:

My Theory of Obesity, I: “The Fat Trap”

In the January 1 edition of The New York Times Magazine, Tara Parker-Pope’s “The Fat Trap” looks at one of the most interesting aspects of obesity: how difficult it is to keep lost weight from coming back.

I skimmed it when it first came out, but after an email arrived this morning inviting me to sign a petition authored by Gary Taubes, I decided to read it carefully.

Ms. Parker-Pope’s article is excellent. Since it presents valuable evidence on some issues I have been planning to write about, I thought I’d use it to begin expounding my theory of obesity.

The Yo-Yo Dieting Pattern

A common experience on weight loss diets is successful weight loss – but often not to normal weight – followed by unremitting hunger that requires heroic willpower to resist, and ultimate capitulation leading to weight regain. This pattern may repeat itself in yo-yo fashion.

Parker-Pope describes a recent study from The New England Journal of Medicine:

After a year, the patients already had regained an average of 11 of the pounds they struggled so hard to lose. They also reported feeling far more hungry and preoccupied with food than before they lost the weight.

While researchers have known for decades that the body undergoes various metabolic and hormonal changes while it’s losing weight, the Australian team detected something new. A full year after significant weight loss, these men and women remained in what could be described as a biologically altered state. Their still-plump bodies were acting as if they were starving and were working overtime to regain the pounds they lost…. It was almost as if weight loss had put their bodies into a unique metabolic state, a sort of post-dieting syndrome that set them apart from people who hadn’t tried to lose weight in the first place.

The study measured hormonal levels a year after the weight loss:

One year after the initial weight loss, there were still significant differences from baseline in the mean levels of leptin (P<0.001), peptide YY (P<0.001), cholecystokinin (P=0.04), insulin (P=0.01), ghrelin (P<0.001), gastric inhibitory polypeptide (P<0.001), and pancreatic polypeptide (P=0.002), as well as hunger (P<0.001).

Note that insulin levels were still lowered, even as the participants were re-gaining weight:

Decreases in insulin levels after weight loss were evident, and the interaction between postprandial period and study week was significant (P<0.001), with significant reductions in meal-stimulated insulin release 30 and 60 minutes after eating, both from baseline to week 10 (P<0.001 for the two postprandial comparisons) and from baseline to week 62 (P<0.001 for the comparison at 30 minutes; P = 0.01 for the comparison at 60 minutes).

Gary Taubes, in his petition, complains that Ms. Parker-Pope “forgot to mention that the hormone insulin is primarily responsible for storing fat in her fat tissue”; perhaps this omission was just as well.

Resistance to Weight Gain

There is variability in the response to overfeeding. Commenting on a seminal series of experiments published in the 1990s by Canadian researchers Claude Bouchard and Angelo Tremblay, Parker-Pope writes:

That experimental binge should have translated into a weight gain of roughly 24 pounds (based on 3,500 calories to a pound). But some gained less than 10 pounds, while others gained as much as 29 pounds.

Note that eating a pound’s worth of calories typically led to something like a half-pound of weight gain; this shows that weight increases lead to energy expenditure increases. This was in a study in which the subjects were prevented from exercising. Likely the weight gain would have been generally lower if the subjects had been free to move as they wished.

Genes Influence But Don’t Decide

Genes – at least the known ones – are not determinate for obesity:

Recently the British television show “Embarrassing Fat Bodies” asked Frayling’s lab to test for fat-promoting genes, and the results showed one very overweight family had a lower-than-average risk for obesity.

Successful Weight Loss Is Possible

Some people do lose weight successfully:

The National Weight Control Registry tracks 10,000 people who have lost weight and have kept it off. “We set it up in response to comments that nobody ever succeeds at weight loss,” says Rena Wing, a professor of psychiatry and human behavior at Brown University’s Alpert Medical School, who helped create the registry with James O. Hill, director of the Center for Human Nutrition at the University of Colorado at Denver. “We had two goals: to prove there were people who did, and to try to learn from them about what they do to achieve this long-term weight loss.” Anyone who has lost 30 pounds and kept it off for at least a year is eligible to join the study, though the average member has lost 70 pounds and remained at that weight for six years.

Kudos to Drs. Wing and Hill: This is precisely the kind of data-gathering effort that is needed to help us understand weight loss.

The results, at least as reported by the Times piece, aren’t what most dieters want to hear. The people who kept weight off were those who basically continued some form of calorie restriction indefinitely:

There is no consistent pattern to how people in the registry lost weight — some did it on Weight Watchers, others with Jenny Craig, some by cutting carbs on the Atkins diet and a very small number lost weight through surgery. But their eating and exercise habits appear to reflect what researchers find in the lab: to lose weight and keep it off, a person must eat fewer calories and exercise far more than a person who maintains the same weight naturally.

If this is true, then few people have figured out how to cure their obesity. Rather, they’ve just found ways to keep weight off while remaining “metabolically damaged.” They can’t live like normal people and maintain a normal weight.

Paleo Helps

The piece then goes on to discuss the case of Janice and Adam Bridge. Mrs. Bridge peaked at 330 pounds in 2004, now weighs 195; Mr. Bridge peaked at 310 pounds and now weighs 200.

Mrs. Bridge stays at 195 pounds with a reduced-carb Paleo-style diet:

Based on metabolism data she collected from the weight-loss clinic and her own calculations, she has discovered that to keep her current weight of 195 pounds, she can eat 2,000 calories a day as long as she burns 500 calories in exercise. She avoids junk food, bread and pasta and many dairy products and tries to make sure nearly a third of her calories come from protein.

No junk food (presumably sugar), bread, pasta, or dairy is pretty Paleo. Compared to the standard American diet, it’s low in carbs and high in protein.

Persistent Alterations in the Formerly Obese

The article points to other sources of evidence for metabolic differences between the obese and the never-obese.

[O]ne woman who entered the Columbia studies [of Drs Rudolph Leibel and Michael Rosenbaum] at 230 pounds was eating about 3,000 calories to maintain that weight. Once she dropped to 190 pounds, losing 17 percent of her body weight, metabolic studies determined that she needed about 2,300 daily calories to maintain the new lower weight. That may sound like plenty, but the typical 30-year-old 190-pound woman can consume about 2,600 calories to maintain her weight — 300 more calories than the woman who dieted to get there.

Presumably 190 pounds is still obese for the “typical” 30-year-old woman. So the reduced-weight obese woman is burning fewer calories than a same-size obese woman who never reduced her weight.

So obesity followed by a malnourishing weight loss diet often creates persistent changes that hinder further weight loss, or even maintenance of the lower weight. One observation:

Muscle biopsies taken before, during and after weight loss show that once a person drops weight, their muscle fibers undergo a transformation, making them more like highly efficient “slow twitch” muscle fibers. A result is that after losing weight, your muscles burn 20 to 25 percent fewer calories during everyday activity and moderate aerobic exercise than those of a person who is naturally at the same weight.

Another observation in these patients is persistent hunger. Self-reported hunger is confirmed by observable changes in the brain:

After weight loss, when the dieter looked at food, the scans showed a bigger response in the parts of the brain associated with reward and a lower response in the areas associated with control.

In the Columbia patients, the effect is highly persistent:

How long this state lasts isn’t known, but preliminary research at Columbia suggests that for as many as six years after weight loss, the body continues to defend the old, higher weight by burning off far fewer calories than would be expected. The problem could persist indefinitely.

What Caused the Metabolic Alterations?

Are these persistent alterations to the body caused by the original obesity, or by the malnourishing diet that produced the weight loss? Dr. Leibel believes that the cause was the obesity, but that it is slow-acting – requiring an extended period of fatness:

What’s not clear from the research is whether there is a window during which we can gain weight and then lose it without creating biological backlash…. [R]esearchers don’t know how long it takes for the body to reset itself permanently to a higher weight. The good news is that it doesn’t seem to happen overnight.

“For a mouse, I know the time period is somewhere around eight months,” Leibel says. “Before that time, a fat mouse can come back to being a skinny mouse again without too much adjustment. For a human we don’t know, but I’m pretty sure it’s not measured in months, but in years.”

However, other researchers are exploring the possibility that it was the malnourishing weight loss diet that was at fault:

One question many researchers think about is whether losing weight more slowly would make it more sustainable than the fast weight loss often used in scientific studies. Leibel says the pace of weight loss is unlikely to make a difference, because the body’s warning system is based solely on how much fat a person loses, not how quickly he or she loses it. Even so, Proietto is now conducting a study using a slower weight-loss method and following dieters for three years instead of one.

My Theory of Obesity: Lean Tissue Feedback

I’m going to be spelling out my theory of obesity over coming months, but let me introduce here a few hypotheses which can account for the data reported in Ms. Parker-Pope’s article.

I believe the brain defends not only (or primarily) an amount of fat mass, but also the health of the body, as reflected by the quantity and quality of lean tissue.

So it is plausible to speak in terms of set points, but there are two set points: a “fat mass set point”, and a “lean tissue quality set point.” The second is dominant: Lean tissue is essential to life, while gains in fat mass may diminish fitness in some environments but will increase fitness in others and are rarely catastrophic. So the tissue-quality set point usually dominates the fat mass set point in its influence upon the brain and behavior.

Feedback to the brain about the quantity of fat mass comes to the brain through a hormone, leptin, that researchers can easily monitor; but feedback about the state of lean tissue comes through the nerves, which sense the state of tissues throughout the body. Lean tissue is too important for health, and can be degraded in so many different ways, that signals about its state cannot be entrusted to a fragile, low-bandwidth mechanism like a hormone. Lean tissue signaling uses the high-bandwidth communications of the nervous system. This feedback system is hard for researchers to monitor.

So the “fat mass set point” is visible to researchers, but the “lean tissue quality set point” is invisible. This is why researchers focus on the fat mass set point, while actual dieters, who know their own experiences are not explained by a simple fat mass set point theory, resist the idea.

Malnutrition will decrease tissue quality, triggering the brain to increase appetite (to get more nutrients) and diminish resource utilization (to conserve nutrients).

If the diet is deficient in the nutrients needed to build tissue, but rich in calories, then tissue-driven increases in appetite and reductions in nutrient utilization may (not necessarily, because the body has many resources for optimizing lean tissue and fat mass independently) lead to an increase in fat mass. Eventually a rise in leptin counterbalances the tissue-driven signals, but this occurs at a new equilibrium featuring higher fat mass, higher appetite, and reduced nutrient utilization compared to the pre-obese state.

Leptin signaling is responsible for the resistance to fat mass increases. The degree to which this resistance affects outcomes depends on the quality of lean tissue. The higher the quality of lean tissue, the less the brain needs to protect it and the more sensitive it is to leptin. The lower the quality of lean tissue, the more lean-tissue drives dominate and the more the brain ignores leptin signals (is “leptin resistant”).

Malnourishing “starvation” weight loss diets degrade lean tissue, and therefore they make the brain hungrier then it was before the weight loss, more eager to conserve resources that might be useful to lean tissue, and more leptin resistant.

However, weight loss diets that restrict calories, but improve the nourishment of lean tissue, should have the opposite effect. They should make the brain less hungry, less focused on conserving resources, and more leptin sensitive.

How much has to be eaten to provide adequate nourishment to lean tissue? In Perfect Health Diet: Weight Loss Version (Feb 1, 2011), I explored this question. Just to provide the necessary macronutrients to maintain lean tissue, I believe it’s necessary to consume at least 1200 calories per day. To optimize micronutrients as well, it’s probably necessary to supplement, even on a 1200 calorie diet. This is on a perfectly-designed diet. The less nourishing the diet, the more calories will be needed to eliminate tissue-driven hunger.

The Experiences of Perfect Health Dieters

A few Perfect Health Dieters have been using our diet for weight loss for a long enough period of time – 9-12 months – to test this hypothesis.

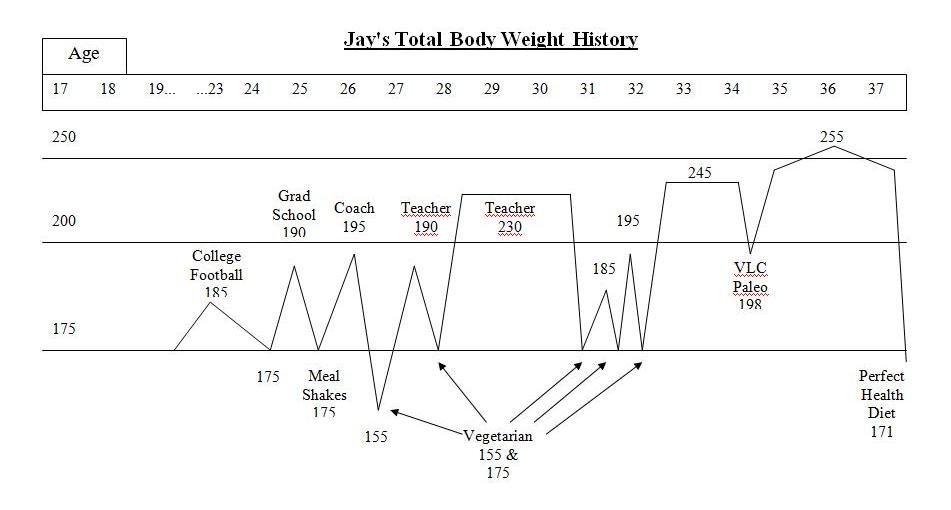
Jay Wright’s Weight Loss Journey (Dec 1, 2011) is a carefully chronicled account. Jay became overweight in college, obese by age 28, and had been obese for 10 years by the time he started our diet. He described his weight loss history:

I was a yo-yo dieter – I could lose weight but it always ended up even higher. I tried meal shake replacements, frozen dinners to limit calories, no meat/meat, no dairy/dairy, acid/alkaline, exercise/no exercise while dieting, no cash or credit cards in my wallet going to work so I wouldn’t stop at a fast food, punishment where I had to eat a raw tomato if I cheat (I hate raw tomatoes), and many other vegetarian leaning and mental tricks.  A pattern emerged with these diets.  I would starve with low energy for about a week or two until my will power ran out. Then, I would go eat something “bad.”  If I continued to repeat the pattern and managed to be “successful,” I stayed hungry even once I reached my goal weight.  I tried to transition to a “regular” amount of food to stop starving and just maintain but to no avail.  My weight went right back up even higher than before even without cheating on the diets.

This yo-yo pattern of hunger followed by weight regain exactly fits the experiences described in Tara Parker-Pope’s article.

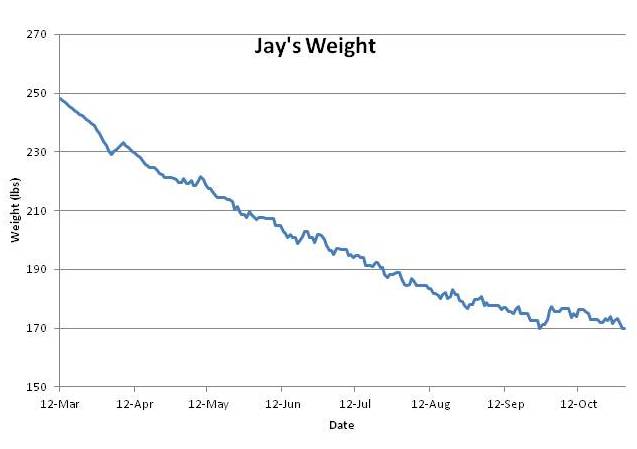
However, Jay’s experience on PHD breaks the pattern. Jay went from 250 pounds to 170 pounds – his normal weight – in six months. Weight loss was steady and he experienced little hunger. He’s maintained his normal weight without regain for 3 months.

This is just as my theory predicts. PHD is a lean-tissue supporting diet, and if his lean tissue is well nourished, he should feel little hunger. If his lean tissue heals fast enough, then his lean-tissue drive will decrease faster than his leptin signaling, his equilibrium weight determined by the balance of these two drives will always be below his actual weight, and he should experience smooth weight loss. Which he did:

Jay’s experience is counter-evidence to many of the ideas put forth by the academic researchers in Ms. Parker-Pope’s article. For instance, Dr. Leibel’s theory that months of obesity create a persistent rise in set point is refuted; Jay had been obese for 10 years but his set point was quickly reset.

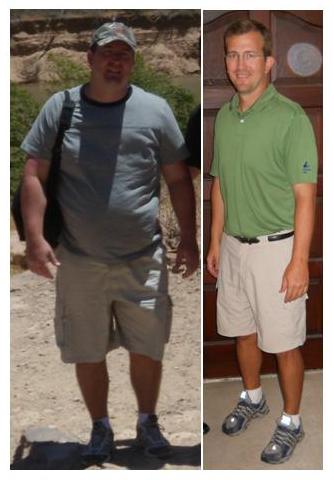
Here are Jay’s before and after photos:

Conclusion

I’ll be spelling out my theory of obesity in much more detail later; this is only a first installment.

But I’ll say this: I’ve been gratified by the experiences of people who have tried our diet for weight loss. Our Results page has many reports of reduced hunger, reduced food cravings, and weight loss.

Even those who have not lost weight have reported greatly reduced hunger. I think that means their lean tissue is becoming better nourished, causing the brain to feel less urgency about acquiring more nutrients.

I think this reduction in hunger is the proper first step to healthy weight loss. And I hope that in time we can gather enough case studies to prove that a nourishing diet like the Perfect Health Diet is the best approach to weight loss — and to a genuine cure for obesity.