Category Archives: Nutrients - Page 2

Nutrition and Pregnancy, I: Nutritional Triage

Happy Mother’s Day!

2013 Mothers DayMother’s Day seems an auspicious time to begin a series on nutrition in pregnancy. It is an important topic, as I believe pregnant mothers are often alarmingly malnourished.

Triage Theory

“Triage theory,” put forward by Bruce Ames [1], is an obviously true but nevertheless important idea. It offers a helpful perspective for understanding the consequences of malnourishment during pregnancy

Triage theory holds that we’ll have evolved mechanisms for devoting nutrients to their most fitness-improving uses. When nutrients are scarce, as in times of famine, available nutrients will be devoted to the most urgent functions – fuctions that promote immediate survival. Less urgent functions – ones which affect end-of-life health, for instance – will be neglected.

Ames and his collaborator Joyce McCann state their theory with, to my mind, an unduly narrow focus: “The triage theory proposes that modest deficiency of any vitamin or mineral (V/M) could increase age-related diseases.” [2]

McCann and Ames tested triage theory in two empirical papers, one looking at selenium [2] and the other at vitamin K [3]. McCann & Ames used a clever method. They used knockout mice – mice in which specific proteins were deleted from the genome – to classify vitamin K-dependent and selenium-dependent proteins as “essential” (if the knockout mouse died) or “nonessential” (if the knockout mouse was merely sickly). They then showed experimentally that when mice were deprived of vitamin K or selenium, the nonessential proteins were depleted more deeply than the essential proteins. For example:

  • “On modest selenium (Se) deficiency, nonessential selenoprotein activities and concentrations are preferentially lost.” [2]
  • The essential vitamin K dependent proteins are found in the liver and the non-essential ones elsewhere, and there is “preferential distribution of dietary vitamin K1 to the liver … when vitamin K1 is limiting.” [3]

They also point out that mutations that impair the “non-essential” vitamin K dependent proteins lead to bone fragility, arterial calcification, and increased cancer rates [3] – all “age-related diseases.” So it’s plausible that triage of vitamin K to the liver during deficiency conditions would lead in old age to higher rates of osteoporosis, cardiovascular disease, and cancer.

Generalizing Triage Theory

As formulated by Ames and McCann, triage theory is too narrow because:

  1. There are many nutrients that are not vitamins and minerals. Macronutrients, and a host of other biological compounds not classed as vitamins, must be obtained from food if health is to be optimal.
  2. There are many functional impairments which triage theory might predict would arise from nutrient deficiencies, yet are not age-related diseases.

I want to apply triage theory to any disorder (including, in this series, pregnancy-related disorders) and to all nutrients, not just vitamins and minerals.

Macronutrient Triage

Triage theory has already been applied frequently on our blog and in our book, though not by name. It works for macronutrients as well as it does for micronutrients.

Protein, for instance, is preferentially lost during fasting from a few locations – the liver, kidneys, and intestine. The liver loses up to 40 percent of its proteins in a matter of days on a protein-deficient diet. [4] [5] This preserves protein in the heart and muscle, which are needed for the urgent task of acquiring new food.

Protein loss can significantly impair the function of these organs and increase the risk of disease. Chris Masterjohn has noted that in rats given a low dose of aflatoxin daily, after six months all rats on a 20 percent protein diet were still alive, but half the rats on a 5 percent protein diet had died. [6] On the low-protein diet, rats lacked sufficient liver function to cope with the toxin.

Similarly, carbohydrates are triaged. On very low-carb diets, blood glucose levels are maintained so that neurons, which need a sufficient concentration gradient if they are to import glucose, may receive normal amounts of glucose. This has misled many writers in the low-carb community into thinking that the body cannot face a glucose deficiency; but the point of our “Zero-Carb Dangers” series was that glucose is subject to triage and, while blood glucose levels and brain utilization may not be diminished at all on a zero-carb diet, other glucose-dependent functions are radically suppressed. This is why it is common for low-carb dieters to experience dry eyes and dry mouth, or low T3 thyroid hormone levels.

One “zero-carb danger” which I haven’t blogged about, but have long expected to eventually be proven to occur, is a heightened risk of connective tissue injury. Carbohydrate is an essential ingredient of extracellular matrix and constitutes approximately 5% to 10% of tendons and ligaments. One might expect that tendon and ligament maintenance would be among the functions put off when carbohydrates are unavailable, as it takes months for these tissues to degrade. If carbohydrates were unavailable for a month or two, there would be little risk of connective tissue injury. Since carbohydrate deprivation was probably a transient phenomenon in our evolutionary environment, except in extreme environments like the Arctic, it would have been evolutionarily safe to deprive tendons and ligaments of glucose in order to conserve glucose for the brain.

Recently, Kobe Bryant suffered a ruptured Achilles tendon about six months after adopting a low-carb Paleo diet. It could be coincidence – or it could be that he wasn’t eating enough carbohydrate to meet his body’s needs, and carbohydrate triage inhibited tendon maintenance.

Triage Theory and Pregnancy-Related Disorders

I think triage theory may helpfully illuminate the effects of nutritional deficiencies during pregnancy. When a mother and her developing baby are subject to nutritional deficiencies, how does evolution partition scarce resources?

Nutritional deficiencies are extremely common during pregnancy. For example, anemia develops during 33.8% of all pregnancies in the United States, 28% of women are still anemic after birth [source].

It’s likely that widespread nutritional deficiencies impair health to some degree in most pregnant women.

Those who have read our book know that we think malnutrition is a frequent cause of obesity and diabetes. Basically, we eat to obtain every needed nutrient; if the diet is unbalanced, then we may need an excess of fatty acids and glucose before we have met our nutritional needs. This energy excess can, in the right circumstances, lead to obesity and diabetes.

But obesity and diabetes are common features of modern pregnancy. Statistics:

  • 5.7% of pregnant American women develop gestational diabetes. [source]
  • 48% of pregnant American women experience a weight gain during pregnancy of more than about 35 pounds. [source]

I take the high prevalence of these conditions as evidence that pregnant women are generally malnourished and the need for micronutrition stimulates appetite, causing women to gain weight and/or develop gestational diabetes.

Another common health problem of pregnancy is high blood pressure: 6.7% of pregnant American women develop high blood pressure [source]. This is another health condition which can be promoted by malnourishment.

It’s likely that nutritional deficiencies were also common during Paleolithic pregnancies. If so, there would have been strong selection for mechanisms to partition scarce nutrients to their most important uses in both developing baby and mother.

A Look Ahead

So:

  1. Nutritional deficiencies are widespread during modern pregnancies.
  2. They probably lead to measurable health impairments and weight gain in many pregnant women.
  3. The specific health impairments that arise in pregnant women or their babies are probably determined by which nutrients are most deficient, and by evolutionary triage which directs nutrients toward their most important functions and systematically starves other functions.
  4. Due to variations in how triage is programmed, deficiency of a nutrient during pregnancy may present with somewhat different symptoms than deficiency during another period of life.

This series will try to understand the effects of some common nutritional deficiencies of pregnancy. Triage theory may prove to be a useful tool for understanding those effects. Based on the incidence of possibly nutrition-related disorders like excessive weight gain, gestational diabetes, and hypertension, it looks like there may be room for significant improvements to diets during pregnancy.

Are Low Doses of Niacin Dangerous?

In Food Fortification: A Risky Experiment?, Mar 23, 2012, we began looking at the possibility that fortification of food, especially the enriched flours used in commercial baked goods, with niacin, iron, and folic acid may have contributed to the obesity and diabetes epidemics.

As this plot shows, fortification caused intake of per capita niacin intake in the United States to rise from about 20 mg/day to about 32 mg/day:

Multivitamins typically contain about 20 mg niacin, so (a) a typical American taking a multivitamin is getting 52 mg/day niacin, and (b) if the increase of 12 mg/day due to fortification is dangerous, then taking a multivitamin would be problematic too.

There wasn’t evidence of niacin deficiency at 20 mg/day. The RDA was set at 16 mg/day for men and 14 mg/day, levels that equalize intake with urinary excretion of niacin metabolites [source: Dietary Reference Intakes]. Fortification of grains with niacin was designed to make refined white wheat have the same niacin content as whole wheat, not to rectify any demonstrated deficiency of niacin.

B-vitamins are normally considered to have low risk for toxicity, since they are water soluble and easily excreted. But recently, scientists from Dalian University in China proposed that niacin fortification may have contributed to the obesity and diabetes epidemics. [1] [2]

Niacin, Oxidative Stress, and Glucose Regulation

The Chinese researchers note that niacin affects both appetite and glucose metabolism:

[N]iacin is a potent stimulator of appetite and niacin deficiency may lead to appetite loss [10]. Moreover, large doses of niacin have long been known to impair glucose tolerance [23,24], induce insulin resistance and enhance insulin release [25,26].

They propose that niacin’s putative negative effects may be mediated by oxidative stress, perhaps compounded by poor niacin metabolism:

Our recent study found that oxidative stress may mediate excess nicotinamide-induced insulin resistance, and that type 2 diabetic subjects have a slow detoxification of nicotinamide. These observations suggested that type 2 diabetes may be the outcome of the association of high niacin intake and the relative low detoxification of niacin of the body [27].

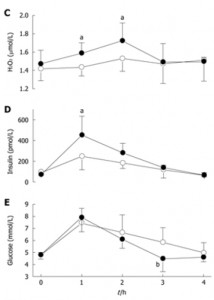
The effect of niacin on glucose metabolism is visible in this experiment. Subjects were given an oral glucose tolerance test of 75 g glucose with or without 300 mg nicotinamide. [1, figure source]

Dark circles are from the OGTT with niacinamide, open circles without. Plasma hydrogen peroxide levels, a marker of oxidative stress, and insulin levels were higher in the niacinamide group. Serum glucose was initially slightly higher in the niacinamide group, but by 3 hr had dropped significantly, to the point of hypoglycemia in two subjects:

Two of the five subjects in NM-OGTT had reactive hypoglycemia symptoms (i.e. sweating, dizziness, faintness, palpitation and intense hunger) with blood glucose levels below 3.6 mmol/L [64 mg/dl]. In contrast, no subjects had reactive hypoglycemic symptoms during C-OGTT. [1]

Of course 300 mg is a ten-fold higher niacinamide dose than most people obtain from food, but perhaps chronic intake of 32 mg/day (52 mg/day with a multivitamin) daily over a period of years have similar cumulative effects on glucose tolerance as a one-time dose of 300 mg.

Is There a Correlation with Obesity?

OK. Is there an observable relationship between niacin intake and obesity or diabetes?

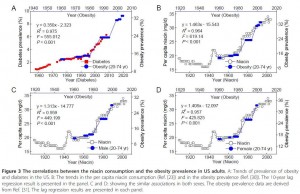
There may be, but only with a substantial lag. Here is a figure that illustrates the possible connection [2, figure source]:

Niacin intake maps onto obesity rates with a 10-year lag. After niacin intake rose, obesity rates rose 10 years later. Note the scaling: a 60% increase in niacin intake was associated with a doubling of obesity rates 10 years later.

Obesity leads diabetes by about 15 years, so we could also get a strong correlation between niacin intake and diabetes incidence 25 years later. The scaling in this case would be a 35% increase in niacin associated with a 140% increase in diabetes prevalence after a lag of 25 years.

How seriously should we take this? As evidence, it’s extremely weak. There was a one-time increase in niacin intake at the time of fortification. A long time later, there was an increase in obesity, and long after that, an increase in diabetes. So we really have only 3 events, and given the long lag times between them, the association between the events is highly likely to be attributable to chance.

It was to emphasize the potential for false correlations that I put the stork post up on April 1 (Theory of the Stork: New Evidence, April 1, 2012). Just because two data series can be made to line up, with appropriate scaling of the vertical axis and lagging of the horizontal axis, doesn’t mean there is causation involved.

Is There Counter-Evidence?

Yes.

If niacin from wheat fortification is sufficient to cause obesity or diabetes, with an average intake of 12 mg/day, then presumably the 20 mg of niacin in multivitamins would also cause obesity or diabetes.

So we should expect obesity and diabetes incidence to be higher in long-time users of multivitamins or B-complex vitamins.

But in fact, people who take multivitamins or B-complex vitamins have a lower subsequent incidence of obesity and diabetes.

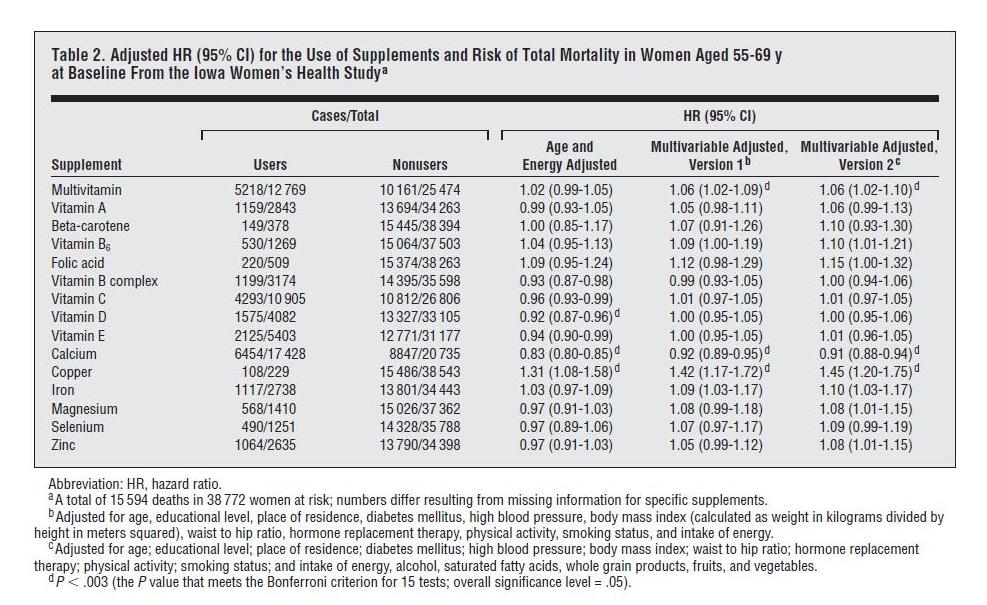
One place we can see this is in the Iowa Women’s Health Study, discussed in a previous post (Around the Web; The Case of the Killer Vitamins, Oct 15, 2011). In that post I looked at a study analysis which was highly biased against vitamin supplements; the authors chose to do 11-factor and 16-factor adjustments designed to make supplements look bad. The worst part of the analysis, from my point of view, was using obesity and diabetes as adjustment factors in the regression analysis. As you can see in the table below, multivariable adjustment including obesity and diabetes significantly raises the mortality associated with consumption of multivitamins or B-complex supplements:

This increase in hazard ratios (“HR”) with adjustment for obesity and diabetes almost certainly indicates that the supplements reduce the incidence of these diseases.

Multivitamins are protective in other studies too. The relation between multivitamin use and subsequent incidence of obesity was specifically analyzed in the Quebec Family Study, which found that “nonconsumption of multivitamin and dietary supplements … [was] significantly associated with overweight and obesity in the cross-sectional sample.” [3]

Does this exculpate niacin supplementation? I don’t think so. In general, improved nutrition should reduce appetite, since the point of eating is to obtain nutrients. So it’s no surprise that multivitamin use reduces obesity incidence. But multivitamins contain many nutrients, and it could be that benefits from the other nutrients are concealing long-term harms from the niacin.

Conclusion

At this point I think the evidence against niacin is too weak to convict in a court of law.

Nevertheless, we do have:

  • Clear evidence that high-dose (300 mg) niacinamide causes oxidative stress and impaired glucose tolerance. If niacinamide can raise levels of peroxide in the blood, what is it doing at mitochondria?
  • No clear evidence for benefits from niacin fortification or supplementation.

Personally I see no clear evidence that niacin supplementation, even at the doses in a multivitamin, is likely to be beneficial. Along with other and stronger considerations, this is pushing me away from multivitamin use and toward supplementation of specific individual micronutrients whose healthfulness is better attested.

I also think that food fortification was a risky experiment with the American people, and stands as yet another reason to avoid eating grains and grain products. (And to rinse white rice before cooking, to remove the enrichment mixture.)

References

[1] Li D et al. Chronic niacin overload may be involved in the increased prevalence of obesity in US children. World J Gastroenterol. 2010 May 21;16(19):2378-87. http://pmid.us/20480523.

[2] Zhou SS et al. B-vitamin consumption and the prevalence of diabetes and obesity among the US adults: population based ecological study. BMC Public Health. 2010 Dec 2;10:746. http://pmid.us/21126339.

[3] Chaput JP et al. Risk factors for adult overweight and obesity in the Quebec Family Study: have we been barking up the wrong tree? Obesity (Silver Spring). 2009 Oct;17(10):1964-70. http://pmid.us/19360005.

Food Fortification: A Risky Experiment?

We’ve learned enough in the last two years to revisit the supplementation advice from our book, and toward that end I am starting a series on micronutrients.

I’ve recently been looking at some papers studying the effects of food fortification with micronutrients. These changes provide a sort of “natural experiment” which may provide insight into the benefits and risks of supplementation.

Fortification of Food

Grain products are the most important category of fortified foods. Industrially produced baked goods must generally use enriched flour, and Wikipedia (“Enriched Flour”) tells us what they’re enriched with:

According to the FDA, a pound of enriched flour must have the following quantities of nutrients to qualify: 2.9 milligrams of thiamin, 1.8 milligrams of riboflavin, 24 milligrams of niacin, 0.7 milligrams of folic acid, and 20 milligrams of iron.

This is an ironic choice of nutrients. While thiamin and riboflavin are harmless, niacin, folic acid, and iron are three micronutrients we recommend NOT supplementing in the book. Another nutrient we recommend NOT supplementing, vitamin A, is also a fortified nutrient, although not in flour.

Sales Cartoon #6021 by Andertoons

Perhaps not even for that!

A history of nutrient fortification over time can be found at this USDA site. Enrichment has a long history, but the amount of fortification has increased substantially since the 1960s. Enrichment mixtures were added to rice, cornmeal/grits, and margarine beginning in 1969, and to ready-to-eat cereals, flour, and semolina beginning in 1973. Inclusion of high levels of folic acid in all enriched foods became mandatory in 1998.

You may have noticed that when putting raw rice in water, a white powder comes off the rice. This is the enrichment mixture which contains folic acid. According to the American Rice Company (hat tip: Matthew Dalby),

The enrichment mixture is applied to rice as a coating. Therefore, it is recommended that rice not be rinsed before or after cooking and not be cooked in excessive amounts of water and then drained. The enrichment … would be lost.

This is useful information: We can remove the enrichment coating by rinsing rice before cooking. That may turn out to be a good idea!

The Contribution of Fortification to Nutrient Intake

Using USDA data for the four nutrients most likely to be harmful in excess, I made up a chart of the contribution of fortified nutrients to total nutrient intake among Americans. It looks like this:

You can see sharp rises in fortified niacin and folic acid in 1973, in iron in 1983, and again in folic acid in 1998. By 1998, folic acid in fortified foods constituted 44% of all dietary folate, and enrichment mixtures provided one-third of all iron and niacin. Fortified vitamin A provided about 10% of all dietary vitamin A from 1964 through 2000.

Folic Acid

Here is a chart of per capita daily intake of fortified folic acid plus natural food folate in the United States since 1950:

Folate intake from foods has always been around 300 mcg per day, and jumped sharply when folic acid intake became mandatory in 1998. The USDA estimates that intake of folate, including folic acid, jumped from 372 mcg per person per day in 1997 to 678 mcg in 1998, and has remained above 665 mcg ever since (source).

For those who eat a lot of wheat products, intake may be even higher. A pound of enriched white flour has 770 mcg folic acid along with its 1660 calories. If Americans were getting 372 mcg folate from food prior to folic acid fortification, then someone eating a pound of enriched wheat products per day would be getting about 1,142 mcg folate from all food sources.

It’s not uncommon to eat substantial amounts of enriched wheat. The typical American eats 474 g (1800 calories) carbohydrate per day. Most of that is from enriched grains. Those eating industrially produced breads, cookies, crackers, and breakfast cereals may have a very high folic acid intake.

Add in a multivitamin – most multivitamins have 400 mcg and prenatal vitamins have 800 mcg – and a sizable fraction of the population has a folate intake of 1,500 to 1,900 mcg per day, 1200 to 1600 of it as synthetic folic acid. This is well above the tolerable upper limit (UL) for folic acid of 1000 mcg (Wikipedia, “Folate”).

Averaged over all Americans, folic acid from fortified foods comprises 44% of all food-sourced folate, but for Americans taking a multivitamin folic acid becomes 65% of all folate and, for those taking a prenatal vitamin, 75%.

There are several potential health problems that could arise from excessive intake of folic acid, and I’ll explore a few in this series.

Iron and Niacin

Iron intake has risen by about 50% due to fortification:

Niacin intake has also risen about 50%:

These two nutrients have similar concerns:

  • An excess of each promotes infections. Niacin (in the NAD+ form) is the rate-limiting factor in bacterial metabolism. Iron is a critical mineral for oxygen handling and is needed by most infectious pathogens; in fact the immune response tries to lock up iron in ferritin during infections.
  • Both niacin and iron are involved in oxygen handling during metabolism and an excess of each can aggravate oxidative stress.

Vitamin A

Although fortification never increased vitamin A intake by more than 10%, it may serve as a marker for consumption of artificial sources of vitamin A from supplements. Moreover, total food intake of vitamin A was apparently affected by fortification; food intake of vitamin A rises in the 1960s when fortification was growing, and falls after 2000 when intake of fortified vitamin A decreased:

In the book we noted studies showing that people whose intake of vitamin A was above 10,000 IU/day tended to have higher mortality. This was most commonly observed in people taking multivitamins.

There was a period of enthusiasm for vitamin A supplementation between the 1960s and 2000. Multivitamins had more vitamin A in that period. After studies showed negative results, the vitamin A content of multivitamins was reduced.

It is possible that the source of problems may not be vitamin A per se, but degradation products of vitamin A. I’ve previously blogged about how vitamin A plus DHA (a fatty acid in fish oil) plus oxidative stress can produce highly toxic degradation products (see DHA and Angiogenesis: The Bottom Line, May 4, 2011; Omega-3s, Angiogenesis and Cancer: Part II, Apr 29, 2011; Omega-3 Fats, Angiogenesis, and Cancer: Part I, Apr 26, 2011).

Naturally occurring vitamin A in foods is located in lipid fractions and protected from oxidation by accompanying antioxidants (eg vitamin E) and oxidation-resistant lipids. Vitamin A from fortification is not so carefully protected. The Food and Agriculture Organization of the United Nations comments:

Foods which have been successfully fortified with vitamin A include margarine, fats and oils, milk, sugar, cereals, and instant noodles with spice mix. Moisture contents in excess of about 7-8% in a food are known to adversely affect the stability of vitamin A. Beyond the critical moisture content there is a rapid increase in water activity which permits various deteriorative reactions to occur. Repeated heating, as may be experienced with vegetable oils used for frying, is known to significantly degrade vitamin A. The hygroscopic nature of salt has prevented its use as a vehicle for vitamin A fortification in countries of high humidity. In trying overcome this problem, a new vitamin A fortificant, encapsulated to provide an additional moisture barrier, was evaluated with limited success. The cost of using highly protected fortificants can be prohibitive in many cases.

There aren’t many foods that don’t contain 7% water, or acquire it after fortification, so degradation is a real concern.

Vitamin A in multivitamins may also be exposed to degradation. The possibility of vitamin A degradation, especially in combination with DHA from fish oil and oxidative stress, is why I’m skeptical of the health merits of fermented cod liver oil.

Conclusion

I think exploring the effects of fortification will be an interesting topic.

We will consider whether fortification may play a role in various diseases that have become more common since 1970 or 1998, such as obesity, diabetes, and autism.

And we will consider what the health effects of food fortification may tell us about how to optimize micronutrient supplementation.


Higher Carb Dieting: Pros and Cons

Last week’s post (Is It Good to Eat Sugar?, Jan 25, 2012) addressed what I see as the most problematic part of the thought of the health writer Ray Peat – his support for sugar consumption.

Apart from this difference, “an extreme amount of overlap is evident,” Danny Roddy notes, in our views and Peat’s. Both perspectives oppose omega-6 fats, support saturated fats, favor eating sufficient carbs to normalize metabolism, support eating nourishing foods like bone broth, and oppose eating toxic foods like wheat.

If there is another difference between our ideas and Peat’s, it’s that “Peat-atarians” often eat more carbs. Danny puts it:

Paul and Peat have similar recommendations for carbohydrate consumption. Paul’s recommendations hover around 150 grams while Peat usually recommends 180-250 grams, but he himself eats closer to ~400 grams.

So I thought it might be worth looking at the issue of overall carb consumption.

Carbs for Hypothyroidism

In Is There a Perfect Human Diet? (Jan 18, 2012) we noted that diseases can change the optimal diet. In some diseases it’s better to lower carb consumption, but in others it’s better to increase carb consumption. The example we gave is hepatitis; hepatitis B and C viruses can exploit the process of gluconeogenesis to promote their own replication, so high-carb diets which avoid gluconeogenesis tend to slow down disease progression.

Another disorder that might benefit from more carb consumption is hypothyroidism. A number of people with hypothyroidism have benefited from Peat-style carb consumption. Here is ET commenting on last week’s post:

As someone following the PHD with a good dash of Peat, I really enjoy this post and the comments. Thank you Paul….

Paul says that “I’m not persuaded that it’s a desirable thing to keep liver glycogen filled at all times, but for some health conditions it may be good to tend that way, like hypothyroidism.” Well, according to Chris Kresser, 13 of the top 50 selling US drugs are either directly or indirectly related to hypothyroidism. If going by either the low body temperature/low pulse diagnostic, and/or some kind of pattern on the serum tests (Anti-TG, TPO, TSH, free T-3, free T4, total T3, total T4), we are talking a significant proportion of the population, especially women, being hypothyroid in some form….

Many with low T3 have a conversion problem from T4 in the liver (80% of T3 is converted from T4 in the liver and kidneys – only a small portion is coming from the thyroid gland).

Is it a good idea to NOT try to fill the liver glycogen in such a pattern? For those who have lived with the consequences of low T3 (adrenaline rush, waking up in the middle of the night, fatigue, tendency to orange-yellowish color i the face etc.), and had improvements on a more Peat like diet, I do not think so.

The way to fill liver glycogen, of course, is by eating more carbs.

I’ve previously noted that increased carb consumption upregulates the levels of T3 thyroid hormone (Carbohydrates and the Thyroid, Aug 24, 2011):

T3, the most active thyroid hormone, has a strong effect on glucose utilization. T3 stimulates glucose transport into cells, and transport is the limiting factor in glucose utilization in many cell types. In hyperthyroidism, a condition of too much T3, there are very high levels of glucose utilization. Administration of T3 causes elevated rates of glycolysis regardless of insulin levels.

The body can reduce T3 levels by converting T4 into an inactive form called reverse T3 (rT3) rather than active T3. High rT3 levels with low T3 levels lead to reduced glucose transport into cells and reduced glucose utilization throughout the body.

This means that eating more carbs raises T3 levels, and eating fewer carbs lowers T3 levels.

For a hypothyroid person, then, eating more carbs is an alternative tactic for increasing thyroid hormone activity. It may provide symptomatic relief similar to that achieved by supplementing thyroid hormone directly.

Perhaps the two are complementary tactics that should be done together. Taking thyroid hormone pills will increase glucose utilization, creating a need to eat more carbs. A mix of the two tactics may be optimal.

UPDATE: Mario points out that most cases of hypothyroidism in advanced countries are due to Hashimoto’s, an autoimmune disease probably triggered by infections or gut dysbiosis, and eating more carbs will tend to flare any gut dysbiosis and thus aggravate the thyroiditis. Meanwhile, supplemental thyroid hormone tends to reduce antibody activity.

Carbs for Mood

Another interesting comment came from Jim Jozwiak:

Paul, this discussion gets to the crux of what I do not understand about the Perfect Health Diet. You are speaking as if refilling liver glycogen is a good thing, and it undoubtedly is, because mood is so much better when there is sufficient liver glycogen because then the brain is confident of its power supply. Also, you acknowledge that safe starch would eventually replenish liver glycogen after muscle glycogen is topped off. So why not eat enough starch to replenish liver glycogen? It is not so difficult to figure out how much that would be. Have some sugar, feel what replenished liver glycogen is like, then titrate safe starch gradually meal-by-meal to get the same effect. When I do it, and I am not an athlete, I get 260 grams of non-fiber carb per day, which is considerably more than you usually recommend. Have you tried this experiment and found the result unsatisfactory in some way?

Jim has experimented to find the amount of carbs that optimize his mood, and found it to be 260 g (1040 calories). On a 2400 calorie diet, typical for men, this would be 43% carbs.

If Peat typically recommends 180 to 250 g carbs, as Danny says, then on a 2000 calorie reference diet that would be 36% to 50% carbs.

Those numbers are strikingly similar to another statistic: The amount of carbs people actually eat in every country of the world.

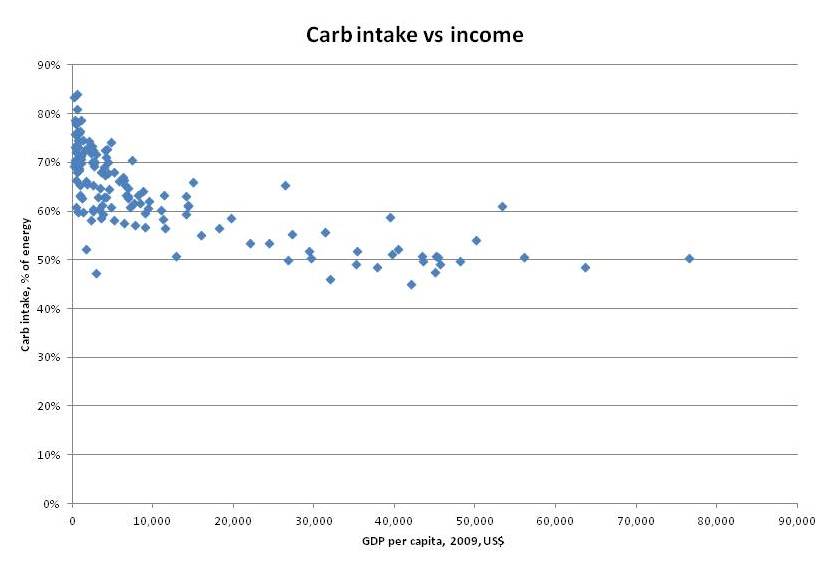
Here is a scatter plot of carb consumption vs per capita income by country. Dietary data comes from the FAO, income is represented by GDP per capita from the IMF:

At low incomes people eat mainly carbs, because the agricultural staples like wheat, rice, corn, and sorghum provide the cheapest calories.

As incomes rise, carb consumption falls, but it seems to approach an asymptote slightly below 50% carbs. The lowest carb consumption was France at 45%, followed by Spain, Australia, Samoa, Switzerland, Iceland, Italy, Austria, Belgium, and Netherlands.

We can guess that if money were no object, and people could eat whatever they liked, most people would select a carb intake between 40% and 50%.

This is precisely the range which Jim found optimized his mood.

The Longevity vs Fertility and Athleticism Trade-off

I won’t enumerate studies here, but animal studies indicate that higher carb and protein intakes promote fertility and athleticism, while restriction of carbohydrate and protein promotes longevity.

In our book, we calculate the daily glucose requirements of the human body at around 600 to 800 calories, or 30% to 40% of energy on a 2000-calorie diet.

So a 30-40% carb diet is a neutral diet, which probably places minimal stress on the body.

A 40-50% diet is a carb-overfed diet, which probably promotes fertility and athleticism.

A 20-30% diet is a mildly carb-restricted diet, which probably promotes longevity.

Do we see diminished longevity with higher carb consumption in human epidemiological data? I think so.

It’s useful to compare European countries, since they are genetically and culturally similar. There is a correlation between carbohydrate intake and longevity. Here is a list of life expectancy among 46 European countries. Neglecting little countries like Monaco, San Marino, and Andorra, that are not in my carb database, the countries with the longest life expectancy are also the ones with the lowest carb consumption: Italy first, France second, Spain third, Switzerland fourth, and Iceland sixth are all countries with carb intake below 50%. Sweden, at 50.8% carbs, placed fifth in longevity.

Did Evolution Hardwire a Preference for Carbs?

We know that the brain has an innate food reward system which tries to get people to eat a certain diet. What carbohydrate intake is it likely to select for?

Experiments on the food preferences of insects and rodents give us clues. The paper “Macronutrient balance and lifespan,” by Simpson and Raubenheimer, cited some time ago by Dennis Mangan, summarizes evidence from animals for the influence of macronutrients on lifespan. A good example is the fruit fly; protein has the dominant effect on lifespan, with low protein favoring longevity and high protein favoring fertility. The flies eat so as to maximize fertility:

The response surface for lifetime egg production peaked at a higher protein content than supported maximal lifespan (1:4 P:C, Figure 1A). This demonstrates that the flies could not maximize both lifespan and egg production rate on a single diet, and raises the interesting question of what the flies themselves prioritized – extending lifespan or maximizing lifetime egg production. Lee et al. [3] answered this by offering one of 9 complementary food choices in the form of separate yeast and sugar solutions differing in concentration. The flies mixed a diet such that they converged upon a nutrient intake trajectory of 1:4 P:C, thereby maximizing lifetime egg production and paying the price of a diminished lifespan.

This seems to be the evolutionary preference in mammals as well as flies. When unlimited food is available, animals tend to overfeed slightly on carb and protein, sacrificing lifespan for increased fertility and athleticism.

Jim reported improved mood on a 43% carb diet. Is it due to the filling of liver glycogen raising metabolism? Due to a sensation of enhanced fertility, libido, and athleticism? Or simply due to greater satisfaction of the brain’s reward system?

Yet another factor may also be involved.

Might Stress Be Mistaken for Enhanced Energy?

Peat favors sucrose as a carb source, which is why Danny Roddy recommended orange juice and Travis Culp soda. I argued in last week’s post that it would be better to eat a starchier diet so that the carb breakdown would be at least 70% glucose, less than 30% fructose and galactose.

Eating a higher-carb diet fills up liver glycogen, removing the most rapid fructose disposal pathway. This makes a high-carb sucrose-based diet rather stressful for the body; it has to dispose of fructose rapidly to avoid toxicity, but has limited ability to do so.

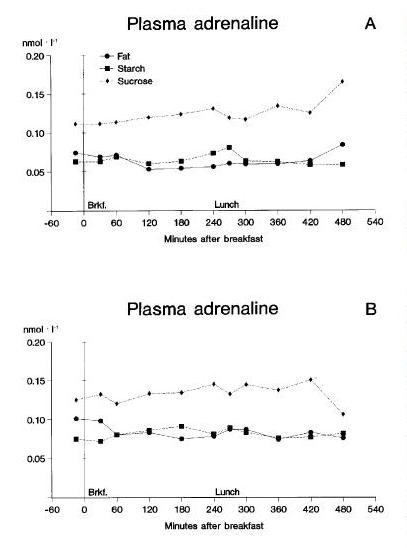
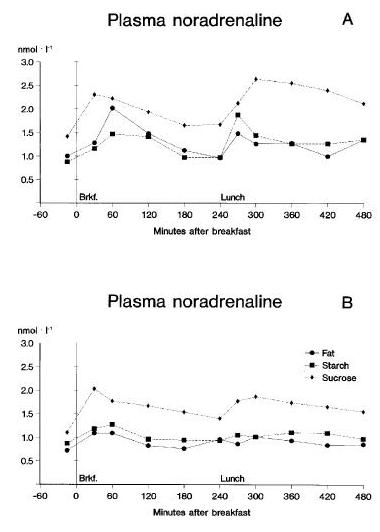
We can see the stressfulness of sucrose by its effects on the “fight-or-flight” stress hormones adrenaline (epinephrine) and noradrenaline (norepinephrine). Here is a study that fed high-fat, high-starch, and high-sucrose diets for 14 days to healthy non-obese subjects, and measured the hormonal response [1; full text]. This paper was discussed by the blog Proline (hat tip: Vladimir Heiskanen). The results:


On high-fat and high-starch diets, adrenaline and noradrenaline levels are low; they are consistently elevated — almost doubled — on the high-sucrose diet.

This makes sense; as Wikipedia notes,

epinephrine and norepinephrine are stress hormones that underly the fight-or-flight response; they increase heart rate, trigger the release of glucose from energy stores, and increase blood flow to skeletal muscle.

These hormones trigger the release of glucose from liver glycogen, thus freeing up room for fructose disposal.

Note that this result contradicts an assertion by Danny Roddy:

I consider the ability to refill glycogen (minimizing adrenaline & cortisol release) to be an important factor in health.

Refilling glycogen is not the same thing as minimizing adrenaline release. The requirement to dispose of fructose may trigger adrenaline release.

The reason I bring this up is not to renew the starch vs sugar discussion; but rather to ask if this “fight-or-flight” response to sugar consumption may not be partially responsible for the perceived mood and energy improvements on a Peat-style diet.

Indeed, one of the peculiar aspects of Ray Peat’s health advice is his recommendation to increase pulse rates well above normal levels. In his article on hypothyroidism, Peat states:

Healthy and intelligent groups of people have been found to have an average resting pulse rate of 85/minute, while less healthy groups average close to 70/minute.

I would have thought 60 beats per minute was normal, and when I was more athletic my pulse was typically 48 beats per minute.

One of the effects of adrenaline and noradrenaline is to speed up the pulse rate. If Peat really does eat 400 g of carbs per day, predominantly from sucrose, then he may be achieving his high pulse rate from an “adrenaline rush” that helps dispose of an excess of fructose.

If, indeed, this is a source of improved sense of well-being on Peat-style diets, it may be a double-edged sword. Chronic stimulation of the “fight-or-flight” hormones to aid in fructose disposal may have long-run negative consequences.

UPDATE: I’m reminded of this video, showing the adrenaline-promoting effects of sucrose consumption:


Starch would not have had the same effect, and would surely be healthier in the long run.

Summary

It is possible that higher carb intake may increase thyroid hormone levels, fertility, and athleticism, and enhance mood in some people. These gains do not come without cost. Notably, they probably involve a sacrifice of longevity.

If the benefits of higher carb intake are sought, it is best to achieve them by eating starches primarily, not sugar.

Conclusion

In our book, we recommend a slightly low-carb diet of 20-30% of calories. If we were re-writing the book now, we would probably be a bit less specific about what carb intake is best. Rather, we would say that a carb intake around 30-40% is neutral and fully meets the body’s actual glucose needs; and discuss the pros and cons of deviating from this neutral carb intake in either direction.

For most people, I believe a slightly carb-restricted intake of 20-30% of calories is optimal. Most people are not currently seeking to have children or engaging in athletic competition. There is good reason to believe that mild carb restriction maximizes lifespan, and most people desire long life. As we’ve noted, supercentenarians generally eat low-carb, high-fat diets.

But the spirit of our book is to educate, and let everyone design the diet that is best for them. And there is room for difference of opinion about the optimal carb intake.

References

[1] Raben A et al. Replacement of dietary fat by sucrose or starch: effects on 14 d ad libitum energy intake, energy expenditure and body weight in formerly obese and never-obese subjects. Int J Obes Relat Metab Disord. 1997 Oct;21(10):846-59. http://pmid.us/9347402. Full text: http://www.nature.com/ijo/journal/v21/n10/pdf/0800494a.pdf.