


If the only prayer you said was thank you, that would be enough. – Meister Eckhart
Happy Thanksgiving Day to all our American readers, and thank you to our readers everywhere!
Thanksgiving Day is a day of gratitude, and yet historically the holiday grew out of death and suffering. The first official Thanksgiving Day was declared by the Continental Congress in 1777 during the Revolutionary War, and Thanksgiving became established as an annual holiday in 1863 during the Civil War. The original American Thanksgiving was celebrated by the Mayflower Pilgrims who had arrived late in the New World, as winter was beginning; nearly half died that winter. Yet the 53 survivors befriended the local Indians and, with their help, soon flourished. After their first year, Edward Winslow described their success:
[O]ur harvest being gotten in, our governor sent four men on fowling, that so we might after a more special manner rejoice together, after we had gathered the fruit of our labors; they four in one day killed as much fowl, as with a little help beside, served the company almost a week, at which time amongst other recreations, we exercised our arms, many of the Indians coming amongst us, and among the rest their greatest King Massasoit, with some ninety men, whom for three days we entertained and feasted, and they went out and killed five deer, which they brought to the plantation and bestowed on our governor, and upon the captain, and others. And although it be not always so plentiful, as it was at this time with us, yet by the goodness of God, we are so far from want, that we often wish you partakers of our plenty. We have found the Indians very faithful in their covenant of peace with us; very loving and ready to pleasure us: we often go to them, and they come to us; some of us have been fifty miles by land in the country with them; the occasions and relations whereof you shall understand by our general and more full declaration of such things as are worth the noting, yea, it hath pleased God so to possess the Indians with a fear of us, and love unto us, that not only the greatest king amongst them called Massasoit, but also all the princes and peoples round about us, have either made suit unto us, or been glad of any occasion to make peace with us, … so that there is now great peace amongst the Indians themselves, which was not formerly, neither would have been but for us; and we for our parts walk as peaceably and safely in the wood, as in the highways in England, we entertain them familiarly in our houses, and they as friendly bestowing their venison on us.
It is often assumed that since Thanksgiving was a harvest festival, the Pilgrims must have been giving thanks primarily for prosperity. But in truth, their greatest blessing was friendship and peace with their neighbors. It is love and fellowship which most deserve our gratitude.
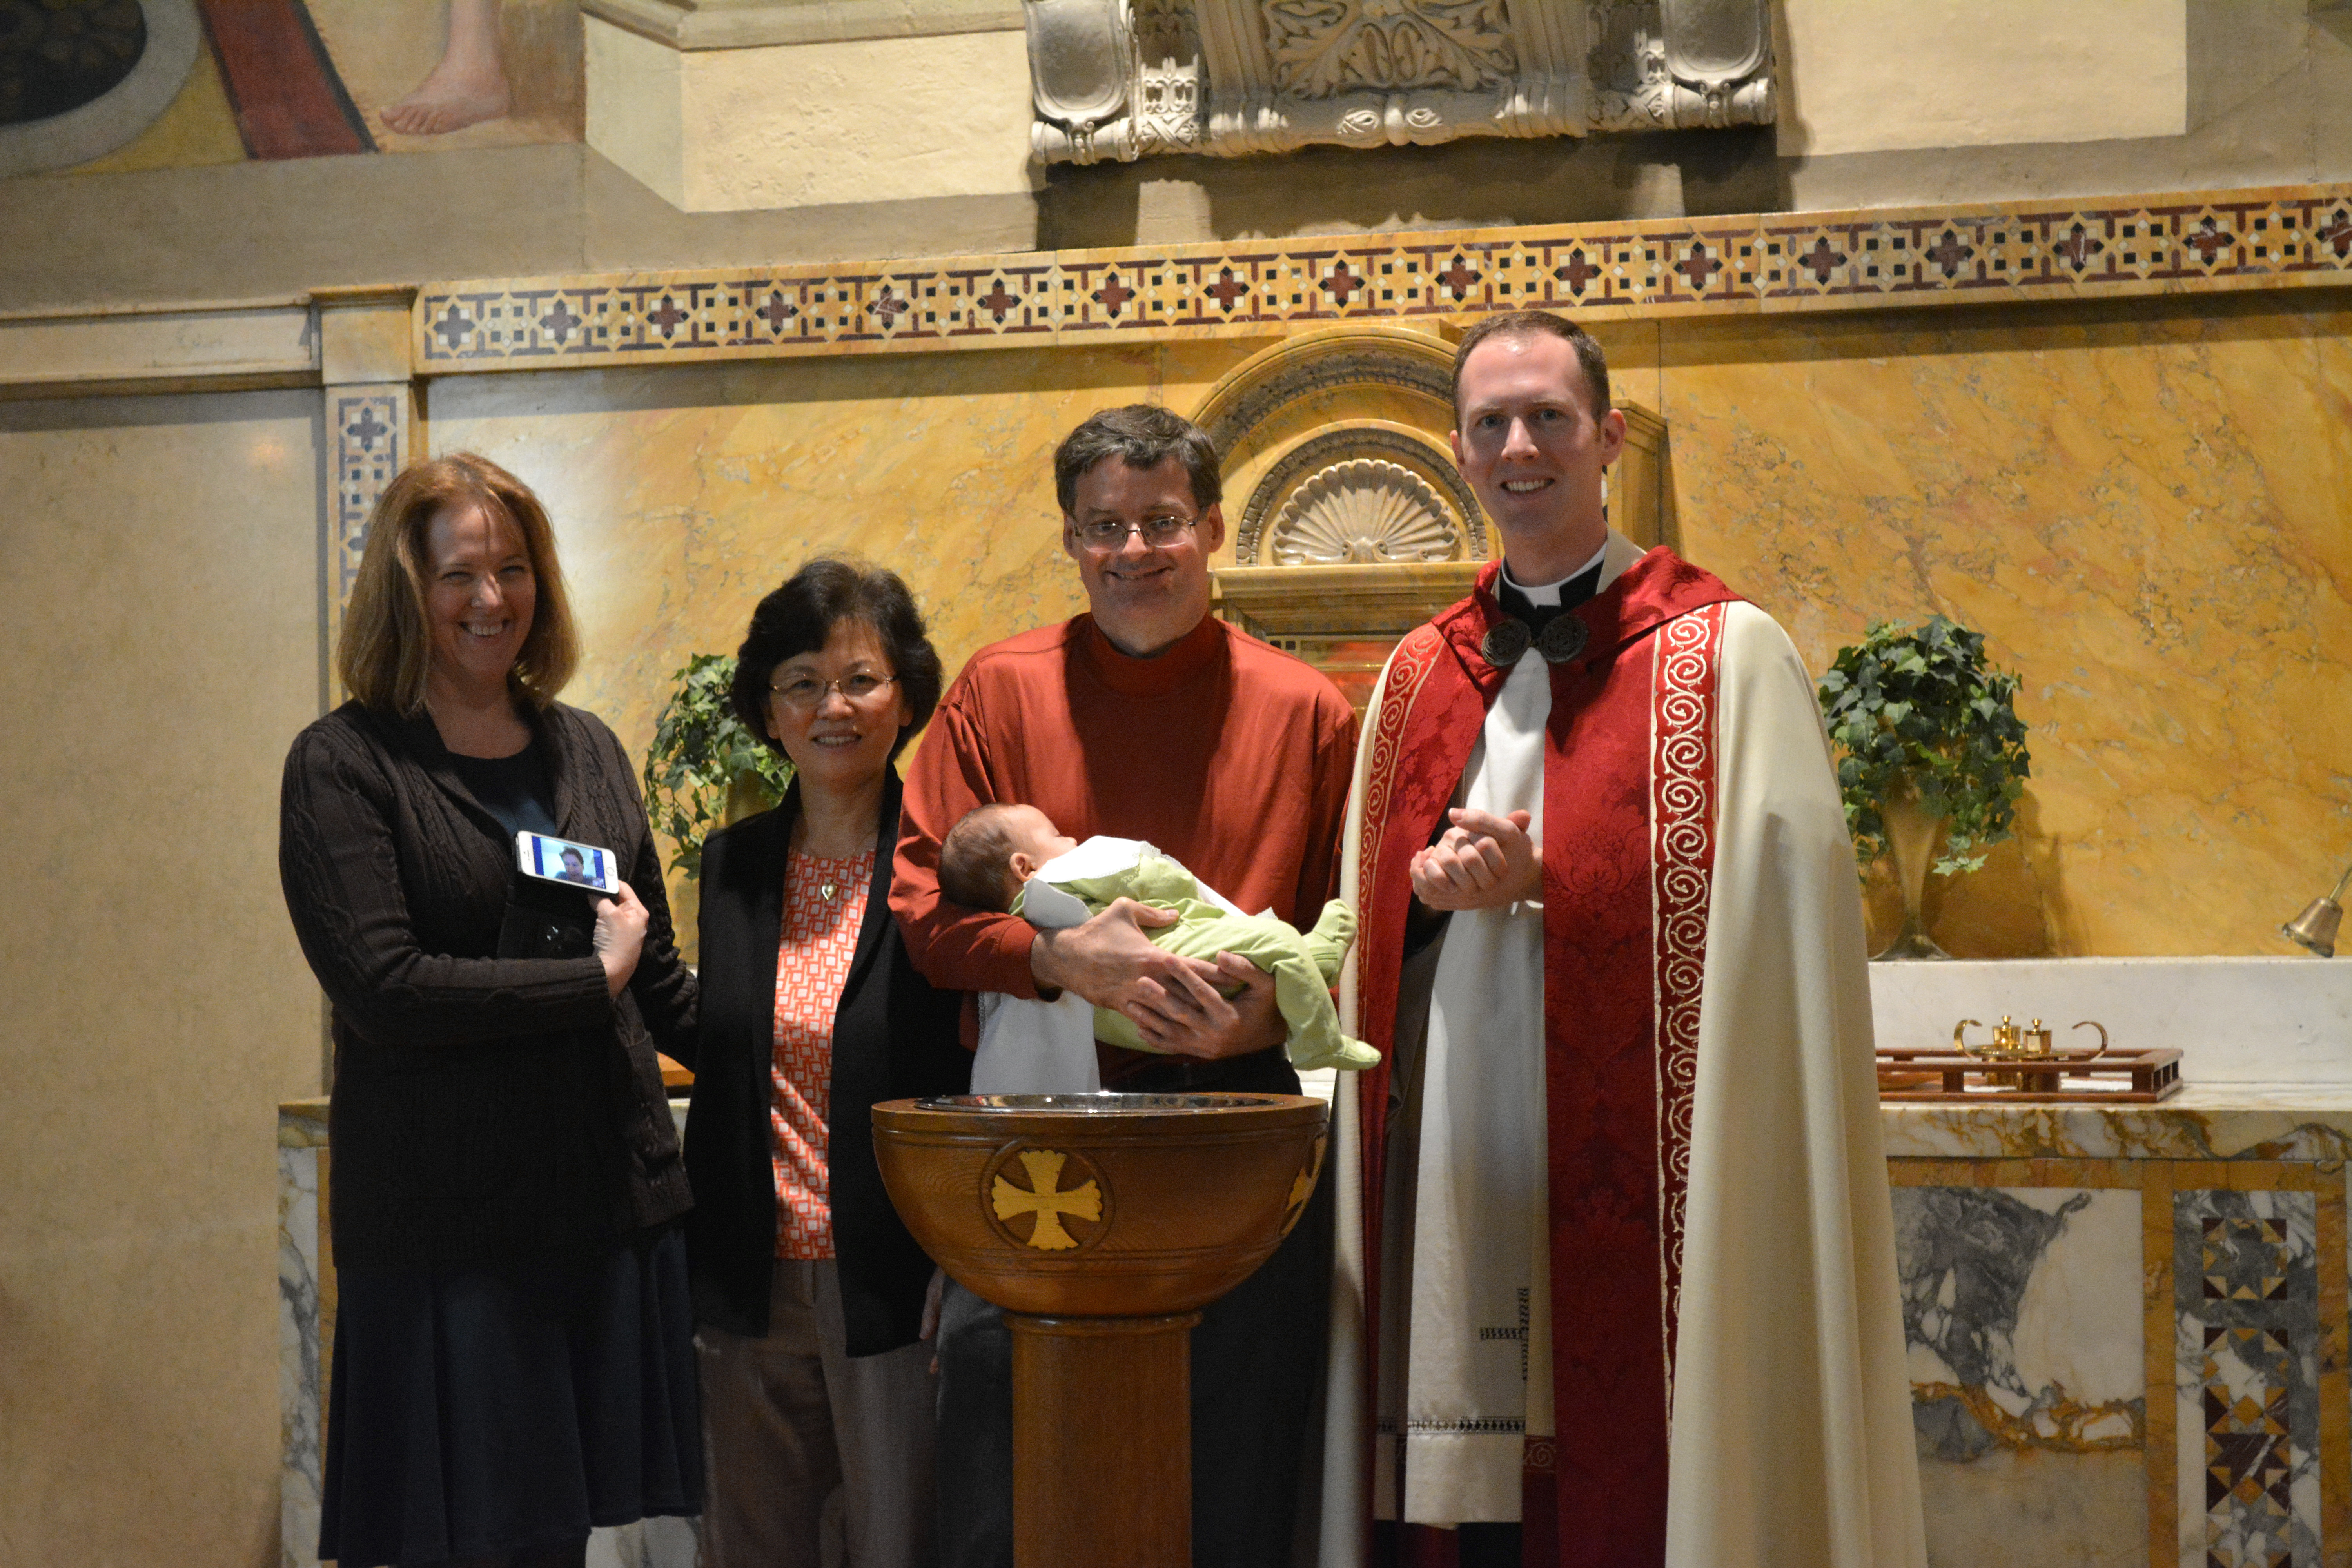
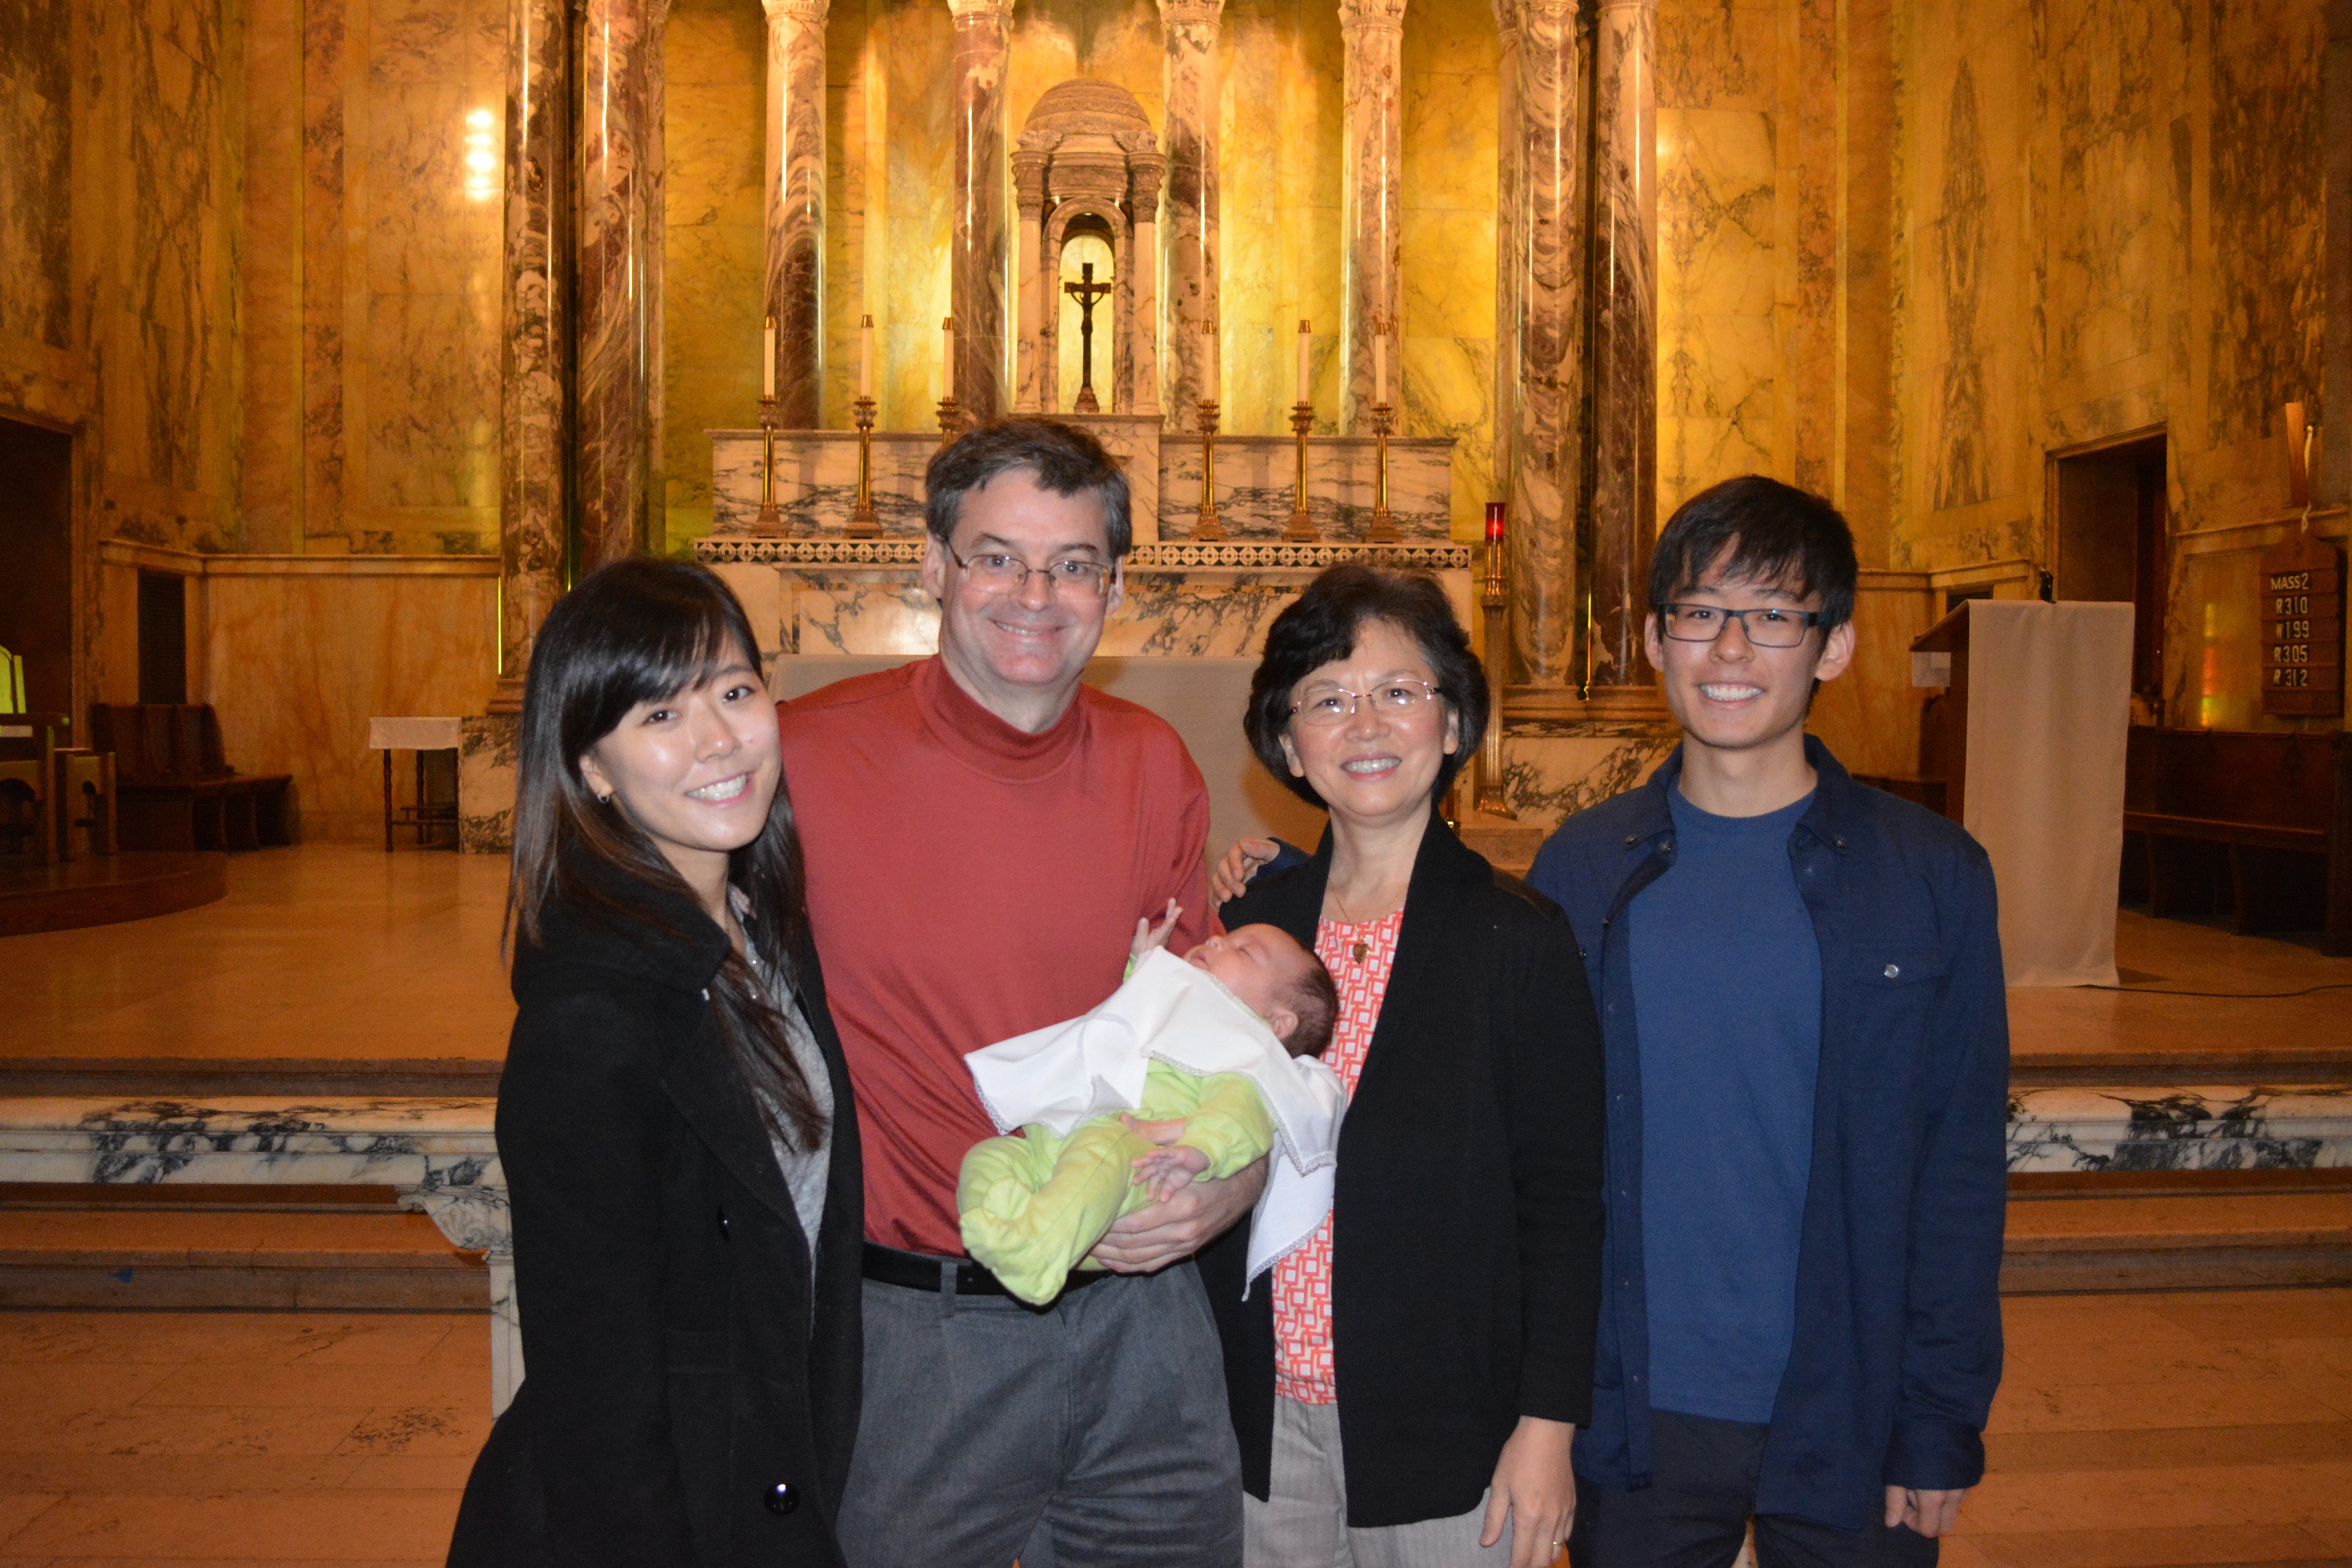
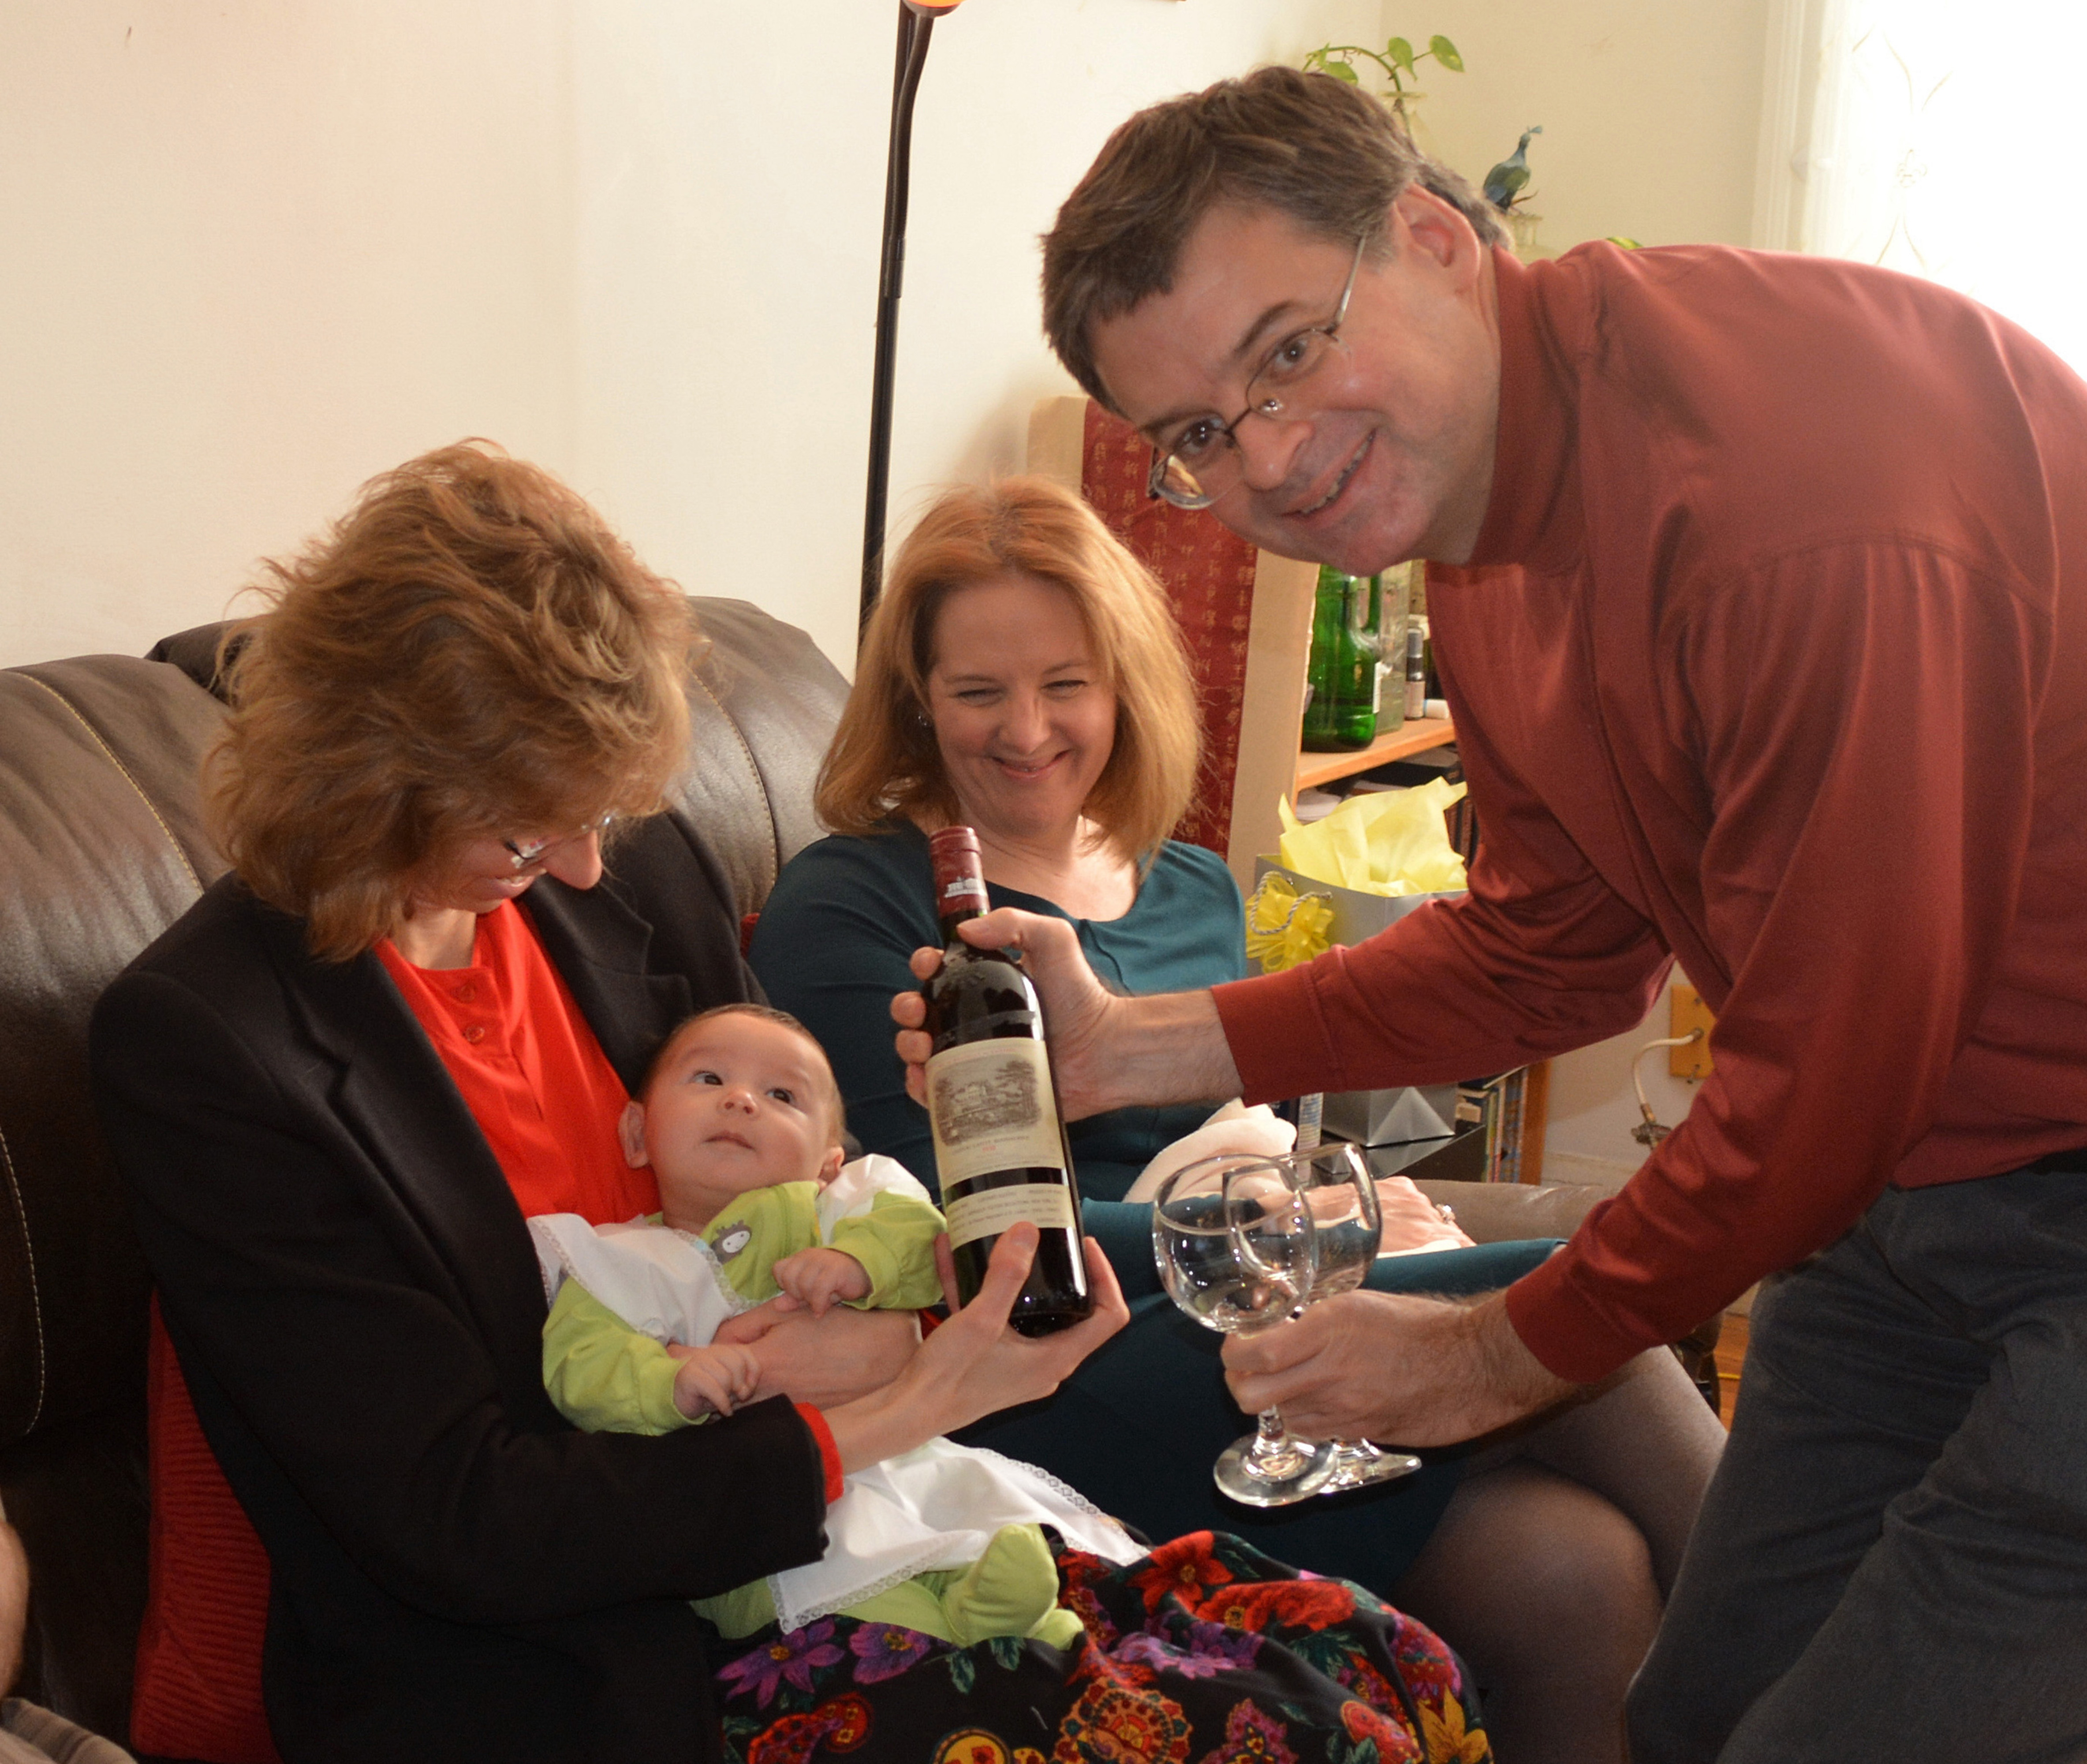
I posted my tribute to Mathias this week because these connections between death, love, and gratitude were in my mind. His life was brief, but rich in love; see the comments from Mathias’s grandmother Cheryl and mom Kindy. A dinner party is a good thing, though it comes to an end; a life is a blessing, be it however short. Mathias remains a blessing, and a reason for gratitude.
Shou-Ching, Luke, and I have much to be grateful for. I had originally intended to review today some of the health results sent in by readers, but I will save that for later. Suffice it to be said that we have many lovely online friends and are grateful for all of you. We wish you the best of health always.
Into every life, adversity will come. Yet no adversity, not even death, can extinguish our causes for gratitude. Therefore,
Serve the Lord with gladness; come before Him with joyful singing. . . . Enter His gates with thanksgiving and His courts with praise. Give thanks to Him, bless His name. For the Lord is good; His lovingkindness is everlasting and His faithfulness endures to all generations. (Psalm 100: 2,4-5)
Happy Thanksgiving everyone!


Recent Comments