Category Archives: Nutrients - Page 4

Around the Web; The Case of the Killer Vitamins

I’d like to thank Patrick Timpone for a very enjoyable interview on The Morning Show at One Radio Network. Here is the MP3; I’m on for the second half of the show. You can find a zip file at the archive for October 13. Patrick’s producer Sharon tells me that she’s already benefited from our book:

I was following The Primal Diet and since I read the book, I’ve been allowing myself potatoes and rice and doing very very well on them among doing some other things you recommend.

Also, I’d like to thank Jimmy Moore once more for hosting his highly entertaining “safe starch” symposium (Jimmy’s original post; my response, here and at Jimmy’s). It was great to get the opportunity to explain ourselves to so many people in the low-carb and Paleo movements.

Jimmy is planning to try our diet for a week in November, which will be a good occasion for us to publish a 7-day meal plan. We’ll invite anyone who’s curious to try the diet along with Jimmy, and compare notes.

[1] Interesting posts this week:

Angelo Coppola on Latest in Paleo wonders if Denmark’s saturated fat tax will apply to mother’s milk. If so, it’s bad news for unemployed infants! (He also discusses the “safe starch” debate.)

I once knew a French astronomer who died from snorting cocaine while observing at 14,500 feet. Emily Deans makes me wonder:  Did he have Crisco for dinner?

Stan the Heretic offers his mitochondrial dysfunction theory of diabetes. Peter Dobromylskyj and JS Stanton are also developing ideas along this line. Speaking of JS, his post this week has some great photos of Sierra wildflowers and reflections on the state of the Paleo community.

CarbSane partially confirms Dr. Ron Rosedale: eating carbs does raise leptin levels compared to eating fat, but it is a mild rise over an extended period of time, not a “spike.”

Beth Mazur explains why her bathroom door is always closed.

Chris Kresser discusses why chronic illness often generates a form of hypothyroidism, low T3 syndrome.

Joshua Newman knows how to flatter.

How solid is the case against Andrew Wakefield? Autism is certainly characterized by intestinal dysfunction, and Age of Autism notes that distinguished scientists are citing Wakefield’s work.

Richard Nikoley claims he doesn’t know the words to “Kumbayah.”

Seth Roberts points out that the Specific Carbohydrate Diet has been curing Crohn’s for 80 years, but still no clinical trial.

Jamie Scott, That Paleo Horse Doctor, asks: Why do horses get laminitis?

We’ve quoted vegetarian Dr. Michael Greger’s concerns about arsenic in eggs. I’m more concerned about soy protein in eggs.

Following Steve Jobs’s death, Tim asked for an opinion about the unconventional cancer therapies of Dr Mercola’s friend Nicholas Gonzalez. David Gorski, toward the end of a detailed examination of Jobs’s medical condition and treatment, links to his own claim that the Gonzalez protocol is “worse than useless.”

[2] Music to read by:

[3] Cute animal photo:

[4] Notable comments this week:

PeterC’s dad, who has diabetes, is doing well on our diet. Daniel’s stepdad had a similar experience.

Helen informs us that sweet potato intolerance may be due to raffinose.

Mario Iwakura gives us his infectious theory of diabetes. I think a lot of the cases of disrupted glucose regulation, where people get frequent hyperglycemic and hypoglycemic episodes, may be due to occult infections.

Dr Jacquie Kidd (who blogs at drjacs.com) has gotten some great advice from Jamie Scott.

Ellen tells us of cases of iodine supplementation controlling diabetes.

Ned is looking for grass-fed cowbells.

[5] Do Vitamins Kill?: An analysis of the Iowa Women’s Health Study came out this week, and it purported to show that nearly all supplements except calcium and vitamin D increased mortality, with iron being the worst. Oskar asked us to look into it, so we did.

The study followed a large number of women in Iowa, and queried them several times about supplement use. In 1986, the baseline, the women had an average age of 62 (range of 55 to 69) and 66% were taking supplements. By 2004, the surviving women had an average age of 82 and 85% were taking supplements.

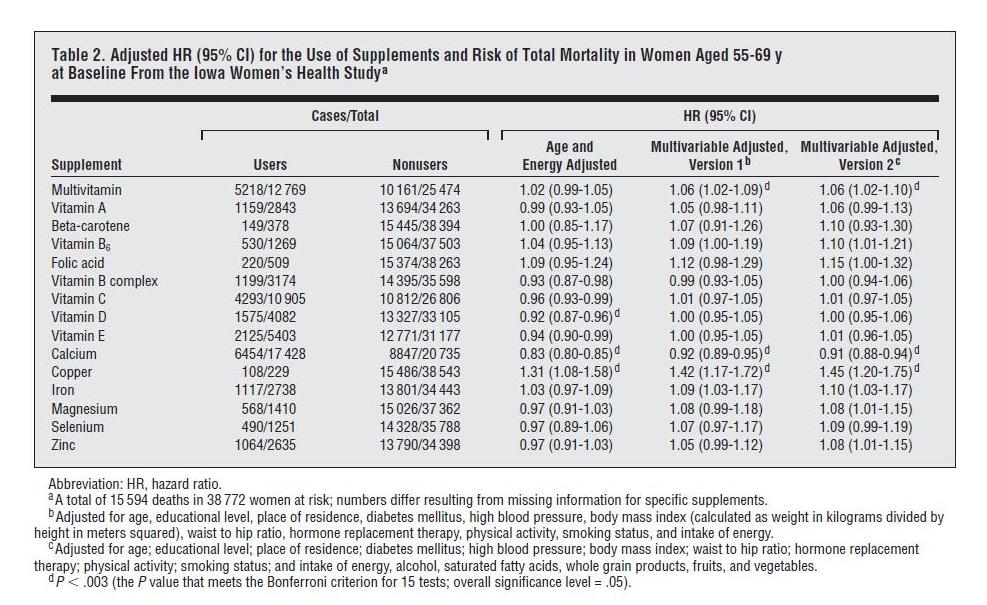
Here is the data on overall mortality vs supplement use:

“Cases” are instances of someone dying. “HR” or hazard ratio is the likelihood of dying if you supplement divided by the likelihood of dying if you don’t. Note that all the hazard ratio estimates are “adjusted.”

Unadjusted Hazard Ratios

The left columns of the table give us death statistics and allow us to calculate raw hazard ratios, with no adjustment whatsoever. Seven of the supplements have unadjusted HRs below 1.00, eight have unadjusted HRs above 1.00. The 15 HRs average to 1.01. Without copper, which has an unadjusted HR of 1.17, they average to 0.998. In short, death rates among supplementers were almost identical to death rates among non-supplementers.

This is interesting because supplement usage rose rapidly with age. It was 66% at age 62 and 85% at age 82. Supplement users were, on average, older than non-supplement users. But mortality rises rapidly with age. So there should have been a lot more deaths among the supplement users, just because of their more advanced age.

The paper should have, but didn’t, report age-adjusted hazard ratios. Adjusting for age is very important, since mortality depends strongly on age, and so does supplement use. However, it’s obvious what the result of age-only adjustment would have been. Supplement usage would have shown a substantial reduction in the risk of dying.

Hazard Ratios Adjusted for Age and Energy Intake

The least-adjusted hazard ratios reported in the paper are adjusted for age and energy intake.

The energy intake adjustment is disappointing, because energy intake is affected by health: healthier people are more active and eat more, and obese people also eat more. Including indices of health as independent variables in a regression analysis will tend to mask the impact of the supplements on health, creating misleading results.

However, let’s go with what we have. Based on “Age and Energy Adjusted” hazard ratios, supplements generally decrease mortality. Nine of the fifteen supplements decreased mortality, five increased mortality. At the 95% confidence interval, five supplements decreased mortality, only one increased mortality.

Looking at the specific supplements, results are mostly consistent with our book analysis. Let’s start with the five that showed harm:

  • Folic acid and iron – two nutrients we regard as dangerous and recommend not supplementing – both elevate mortality, as we would expect. Iron is particularly harmful, and should generally be avoided by women once they have stopped menstruating.
  • Multivitamins slightly increase mortality, a result that has been found before and that we acknowledge in the book. This is probably due to (a) an excess of folic acid, (b) an excess of iron (if the women are taking iron-containing multis after menopause), (c) an excess of vitamin A (this is no longer the case – multi manufacturers have reduced the A content of vitamins in response to data – but in 1986-2004 most multis contained substantial amounts of A) which is harmful in women with vitamin D and/or K2 deficiencies (both extremely common, and D deficiency in this cohort is supported by the benefits of D and calcium in the study and the northerly latitude of Iowa) or (d) imbalances in other nutrients; for reasons of bulk multis tend to lack certain minerals, notably magnesium and calcium.
  • Vitamin B6 is an anomaly, as we wouldn’t expect B6 to be harmful in moderation. I’m guessing B6 would have been taken to reduce high homocysteine and for this purpose would often have been taken along with folic acid, a harmful supplement. Also, B6 should be balanced by vitamin B12 and biotin, and may not have been. Perhaps people with cancer were unaware that B6 promotes tumor growth; (UPDATE: See comments; I was misremembering studies, B12 and folic acid can promote tumor growth, but in other studies B6 looks protective against cancer) indeed, in the breakdown by cause of death in Table 3, B6 increases cancer mortality by 6%, but CVD mortality by only 1%. (Folic acid and vitamin A were other cancer-promoting supplements.) The harm from B6 was not statistically significant and I wouldn’t read much into it.
  • Copper is another anomalous result, but this was the least popular supplement, taken by only 229 women or 0.59%. Copper’s hazard ratios were dramatically affected by adjustment: in the raw data, mortality is only 17% higher among copper supplementers, but after age and energy adjustment it is 31% higher, and multivariable adjustment increases it substantially again. Clearly the effect of copper is highly sensitive to adjustment factors, indicating that copper was being taken by an unusual population. I think the hazard ratio for copper is impossible to interpret without knowing why these women were supplementing copper. If we knew their situation, there would probably be an appropriate adjustment that would make a huge difference in mortality. I would say the numbers are too small, the population too skewed, and the information too limited to draw any conclusion here.

Overall, I would interpret the nine that showed benefits as being highly supportive of micronutrient supplementation. The fact that vitamin A, vitamin B complex, vitamin C, vitamin D, vitamin E, calcium, magnesium, selenium, and zinc all reduced mortality suggests that a well-formulated multivitamin would likely have reduced mortality.

Hazard Ratios After Multivariable Adjustment

Now, what about the “Multivariable Adjusted” results, which were responsible for the headlines?

We have to keep in mind a famous aphorism from the mathematician John von Neumann:

With four parameters I can fit an elephant, and with five I can make him wiggle his trunk.

The multivariable adjustments use 11 parameters and 16 parameters respectively. Using so many parameters lets the investigators generate whatever results they want.

I don’t think it’s a coincidence that both multivariable adjustments substantially increased the hazard ratio of every single one of the 15 supplements. The 11-variable adjustment increased hazard ratios by an average of 7%, the 16-variable adjustment by an average of 8.2%.

Rest assured, it would have been easy enough to find multivariable adjustments that would have decreased hazard ratios for every single one of the 15 supplements.

I believe it verges on the unethical that the variables chosen include dangerous health conditions: diabetes, high blood pressure, and obesity. These three health conditions just happen to be conditions that are often improved by supplementation.

Anyone familiar with how regression analyses work will immediately recognize the problem. The adjustment variables serve as competing explanations for changes in mortality. If supplementation decreases diabetes, high blood pressure, and obesity, and through these changes decreases mortality, the supplements will not get credit for the mortality reduction; rather the decreased diabetes, blood pressure, and obesity will get the credit.

Imagine we had a magic pill that completely eliminated diabetes, obesity, and high blood pressure, and reduced mortality by 20%, with no negative health effects under any circumstances. But if regression analysis showed that non-diabetic, non-obese, and non-hypertensive people had 25% less mortality, then a multivariable adjusted analysis would show that the magic pill increased mortality. Why? Because the elimination of diabetes, obesity, and hypertension should have decreased mortality by 25% (the regression analysis predicts), but mortality was only decreased 20%, so adjusted for diabetes, obesity, and hypertension the magic pill must be credited with the additional 5% dead. The multivariable adjusted HR for the magic pill becomes 0.8/0.75 = 1.067.

Of course, what ordinary people want to know is: Will this magic pill improve my health? The answer to that would be yes.

What (too many) scientists want to know is: Which methodology for analyzing this magic pill data will get me grant money? That depends on whether the funding authorities are positively or negatively disposed toward the magic pill industry. Once you know that, you search for the 16-variable multivariable regression that generates the hazard ratios the authorities would like to see.

My take? Judging by the data in Table 2 plus corroborating evidence from clinical trials reviewed in our book, I would say that a well-formulated supplement program, begun at age 62, may increase the odds of survival to age 82 by something on the order of 5% to 10%. Perhaps not a magic pill; but worthwhile.

[6] Not the weekly video: An exceptional magic show:

[7] Shou-Ching’s Photo Art:

[8] Weekly video: A new tool for stroke recovery:

Mario Replies: Low Carb Diets and the Thyroid, II

We’ve been looking at papers put forth by Anthony Colpo in support of his idea that low-carb diets can cause “euthyroid sick syndrome” (see his original post on July 1 and a post expanding his case on August 20).  I gave my general perspective on this issue last week: Carbohydrates and the Thyroid, Aug 24, 2011. Briefly, an extreme low-carb diet can create a glucose deficiency, especially if endurance exercise or infection increases glucose requirements, and glucose deficiency invokes the body’s glucose conservation measures, which primarily consist of lower T3 and higher rT3 hormone levels – two hormonal markers of euthyroid sick syndrome. I also offered my view, unchanged from our book, on what level of dietary carbohydrate intake is needed to avoid a glucose deficiency.

Now it’s time to look more closely at the evidence to see if my perspective is consistent with the literature. Our thyroid expert, Mario Renato Iwakura, has been looking into Anthony’s papers to see if they report any negative effects from Perfect Health Diet-level carb intakes. In his first post (Low Carb High Fat Diets and the Thyroid, Aug 18, 2011), he showed that studies cited in Anthony’s July 1 post were generally very high omega-6 diets and therefore did not refute our diet, which prescribes low omega-6 intake. Anthony’s August 20 rebuttal cited a few more experiments which were not high in omega-6, and today Mario is going to look specifically at the issue of carbs. How much carbohydrate intake is needed to avert a glucose deficiency as indicated by decreased T3 and increased rT3?

Mario had assistance from JS Stanton of gnolls.org who reviewed the post pre-publication and contributed some helpful suggestions. Without further ado, here’s Mario! – Paul

After my post on low carb diets and thyroid function, Anthony Colpo wrote a reply that I will address with this post.

First, let me say that neither I nor Paul ever said that:

  1. A high carbohydrate diet has detrimental effects on the thyroid;
  2. Low-carb diets have any “metabolic advantage”; or
  3. A very low carbohydrate diet is healthy or good for the thyroid.

Second, Anthony has been making a case that low-carb diets can produce a condition called “euthyroid sick syndrome,” characterized by low T3 and high rT3. Anthony seems to have supposed that my post was intended to reply or refute his July 1 post. It was not; my post was intended as a treatment of thyroid health generally, and was designed to answer the question of whether the studies Anthony had cited in any way refuted the Perfect Health Diet prescription for thyroid patients.

In the developed world, most cases of hypothyroidism – up to 90% – are diagnosed as Hashimoto’s autoimmune thyroiditis. Hashimoto’s is a complex disease, whose causes are too complex to explore in this post, but in my opinion it is generally caused by exogenous toxins (gluten, mercury, bisphenol-A, bromide, etc) that disrupt gut flora and cause gut permeability and disturbed immunity that allows infections to enter the body and take root in thyroid tissue, after which in susceptible persons an autoimmune attack on the thyroid can develop.

Which infections are associated with Hashimoto’s is still an object of study, but we do know that many of the likely pathogens benefit from high gut, serum, or cellular glucose levels  and therefore we can suspect that a high carbohydrate diet might promote the disease and a low, but not too low, carbohydrate diet, such as PHD, might be therapeutic.

So even if some thyroid-related problems, like euthyroid sick syndrome, may become more likely on a low-carb diet, others, like Hashimoto’s, may be relieved by a low-carb diet. It is therefore necessary to look closely at each condition and at the literature to see which diet optimizes thyroid health – and whether specific thyroid disorders demand different diets.

In looking at the papers cited by Anthony, I’ll borrow his section headings so that readers have an easier time finding the part of his post that I am responding to.

“Here Comes the Boom!”

Anthony, in an attempt to refute my assertation that PUFA may cause thyroid impairment on LCHF diets, cites two papers.

The first was Danforth E Jr et al. [1] This paper reported a number of experiments with multiple low-carb diet variations. In all studies, provided fat was rich in omega-6 fats:

The excess fat in these diets averaged 895 kcal/d consisting of margarine, corn oil, a corn oil colloidal suspension, and fat-enriched soups and cookies. The ratio of saturated to unsaturated fatty acids in these diets was 1:2.5. [1]

However, there was a single experiment which was low in both fat and carb. Anthony wrote:

However, as you scan through the above paper, you will notice that one of the groups followed a zero-carb diet consisting of nothing but lean meat, fish, fowl, and vitamin and mineral supplements. In other words, they ate next to no PUFA.

This particular diet was actually a “protein-supplemented modified fast” consisting of:

a 6-wk period during which the subjects received a protein-supplemented modified fast including 1.2 g/kg ideal weight per d of lean meat, fish, or fowl. This was supplemented by 25 meq/d of potassium bicarbonate and citrate and 200 mg of calcium as carbonate, plus vitamins and iron. [1]

So an 80-kg man would have gotten 100 g lean meat. 100 g chicken breast supplies 165 calories total, 32 calories from fat and 133 from protein. So this “zero-carb diet” provided at most a few hundred calories per day. Anthony’s conclusion:

During this very low PUFA diet, T3 concentrations fell steadily and at six weeks were equivalent to those found after 7 days of fasting (88 ng/dl)!

Here’s the data from the study:

The initial concentration of T3 in these subjects was 155 ng/dl, fell to 87 ng/dl during the 7-d fast, and then rose to 146 ng/dl with refeeding. Initial rT3 concentrations were 25 ng/dl, rose with fasting to 57 ng/dl, and then fell again to 24 ng/dl with refeeding. Slower but similar changes in the concentrations of T3 and rT3 to those of fasting occurred with administration of a protein-supplemented modified fast for 1 wk. During the first week of the diet, T3 concentrations fell from 166 to 109 ng/l and rT3 concentrations rose from 31 to 53 ng/dl. [1]

In short: On a 7-day modified fast providing 130 protein calories per day, the fall in T3 levels is significantly less than on a 7-day true fast.

As the modified fast was continued, T3 concentrations continued to fall and at 6 wk were equivalent to those found after 1 wk of fasting (88 ng/dl). rT3 concentrations, however, returned to their initial values as the fast was continued (39 ng/dl). [1]

So even after 6 weeks, the rT3:T3 ratio was lower on the modified fast (39/88) than after 1 week on the true fast (57/87).

This all looks consistent with Perfect Health Diet arguments that we need at least 200 starch calories and at least 600 carb+protein calories to prevent a glucose deficiency; with Paul’s argument that high rT3 and low T3 is the body’s response to a glucose deficiency; and with the idea that mitigating the glucose deficiency by carb or protein intake will lower the rT3:T3 ratio. It does not speak at all to Perfect Health Diet-style low carb (400 calories from starches, adequate protein) being unhealthy.

Anthony next discusses Bisschop PH et al. [2] He even e-mailed Bisschop to be sure the diet was low in PUFA. But what diet caused a significant decrease in T3 levels? A diet supplying only 2% carbohydrate out of 2483 total calories, or 49.66 calories = 12.41g of carbohydrate. Again, Perfect Health Diet recommends 400 calories (100g) carbohydrate, and argues that, because the amount of glucose that can be manufactured from protein is hormonally limited, even if dietary protein is sufficient at least 200 readily digestible glucose calories should be eaten to avert the risk of a glucose deficiency.

Anthony quoted the following passage from Bisschop PE et al:

Apparently, isocaloric carbohydrate deprivation induces a catabolic state with respect to protein metabolism compared with diets with a normal composition and compared with starvation. This catabolic reaction to carbohydrate deprivation is associated with decreased insulin secretion. Apparently, exogenous carbohydrates and/or insulin induced by exogenous carbohydrates are required for a proper utilization of dietary proteins. [2]

Anthony goes further and says that low carb diets “suck the big one for building muscle”:

So what does explain the reduction in T3 seen on the low-carb diet? Well, remember how I said that Dr. Bisschop and his team also measured urinary nitrogen excretion in the male subjects? Urinary nitrogen excretion is a long-standing and widely employed marker for protein (as in, lean tissue) breakdown. Low-carb diets have repeatedly been shown to increase nitrogen excretion, which is one reason why they suck the big one for building muscle.

The carbohydrate deprivation diet comprised 2% of carbs and 15% of protein. On a 2483 calorie diet, this is only 420 carb+protein calories – insufficient to meet the minimum Paul estimated of 600-800 calories per day to avoid a glucose deficiency. The body simply isn’t being given enough amino acids to meet the body’s glucose requirements. Muscle breakdown necessarily follows.

But, let’s see what happens when you provide more carb+protein. The Volek study [3] provided 8% carbs (184 calories) and 30% protein (704 calories) – still low-carb, but now enough carb and protein to avert a glucose deficiency. Here is Table 2 from Volek et al [3]:

The subjects in the Volek study were asked to maintain their current level of physical activity and to consume adequate dietary energy to maintain body mass. And yet fat mass was significantly (P < .05) decreased (-3.4 kg) and lean body mass significantly increased (+1.1 kg) at week 6.

Lesson: if you don’t want to lose muscle on a VLCD, eat extra protein and at least a bit of carbs!

“Why The Volek Study Proves Absolutely Nothing …”

Anthony wrote:

The study headed by Jeff Volek  is the only one allegedly showing no change in thyroid hormone levels on a low-carb diet, so of course it is eagerly cited by Mario as proof that I’m wrong. Just one wee problem: Volek et al didn’t even measure levels of T3, the critical thyroid hormone in question! Instead, as I explained in my article, the pro-low-carb and Atkins-sponsored Volek team chose to only measure T3 uptake, a test also known as “resin-binding T3 uptake”.

This, of course, is just fine by Mario, who happily extrapolates the results of unrelated studies examining the relationship between thyroid hormones and a bunch of other hormones; studies, I should point out, that did not involve low-carb diets.

The Volek study [3] was cited because it was unique: the only low-carb study that didn’t use a high PUFA diet. As for the failure to measure T3, I agree this was a flaw. However, you cannot reasonably argue that T3 may have decreased with no detectable effect on the human body. You absolutely cannot say that T3 can decrease with no effect on testosterone, IGF-1, glucagon, sex hormone-binding globulin (SHBG), fat mass, or lean body mass. Maybe in an alien body or in another parallel universe … but not in humans.

Anthony next cites Otten MH et al [4]. Study subjects were taken through a succession of diets, eating each diet for only 72h. The two diets that caused the greatest changes in T3 and rT3 were the first two: a diet of 100% fat and another of 50% fat and 50% protein.

Paul has argued that gluconeogenesis is hormonally limited and can generate at most 400 glucose calories per day; this is why zero-carb diets are dangerous. So it is no surprise that these zero-carb diets produce the elevated rT3 – depressed T3 pattern that is the body’s response to a glucose deficiency. Again, this does not argue against Perfect Health Diet-style low carb.

What is interesting about Otten et al is that the diet of 50% carbohydrate and 50% fat showed a decrease of 24% in T3 and an increase of 34% in rT3. It looks like even high-carb diets can induce high rT3 and low T3 if the diet is unbalanced and deficient in protein.

Perhaps the problem is not so much low-carb, but malnourishment in general! High rT3 and low T3 reduce metabolism and may help conserve protein during malnourishment, regardless of whether the threat to protein stores comes from dietary restriction of carbs or protein.

“Fifty Grams I Tell Ya, FIFTY GRAMS!!”

Anthony proceeds to comment on a study, Spaulding SW et al. [5], which was cited by Stabby in the comments. In this study, only fifty grams of carbohydrate on a high fat diet was enough to restore T3 levels to normal:

As anticipated, total fasting resulted in a 53% reduction in serum T3 in association with reciprocal 58% increase in rT3. Subjects receiving the no-carbohydrate hypocaloric diets for two weeks demonstrated a similar 47% decline in serum T3 but there was no significant change in rT3 with time. In contrast, the same subjects receiving isocaloric diets containing at least 50 g of carbohydrate showed no significant changes in either T3 or rT3 concentration. [5]

Anthony’s comment is this:

Mario and Stabby jump on this finding as if it is proof that only fifty grams of carbohydrate is needed to maintain optimal carbohydrate levels. In doing so, they totally ignore the fact that this result was hardly a universal finding. They totally ignore all the other studies showing T3 reductions at higher carbohydrate intakes.

Based on Paul’s view of things, it would be no surprise that this was not a universal finding. Paul estimates that 200 calories of dietary carbs, plus 400 calories from gluconeogenesis, is barely sufficient to prevent a glucose deficiency in a sedentary healthy person. Any perturbation – exercise, infection, protein restriction limiting the availability of substrates for gluconeogenesis – might induce a glucose deficiency.

But it is significant that when circumstances are right, 200 calories per day of carbs can eliminate the T3 drop and rT3 rise that is associated with glucose deficiency. So Spaulding et al is a positive contribution to the debate, and once again it tends to confirm Perfect Health Diet’s analysis.

Anthony cited several other studies in which 200 carb calories was insufficient to prevent a rise in T3. First, Mathieson et al [6]:

Ruth Mathieson and her colleagues from Virginia Polytech and State University placed fourteen obese free-living women on 530-calorie/day diets containing either 44 grams or 94 grams daily of carbohydrate. Both diets caused significant reductions in T3, with the ketogenic diet causing the largest decline.

Recall that Paul believes that 200 carb calories and 600 calories of carb+protein are the bare minimum needed to prevent a glucose deficiency, even when all circumstances are favorable. These diets only had 530 calories total. As carb+protein intake was insufficient to maintain glucose status, it is no surprise that the diets induced a fall in T3.

The other study cited by Anthony was Serog et al [7]. Anthony writes:

Serog et al examined four isocaloric (mean intake 2800 calories/day) diets lasting 1 week each. In two of these, a standard diet containing 45 percent carbohydrate was consumed. The remaining two diets were either low- or high-carbohydrate, and were consumed by all the subjects in random order between the two standard diet phases.

Average carbohydrate intake in grams was 250 grams on the standard diet, 71 grams on the low-carbohydrate diet, and 533 grams on the high-carbohydrate diet. On the standard and high-carbohydrate diets, T3 levels did not change, ranging from 163.3 to 169.5 ng. They declined on the low-carb diet to a mean 148.6 ng. Mirroring these changes, rT3 rose significantly only on the low-carb diet.

What was the fat used? You bet! Soy oil! From Table 1, composition of the Normal Protein Hypocaloric Diet (NHD): protein was provided as casein (14g), skimmed milk (34g), and soy (22g); fats were from soy (16g, 9g linoleic acid); carbohydrates were primarily dairy sugars.

Finally, Anthony cited a study by Davidson and Chopra [8] which found that T3 levels increased as carbohydrate intake increased from 20% toward 80% of energy. Paul himself discussed this study in last week’s post, in response to a cite by Danny Roddy. Paul’s observation was that high T3 levels are harmful to health, and that T3 may be elevated on the 80% carb diet in order to dispose of excess glucose (T3 stimulates glycolysis), so this could indicate a mechanism by which high-carb diets are health impairing. It does not prove that 80% carb diets are healthier than 20% carb diets.

Conclusion

Yes, it is possible to develop a glucose deficiency on low-carb diets. If this occurs, the body will conserve glucose by reducing T3 and increasing rT3.

However, there is as yet no evidence that T3 and rT3 will exit normal ranges when following Perfect Health Diet guidelines.

Until a well-designed study provides contrary evidence, I stand by my assertion that a diet with sufficient but not excess protein, moderate carbohydrate comprising a minority of calories, and high intake of saturated and monounsaturated fat but low intake of polyunsaturated fat is optimal for thyroid function. But this is the Perfect Health Diet!

References

[1] Danforth E Jr et al. Dietary-induced alterations in thyroid hormone metabolism during overnutrition. J Clin Invest. 1979 Nov;64(5):1336-47. http://pmid.us/500814

[2] Bisschop PH, et al. Isocaloric carbohydrate deprivation induces protein catabolism despite a low T3-syndrome in healthy men. Clin Endocrinol (Oxf). 2001 Jan;54(1):75-80. http://pmid.us/11167929

[3] Volek JS et al. Body composition and hormonal responses to a carbohydrate-restricted diet. Metabolism. 2002 Jul;51(7):864-70. http://pmid.us/12077732

[4] Otten MH et al. The role of dietary fat in peripheral thyroid hormone metabolism. Metabolism. 1980 Oct;29(10):930-5. http://pmid.us/7421583

[5] Spaulding SW et al. Effect of caloric restriction and dietary composition of serum T3 and reverse T3 in man. J Clin Endocrinol Metab. 1976 Jan;42(1):197-200. http://pmid.us/1249190

[6] Mathieson RA, et al. The effect of varying carbohydrate content of a very-low-caloric diet on resting metabolic rate and thyroid hormones. Metabolism, May, 1986; 35 (5): 394-8. http://pmid.us/3702673

[7] Serog P, et al. Effects of slimming and composition of diets on V02 and thyroid hormones in healthy subjects. Am J Clin Nutr. 1982 Jan;35(1):24-35.http://pmid.us/7064875

[8] Davidson MB, Chopra IJ. Effect of carbohydrate and noncarbohydrate sources of calories on plasma 3,5,3?-triiodothyronine concentrations in man. J Clin Endocrinol Metab. 1979 Apr;48(4):577-81. http://pmid.us/429502.

Carbohydrates and the Thyroid

Mario’s post last Thursday (Low Carb High Fat Diets and the Thyroid, Aug 18, 2011), looking at a series of studies cited in a July 1 post by Anthony Colpo, elicited a reply from Anthony.

The exchange turned out to be a blessing, because it is generating some insights on topics of fundamental importance.

Low-Carb Dangers

A motivating factor for our book was Paul’s bad experience with very low carb dieting. We felt obliged to warn the Paleo community that it was possible to become deficient in glucose and that this could be dangerous. We’ve blogged about “Zero Carb Dangers” (see especially Dangers of Zero-Carb Diets, II: Mucus Deficiency and Gastrointestinal Cancers; Danger of Zero-Carb Diets III: Scurvy; Dangers of Zero-Carb Diets, IV: Kidney Stones). Our work has persuaded many in the Paleo and low-carb communities to eat more “safe starches” including white rice. We recommend a carb intake that approaches the body’s total glucose utilization.

We do recommend ketogenic diets and low-carb diets as therapies for many neurological disorders and some infections, but believe that even ketogenic diets should generally include at least 200 glucose calories per day.

So when we consider claims that low-carb diets can be dangerous, it’s not without sympathy.

At the same time, given the therapeutic potential of low-carb and ketogenic dieting, and the likelihood that humans are evolutionarily adapted to a range of macronutrient intakes, we don’t think it’s appropriate to repudiate low-carb entirely.

This places an onus on us to closely examine the evidence, understand precisely when a low-carb diet passes from healthy to unhealthy, and make clear recommendations for how much dietary glucose is needed in different circumstances to avoid negative consequences.

The Issue of Low-Carb and the Thyroid

One problem that sometimes occurs on low-carb diets is a syndrome called “euthyroid sick syndrome,” characterized by low T3 and high reverse T3 hormone levels and elevated cortisol.

Here’s our friend and gracious podcast host, Danny Roddy:

[A low-carb] diet will lead to an elevation of catabolic stress hormones, while [a high-carb diet] has been shown to increase thyroid hormone triiodothyronine (T3), increase testosterone, and decrease cortisol, the anti-hair, pro-misery stress hormone (here, here, here (PDF), & here).

And here’s Anthony Colpo in his July 1 post:

[D]ecreasing carbohydrate intake to low levels results in diminished levels of T3 and/or increased rT3, something most aspiring fat-burners wish to avoid desperately.

Few things are more essential to good health than proper thyroid function. So this is clearly an issue we have to investigate and understand. It could impact our prescription for the minimum level of carb intake needed for good health.

Why Mario’s Post Emphasized Omega-6 Fats

Anthony seemed to think that Mario’s emphasis on the dangers of high-omega-6 diets was intended as a denial that low-carb specifically could be the cause of thyroid trouble. No.

The studies in question compared low-carb high-fat diets with other diets. In some but not all studies, thyroid function was impaired on the low-carb high-fat diet.

In looking at the studies cited by Anthony plus a few others, Mario found that thyroid function was impaired on all of the low-carb high-omega-6 diets but none of the (admittedly few) low-carb high-saturated-fat diets.

This led him to emphasize the role of the fatty acid type, rather than the amount of carbohydrates. It is also supportive of Perfect Health Diet claims that high omega-6 is toxic whereas high saturated fat is not.

Mario did not have space to treat the dangers of glucose deficiency for the thyroid, especially since the studies he was examining did not provide compelling evidence about the effects of dietary carbohydrate restriction (once the possibility of PUFA toxicity was accounted for). So he didn’t venture into this question, other than to assert the importance of “moderate” carb consumption.

But now we will – in the remainder of this post, and two upcoming guest posts.

Let’s explore the circumstances under which we might expect low-carb diets to cause “euthyroid sick syndrome.”

The Limits to Glucose Production

Let me begin by revisiting the initial post in our Zero-Carb Dangers series (Dangers of Zero-Carb Diets, I: Can There Be a Carbohydrate Deficiency?, Nov 10, 2010). I’ve been meaning to correct that post for some time, and this seems a good occasion.

That post emphasized size of the liver as a limit on its ability to synthesize glucose from protein. There is, indeed, a physical limit to the liver’s ability to manufacture glucose from protein. As long as unlimited fat is available for energy production and unlimited protein is available as a gluconeogenic substrate, the limit is determined by the oxygen supply to the liver and is about 400 g / 1600 calories per day.

However, this theoretical limit is never reached in healthy humans, except in some diabetics (as Nigel Kinbrum pointed out). The liver’s conversion of protein to glucose is controlled hormonally; insulin and glucagon are the most important players, with insulin inhibiting gluconeogenesis and glucagon promoting it.

Diabetics can have very high rates of gluconeogenesis because their pancreatic beta cells may no longer produce insulin even as their pancreatic alpha cells continue to produce glucagon.

In normal healthy humans, basal hormone levels are balanced so that during fasting or starvation, the liver and kidneys manufacture minimal but sufficient glucose while sparing protein as much as possible.

In a normal person, the liver and kidneys together never produce more than about 100 g / 400 calories glucose per day from protein. In the absence of hormonal dysregulation, this is a fairly hard limit.

Glucose Utilization and Glucose Deficiency

We discussed this in the book, and I won’t repeat the evidence. Suffice it to say that everyone consumes at least 600 glucose calories per day, a majority by the brain but also extensive amounts for structural components of the body – glycosylated proteins which coat every cell, and glycoproteins which are major components of mucus, joint lubricants, and connective tissue – and for immune function (since glucose is needed to produce the reactive oxygen species that kill pathogens).

Because limited research has been done on this subject, it’s possible that we’ve underestimated the body’s glucose needs. It could be as high as 800 glucose calories per day. It’s not likely to be lower.

This is for sedentary healthy people. Two factors may substantially increase glucose utilization:

  • Infection. Many pathogens consume glucose – indeed, people with parasitic infections can sometimes have great difficulty obtaining enough glucose from food – and the immune system also consumes glucose.
  • Athletic activity. Exercise can consume large amounts of glucose.

Let’s look at athletic activity. The Mayo Clinic lists the amount of calories burned per hour of exercise of various kinds, and the most intense types of exercise, such as running or cycling at race speeds (>20 mph), may burn 1,200 calories per hour. Most of these calories come from fat, but 30-40% may come from glycogen, and glucose is consumed to replace the glycogen. Thus, a runner or cyclist may burn up to 400 glucose calories per hour of training.

In a cyclist, runner, or swimmer who trains 2 hours per day, therefore, glucose needs may be quite a bit higher than in our sedentary healthy person. Such an athlete may be consuming ~1500 glucose calories per day.

Yet at most 400 calories of glucose per day can be manufactured from protein. It’s clear that athletes need to eat a fair amount of carbohydrate to avoid a glucose deficiency.

Anthony Colpo is a cyclist and athlete who routinely engages in intense endurance exercise. His unusually high glucose utilization is presumably what made him vulnerable to glucose deficiency syndromes – and therefore more sensitive than others to the dangers of low-carb diets.

The Basis for Our Carbohydrate Consumption Recommendations

Let’s go back to our sedentary healthy person, and let’s consider the minimum dietary glucose that person needs to avoid difficulty.

First let’s consider a person who eats a large amount of protein – 600 calories per day, about double the intake of an average American.

Roughly 200 calories per day may be needed for structural uses, leaving 400 calories per day for possible conversion to glucose.

But if protein consumption is lower, there may not be enough substrate to create 400 glucose calories per day. This may lead to hormonal changes that try to conserve protein by limiting gluconeogenesis.

Now let’s look on the glucose side. If 600-800 glucose calories are utilized by the body daily, and at most 400 of those can be manufactured from protein and at most ~300 can be displaced by ketones, then someone on a zero-carb diet is living right on the margin of glucose deficiency.

And this is before athletic activity or infections are considered.

If 200 glucose calories per day are consumed, and if 400 protein calories are consumed, and if MCT oil (a ketogenic substrate) is consumed to make it easier to generate ketones to displace glucose, then one might just barely meet the body’s structural glucose and protein needs on a ketogenic diet. This is why we recommend that ketogenic diets include at least 200 calories from starch.

But it’s not really desirable to live on the margin of glucose deficiency, especially if you’re not making it easy for your body to generate ketones. For this reason, our normal diet recommends 400 calories or more from starches.

The Trouble with Vegetables

We generally advise not counting vegetables as carb calorie sources. This often puzzles diabetics who note that vegetables have some sugar – typically, about 80 calories per pound – and that consuming vegetables raises their blood sugar levels.

The reason we recommend not counting vegetable calories is that digestion of vegetable matter is an energy-intensive process that consumes glucose. Gut cells consume glucose directly, and also vegetables have a lot of fiber which causes gut bacterial activity which in turn leads to immune activity which consumes glucose. This glucose consumption by the gut and immune system occurs over an extended period of time after vegetables are eaten – perhaps 6 hours. But vegetable sugars are digested quickly – mainly in the first hour. So you can have a surge of blood sugar due to vegetable sugars, even if the vegetables make no net contribution to daily glucose balance.

So it’s really starches and fruits that are the useful sources for meeting the body’s carb needs.

What Happens When There is a Glucose Deficiency?

When the body is deficient in glucose, the hormonal milieu changes to help maintain body functions while conserving glucose and protein.

Two of the important hormones are cortisol and T3.

T3, the most active thyroid hormone, has a strong effect on glucose utilization. T3 stimulates glucose transport into cells, and transport is the limiting factor in glucose utilization in many cell types. In hyperthyroidism, a condition of too much T3, there are very high levels of glucose utilization. Administration of T3 causes elevated rates of glycolysis regardless of insulin levels.

The body can reduce T3 levels by converting T4 into an inactive form called reverse T3 (rT3) rather than active T3. High rT3 levels with low T3 levels lead to reduced glucose transport into cells and reduced glucose utilization throughout the body.

Cortisol is a hormone that helps prevent hypoglycemia, a condition of low blood glucose. It reduces glucose utilization and increases gluconeogenesis.

So the syndrome of low T3, high rT3, and high cortisol can be understood as a diagnostic pattern of a systemic glucose deficiency.

What Is “Euthyroid Sick Syndrome”?

Euthyroid sick syndrome is defined as “a state … where the levels of T3 and/or T4 are at unusual levels, but the thyroid gland does not appear to be dysfunctional.” Specifically, “Reverse T3 are generally increased signifying inhibition of normal Type 1 enzyme or reduced clearance of reverse T3. Generally the levels of Free T3 will be lowered.”

Wikipedia’s list of causes includes:

  • Fasting, starvation (PAJ: These induce glucose deficiencies, especially if there is insufficient protein available to sustain even the normal 400 calories/day glucose synthesis.)
  • Sepsis (PAJ: Infection increases glucose requirements.)
  • Trauma (PAJ: Fabrication of structural glycoproteins and protein glycosylation is increased during wound repair.)
  • Malignancy (PAJ:  Cancers consume large amounts of glucose.)
  • Hypothermia (PAJ:  Shivering, like endurance exercise, consumes glycogen.)
  • Cirrhosis (PAJ: Damage to the liver may reduce its ability to synthesize glucose, forcing glucose conservation.)
  • Chronic renal failure (PAJ: The kidney is the other organ besides the liver that synthesizes glucose from protein. So kidney damage will reduce the body’s ability to synthesize glucose.)

Looking at this list, it seems that euthyroid sick syndrome may be just another name for a systemic glucose deficiency.

If glucose deficiency is the cause, then obviously low carb diets are going to be a risk factor for euthyroid sick syndrome.

This is not to say that low carb diets will automatically lead to euthyroid sick syndrome. A sedentary person free of infections may be quite normal and healthy on a very low carb diet. This is why most low carbers do not experience the condition.

But if other risk factors, like infection, cancer, or endurance exercise, are present, then the odds of developing euthyroid sick syndrome on a low carb diet may become quite high.

Diagnostic Value of rT3:T3 Ratio for Low-Carb Dieters

Here’s an interesting implication of today’s analysis.

The ratio of rT3 to T3 may have diagnostic value for glucose status and therefore for the presence of infections or cancers. It might not be a bad idea for low-carb dieters to monitor these hormone levels, and to eat enough “safe starches” to keep their rT3:T3 ratio at normal levels.

The rT3:T3 ratio is likely to be of much greater clinical value to low-carbers than to the average high-carb American. So even though doctors rarely test for it, low-carb dieters may find it quite useful.

Are High-Carb Diets Without Risk?

In the wake of Anthony’s reply I was amused by a Twitter conversation between @DannyRoddy and @StabbyRaccoon – two of the smartest and nicest people on the Web.

As noted above, Danny believes that high-carb diets might be beneficial by creating above-normal T3 levels:

I believe the real question is: what range radically increases T3?…

I’m more concerned where CHO starts dramatically increasing T3.

Stabby paid me the honor of valuing my opinion:

maybe Paul … could look into it.

Alright, let’s look (briefly) into it.

In the quote from Danny on potential risks of low-carb diets, he cited several papers. One of them was this:

To evaluate the effect of changes in dietary carbohydrate (CHO) and excessive caloric consumption on circulating thyroid hormone levels, six normal weight subjects were fed five separate diets: three isocaloric diets with 20%, 40%, or 80% CHO and two hypercaloric (+2000 calories) diets with 20% or 40% CHO for 5 days each as outpatients. T4, T3, and rT3 concentrations were measured in plasma samples collected on the morning of the sixth day. At least 1 week of the subjects’ usual diets intervened between each experimental diet.

Mean T4 and rT3 levels were similar after all diets. Pair-wise comparisons among all five diets revealed significantly (P < 0.005) increased T3 concentrations after both hypercaloric diets compared to the iso-20 and iso-40 diets, and after the iso-80 compared to the iso-20 diet. A multiple regression analysis of the data revealed the highest correlation of T3 levels with total calories (r = 0.68; P < 0.001) rather than with the intake of CHO (r = 0.46; P < 0.025), fat (r = 0.49; P < 0.02), or protein (r = 0.30; P = NS).

I haven’t read the full study yet and find this abstract mildly puzzling. On the one hand, the multiple regression analysis shows that fat, not carbohydrate, is the most effective macronutrient at raising T3. Maybe Danny should eat a high-fat diet to raise his T3.

On the other hand, the normo-caloric 80% carb diet had more T3 than the normo-caloric 20% carb diet. So maybe carbs do increase T3 more than fat.

Now, hypercaloric (positive energy balance) diets are associated with a variety of diseases including obesity and metabolic syndrome. Stephan Guyenet has argued that positive energy balance is itself inflammatory and damaging, and that high-reward foods which induce overeating may directly cause metabolic diseases.

In this study, T3 concentrations were increased similarly on both hypercaloric (2000 excess calories) 20% and 40% carb diets and normo-caloric 80% carb diets. Could it be that some of the ill effects of hypercaloric diets will also be present on normo-caloric high-carb diets?

Of course, with any hormone we have to ask what the right amount is. Usually both too much and too little are problematic. This is certainly true of thyroid hormones.

High T3 concentrations are characteristic of the disease hyperthyroidism and have negative effects. One of the effects of high T3 levels is enhanced transport of glucose into cells. For instance:

Pre-treatment of these cells with T3 moreover substantially enhances the stimulatory effect of insulin such that at maximally effective hormone concentrations the effects of T3 and insulin on glucose transport are more than additive and indeed nearly multiplicative …

The extra glucose transported into cells is disposed of through glycolysis. Glycolysis is the characteristic metabolism of cancer cells, so high T3 might promote the cancer phenotype.

Indeed, hyperthyroidism increases the risk of ovarian cancer by 80%.

Glycolysis also occurs in the cytosol, making glucose and downstream energy substrates like pyruvate and lactate available to bacteria. Thus, high T3 may promote bacterial infections.

Indeed, thyroid storms can cause sepsis.

Those who have been following CarbSane’s exposition of the dangers of lipotoxicity may be interested to find that high T3 not only increases circulating glucose levels and rates of glycolysis, but also circulating free fatty acid levels:

Hyperthyroidism, which was induced by administration of tri-iodothyronine (T3) to rats for 2, 5 or 10 days, increased fasting plasma concentrations of glucose, insulin and free fatty acids. Administration of T3 for 2 or 5 days increased the rates of glycolysis at all insulin concentrations studied …

Elevated free fatty acids seem to be the primary cause of diabetes.  Here elevated free fatty acids are associated with high glucose and with a hormonal trait – high T3 – associated with high-carb diets.

(Aside: This kind of evidence is why we have to be a bit cautious in assuming that free fatty acid levels, and thus diabetes risk, are higher on low-carb high-fat diets. Recently CarbSane and I had a brief discussion on this topic: see this post on her blog and the comment thread. She leans toward the idea that more dietary fat = more free fatty acids and thus more lipotoxicity; to me the issue is far from clear, as the need to dispose of glucose will tend to inhibit drawdown of free fatty acids. I think that moderate carb consumption, near the body’s glucose utilization, rather than high carb consumption may minimize lipotoxicity. However, concerns over lipotoxicity might lead us to revisit our suggestion of ketogenic diets for diabetes.)

Getting back to the question Stabby asked me to look into: I have only a provisional response. I have given only the most superficial of looks at the literature. I am mainly tossing out topics for further investigation (hopefully by others!).

But at a glance, I don’t see any obvious reasons to change the judgment of our book that moderate carb consumption, close to the body’s glucose utilization needs, is optimal. In my judgment, “dramatically increasing T3” by eating a high carbohydrate diet (if, indeed, a high-carb diet does this) is probably undesirable. Rather, it’s best to eat a moderate amount of carbohydrate that keeps T3 at physiologically normal, healthy levels. Both too much and too little T3 – and, perhaps, too much and too little dietary carbohydrate – may be dangerous.

Conclusions

In regard to Anthony Colpo, I’d like to extend an olive branch, and reiterate the following points:

  • The purpose of Mario’s post last Thursday was not to show that Anthony was right or wrong, but to find out whether we were right or wrong.
  • Although we are more sympathetic than Anthony to low-carb diets, we agree that they have risks. Yes, it is possible to become glucose deficient.
  • I stand by Mario’s post. I don’t believe there are any errors in it.
  • Nothing Mario said contradicted the main points of Anthony’s July 1 post to which it linked. Mario (and we) endorsed “moderate” carb consumption, not very low carb diets, and Mario’s focus on the dangers of high-omega-6 diets should not be construed as a denial of the dangers of very low-carb diets.

Anthony and I exchanged increasingly cordial emails over the weekend, are sending each other copies of our books, and I hope we will be on good terms even if our diet ideas and study interpretations are not identical.

In regard to rT3:T3 ratio, it might be interesting to compile some data on rT3:T3 ratios and carb intake among low-carbers. It may be that studying how rT3:T3 ratio varies with carb consumption will give us a clearer idea of optimal carbohydrate intake. I would expect there would be some “plateau region” of carb intake over which rT3 is low and T3 levels are stable. At very high carb intakes, T3 might be elevated in order to promote glucose disposal; at very low carb intakes, the euthyroid sick syndrome of elevated rT3 and depressed T3 might hold.

Finally, a look at upcoming posts. Yes, long as this post was, we’re not done exploring these issues.

Anthony cited some more papers in his reply to Mario, and Mario will respond in detail: what do those studies prove? The purpose of this is to evaluate our diet to see if our advice is sound, not to feature any disagreements Mario may have with Anthony, or to prove anyone wrong.

In the post after that, we’ll have a fascinating personal story from Gregory Barton. Gregory’s experience connects euthyroid sick syndrome to the vexing issue of high LDL on Paleo diets, and as such ties in with some points Chris Masterjohn has made on the role of thyroid hormone in LDL pathways. As such it may help us reach some closure on two of the outstanding problems that have troubled the low-carb Paleo community.

And if we’re not tired of the issue after those posts, commenter Valtsu has been sending me references to papers discussing links between infections and euthyroid sick syndrome. It looks like toxins and inflammatory cytokines released during infections can disrupt the ability of the hypothalamus to regulate thyroid hormone levels. This could have implications for other diseases besides euthyroid sick syndrome – including obesity, which often features disruption of the hypothalamus’s regulation of energy utilization.

So I think this little controversy is leading us to some productive discoveries. Therefore, I’d like to thank Anthony for raising the issues in the first place. Out of disagreement may come insight.

Iodine and Hashimoto’s Thyroiditis, Part 2

Mario Renato Iwakura’s guest series on the place of iodine and selenium supplementation in treatment of hypothyroidism continues. This is part 2. Thank you Mario! – Paul

UPDATE November 2023: Since this article was written, PHD recommendations for iodine have become firm. We recommend consistent daily supplementation in the range of 150 to 225 micrograms (not milligrams) per day, plus frequent seafood consumption. The supplementation (a) ensures a healthful supply of iodine and (b) accustoms the thyroid to the presence of iodine which minimizes the risk of thyroid injury from intake of a large amount of iodine at once, possibly at a time of selenium deficiency, for example from an all-you-can-eat crab buffet. Supplementation of >1 mg high doses of iodine carries a high risk of thyroid injury, making some parts of the thyroid hypothyroid and possibly also creating nodules with hyperthyroid activity. … Although our recommendations are not in line with Mario’s, nevertheless Mario’s article is fascinating, and a few people have reported benefit from high-dose iodine. Please read his article and judge for yourself! Best, Paul

In Part I (Iodine and Hashimoto’s Thyroiditis, Part I, May 24, 2011) we looked at evidence from animal studies that iodine is dangerous to the thyroid only when selenium is deficient or in excess, and that optimizing selenium status allows the thyroid to tolerate a wide range of iodine intakes. In fact, there were some hints (such as an improved CD4+/CD8+ T cell ratio) that high iodine, if coupled with optimal selenium, might actually diminish autoimmunity.

If that holds in humans too, we should expect that populations with healthy selenium intakes should see a low incidence of thyroid disease and no effect from iodine intake on the incidence of Hashimoto’s thyroiditis. Is that the case?

Korean Study

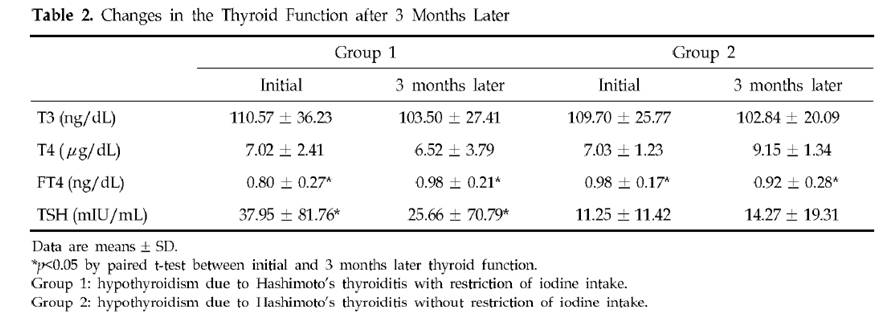
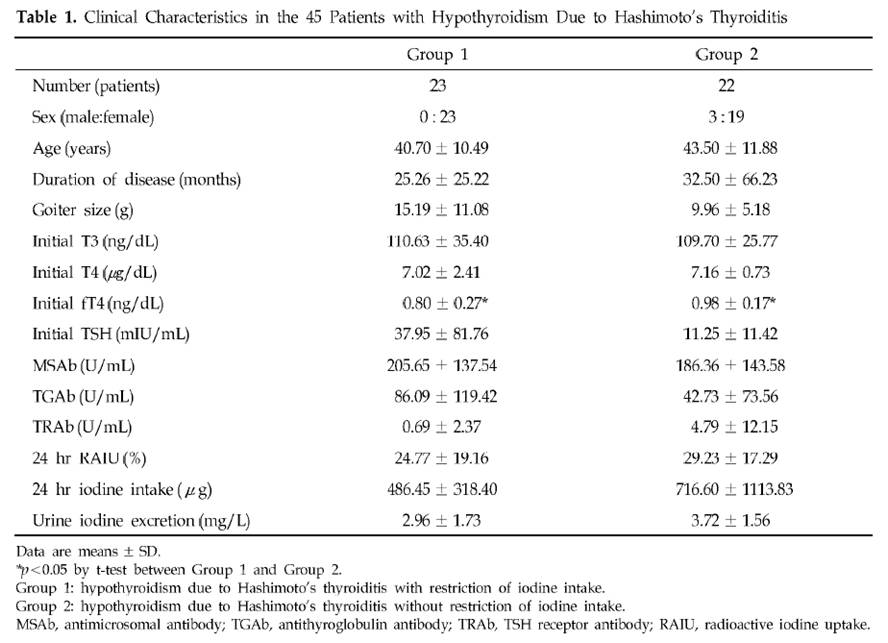
Dr. K [1] quotes a Korean study [3] of Hashimoto’s patients. Half restricted iodine intake to less than 100 mcg/day, the other half ate their normal seaweed and iodine. Of the 23 patients who restricted iodine, 18 (78%) became euthyroid in the sense of having TSH below 4.43 mIU/L, while only 10 (46%) of the 22 that did not restrict iodine became euthyroid. There was no measurement of symptoms at all, and no report of thyroid antibody titers after iodine restriction, so we don’t know if the iodine restriction relieved the underlying autoimmune disorder.

The selection of subjects for the two groups was odd. Group 1, the iodine restricted patients, had an extremely wide range of starting TSH, averaging 38 mIU/L but with a standard deviation of 82 mIU/L. Since all subjects began with TSH above 5 mIU/L, it’s clear that many of the Group 1 members had TSH near 5 and others had TSH well over 100 mIU/L. In comparison, Group 2, the controls, averaged a TSH of 11 mIU/L with a standard deviation of 11 mIU/L – less than 1/7 the standard deviation of Group 1. Few Group 2 members had a TSH above 30.

Table 2 presents the results. Mean TSH in Group 1 was reduced a little, but it did not even come close to normal. Since 78.3% of Group 1 had TSH below 4.43 mIU/L after 3 months, the other 21.7% had to have averaged a TSH above 102.2 mIU/L at the conclusion of the study. The standard deviation of Group 1 TSH at the end of 3 months of iodine restriciton was 71 mIU/L.

Meanwhile, Group 2 members still had a much lower standard deviation at the end of the study: 19 mIU/L.

A conclusion of this study was that “the initial serum TSH concentration was significantly lower in the recovered patients than in the non-recovered patients, which suggests that the possibility of recovvery is increasingly rare as the initial hypothyroidism becomes more severe.” Since Group 1 originally had a much larger fraction of members with very low TSH than Group 2 (plus a few with extremely high TSH to raise the average TSH), and the definition of recovery was a reduction of TSH to 4.43, perhaps it is not surprising that a higher fraction of Group 1 recovered.

Further calling into question the conclusion that lower iodine intake is beneficial is another observation. Looking at Table 1, we see that Group 2 (controls) had, at baseline, much higher iodine intake and higher urinary iodine excretion. Despite this, goiter size, TSH, antimicrosomal (MSAb) and antithyroglobulin (TGAb) antibodies were all lower!

A Japanese Study

A similar study with similar results was done in Japan [4].

In Asia, high iodine intake is due to high consumption of seaweed. Seaweed is high in naturally produced bromine compounds [5][6][7], arsenic [9][12][13], and mercury [9], and can accumulate radioactive iodine [8][9][10][11]. All these substances are known to interfere with thyroid function.

Bromide levels in urine in Asia are very high and are associated with seaweed consumption [6][7]. Values of 5 to 8.1 mg/l have been observed among Japanese, and 8 to 12 mg/l among Koreans.

It is quite possible that any benefits from “iodine restriction,” i.e. seaweed restriction, were due to reduced intake of bromine, arsenic, mercury, and radioactive iodine.

A China Study

Dr. Kharrazian [2] cites a study done in China [14] comparing three different areas: one with iodine deficiency (Panshan), another where iodine is more than adequate (Zhangwu) and a third where iodine is excessive (Huanghua). More than adequate and excessive iodine was associated with increased risk for subclinical and overt hypothyroidism.

But, another study [15], done in the same regions, showed that, coincidentally, Huanghua, the region with excessive iodine, and Zhangwu, the region with more than adequate iodine, had lower median serum selenium concentrations than Panshan, where iodine was deficient. Blood selenium concentrations were 83.2, 89.1 and 91.4 microg/L, respectively. So iodine consumption was inversely related to selenium consumption. Was it lower iodine, or higher selenium, that was beneficial?

TPOAb antibody levels were inversely associated with selenium levels. Patients with the highest TPOAb antibodies (>600 UI/ml) had lower selenium levels than patients with moderate and lower TPOAb antibodies (respectively 83.6, 95.6 and 92.9 UI/ml). [15]

Studies from Brazil, Sri Lanka, Turkey, and Greece

Dr K also cites a rise in Hashimoto’s incidence in Brazil, Sri Lanka, Turkey and Greece after salt iodinization began. Are these countries deficient in selenium? Well, lets see:

Brazil: The study was done in São Paulo, a city with a large Brazilian-Japanese population. Brazilian-Japanese have significant lower levels of Se than Japanese living in Japan [16].

Greece: Selenium status is one of the lowest of the Europe [17].

Turkey: Selenium status of Turkish children is found to be unusually low, only 65 ng/ml in boys and 71 ng/ml in girls [18]. Turkey is characterized by widespread iodine deficiency and marginal selenium deficiency [19].

Sri Lanka: Significant parts of the Sri Lankan female population may be selenium deficient [20].

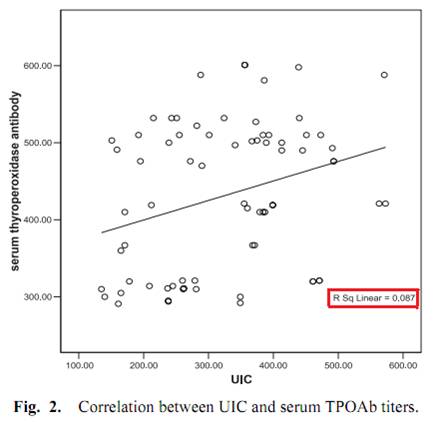
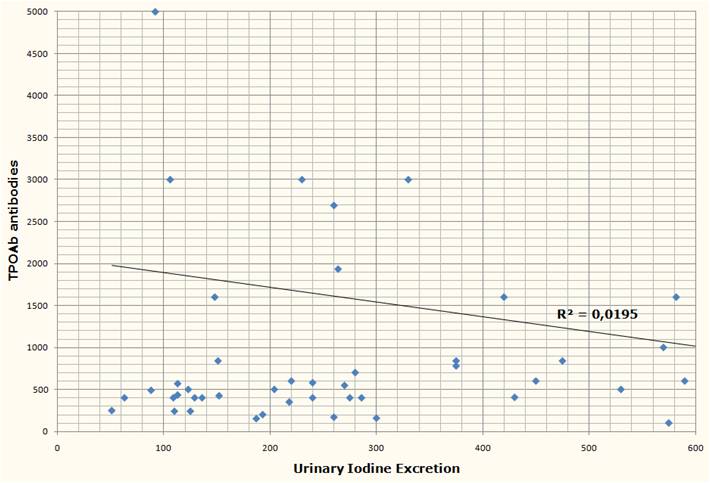
One study, done in Egypt, measured iodine excretation in urine and its relation with thyroid peroxidase antibody (TPOAb) [21]. Although the abstract said that a significant correlation was found, this is far from reality, as we can see from Fig. 2.

Another study from Brazil [2] measured urinary iodine excretation and serum TPOAb and TgAb antibodies from 39 subjects with Hashimoto’s, none of whom were receiving treatment at the time of the study. Both antibody titers had no obvious correlation with urinary iodine.


Two discordant epidemiological studies

From the Netherlands, we have a prospective observational study looking at whether the female relatives of 790 autoimmune thyroid disease patients would progress to overt hypothyroidism or hyperthyroidism [22].

Although the relationship was not considered statistically significant, they found that women with high iodine intake (assessed through questionnaires) were 20% less likely to develop thyroid disorders.

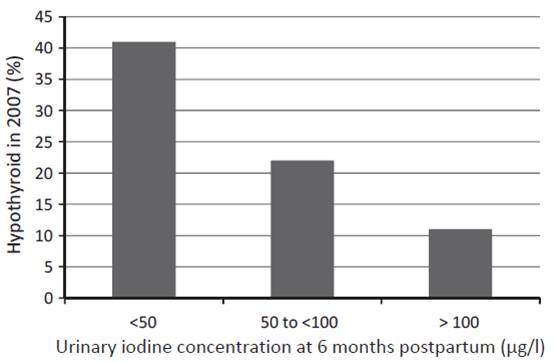
Another study from western Australia (a region that has previously been shown to be iodine replete) measured urinary iodine concentration (UIC) of 98 women at 6 months postpartum and checked their thyroid status both postpartum and 12 years later [23]. UIC at 6 months postpartum predicted both postpartum thyroid dysfunction and hypothyroidism  12 years later:

The researchers concluded:

The odds ratio (OR) of hypothyroid PPTD with each unit of decreasing log iodine was 2.54, (95%CI: 1.47, 4.35), and with UIC < 50 lg/l, OR 4.22, (95%CI: 1.54, 11.55). In the long term, decreased log UIC significantly predicted hypothyroidism at 12-year follow-up (p = 0.002) … The association was independent of antibody status.

In short, the more iodine being excreted (and thus, presumably, the more in the diet and in the body), the less likely were hypothyroid disorders – not only at the time, but also 12 years later.

Dangers of selenium supplementation in iodine deficiency.

Selenium supplementation when iodine and selenium deficiencies are both present  can be dangerous, as the experience in northern Zaire, one of the most severely iodine and selenium deficient population in the world, shows [25].

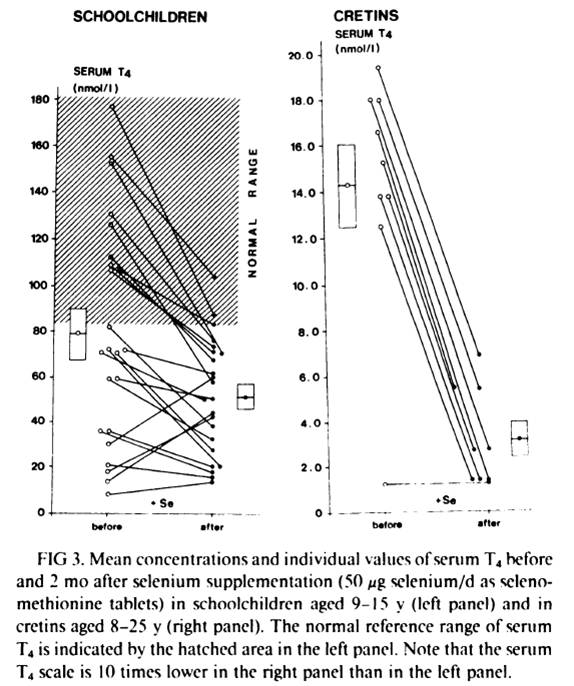
Schoolchildren and cretins were supplemented for 2 months with a physiological dose of selenium (50 mcg Se per day as selenomethionine). Serum selenium was was very low at the beggining of the study and was similar in schoolchildren and in cretins (343 +- 190 nmil/L in schoolchildren, n=23, and 296 +- 116 nmol/L in cretins, n=9). After 2 months of selenium supplementation, the massive decrease in serum T4 in virtually every subject can be seen in fig. 4 below:

In schoolchildren, serum free thyroxin (fT4) decreased from 11.8 +- 6.7 nmol/L to 8.4 +- 4.1 nmol/L (P<0.01); serum reverse triiodothyronine (rT3) decreased from 12.4 +- 11.5 nmol/L to 9.0 +- 7.2 nmol/L; mean serum T3 and mean TSH remained stable. In cretins, serum fT4 remained the same or decreased to an undetectable level in all nine cretins; mean serum T3 decreased from 0.98 +- 0.72 nmol/L to 0.72 +- 0.29 nmol/L, and two cretins who were initially in a normal range of serum  T3 (1.32-2.9 nmol/L) presented T3 values outside the lower limit of normal after selenium supplementation; mean serum TSH increased significantly from 262 mU/L to 363 mU/L (p<0.001).

Another previous similar trial, this time done in 52 schoolchildren, reached the same results: a marked reduction in serum T4 [26][27]. This previous trial “was shown to modify the serum thyroid hormones parameters in clinically euthyroid subjects and to induce a dramatic fall of the already impaired thyroid function in clinically hypothyroid subjects” [27].

What stands out is the difference in the results between euthyroid schoolchildren and cretins/hypothyroids. Two months of selenium supplementation was probably not enough time to affect significantly the thyroid of the euthyroid schoolchildren (althougt already impacted T4 and fT4). But, in cretins and hypothyroids, where the thyroid was already more deficient, the impact was evident.

Conclusion and What I Do

Iodine and selenium are two extremely important minerals for human health, and are righly emphasized as such in the Perfect Health Diet book and blog. I believe they are fundamental to thyroid health and very important to Hashimoto’s patients.

A survey of the literature suggests that Hashimoto’s is largely unaffected by iodine intake. However, the literature may be distorted by three circumstances under which iodine increases may harm, and iodine restriction help, Hashimoto’s patients:

  1. Selenium deficiency causes an intolerance of high iodine.
  2. Iodine intake via seaweed is accompanied by thyrotoxic metals and halides.
  3. Sudden increases in iodine can induce a reactive hypothyroidism.

All three of these negatives can be avoided by supplementing selenium along with iodine, using potassium iodide rather than seaweed as the source of iodine, and increasing iodine intake gradually.

It’s plausible that if iodine were supplemented in this way, then Hashimoto’s patients would experience benefits with little risk of harm. Anecdotally, a number have reported benefits from supplemental iodine.

Other evidence emphasizes the need for balance between iodine and selenium. Just as iodine without selenium can cause hypothyroidism, so too can selenium without iodine. Both are needed for good health.

A few months after I was diagnosed with Hashimoto’s I started 50 mg/day iodine plus 200 mcg/day selenium. If I were starting today, I would follow Paul’s recommendation to start with selenium and a low dose of iodine, and increase the iodine dose slowly. I would not take any kelp, because of potential thyrotoxic contaminants.

Currently I’m doing the following to try to reverse my Hashimoto’s:

  1. PHD diet and follow PHD book and blog advices to enhance immunity against infections, since infections seems to be implicated in Hashimoto’s pathology [28][29][30]. I give special attention to what Chris Masterjohn calls “traditional superfoods”: liver and other organs, bones and marrow, butter and cod liver oil, egg yolks and coconut, because these foods are high in minerals, like iodine, zinc, selenium, copper, chromium, manganese and vanadium, all of which seems to play a role in thyroid health [31];
  2. High dose iodine (50mg of Lugol’s) plus 200 mcg selenium daily. These I supplement because of their vital importance to thyroid and immune function;
  3. 3 mg LDN (low dose naltrexone) every other day to further increase immunity. LDN resources are listed below [32][33][34][35][36];
  4. Avoiding mercury and other endocrine disruptors. When I removed 9 amalgams (mercury), my TPO antibodies increased for 3 months and took another 6 months to return to previous values. I also avoid fish that have high and medium concentrations of mercury. Cod consumption increased my TPO antibodies;
  5. 1g of vitamin C daily. Since it seems to confer some protection against heavy metal thyroid disfunction [37], improve thyroid medication absorption [38] and there is some evidence that it could improve a defective cellular transport for iodine [39];
  6. Donating blood 2 to 3 times per year. In men, high levels of iron seems to impact thyroid function [40].

Final Thanks

I would like to make a special thanks to Paul Jaminet for giving me the opportunity to write this essay, for gathering many, many papers for me, and for having the patience to revise both posts and suggest many changes that made the text clearer; and to Emily Deans who kindly sent me one key study that Paul could not get.

References:

[1] Dr Datis Kharrazian. Iodine and Autoimmune Thyroid — References.  http://drknews.com/some-studies-on-iodine-and-autoimmune-thyroid-disease/.

[2] Marino MA et al. Urinary iodine in patients with auto-immune thyroid disorders in Santo André, SP, is comparable to normal controls and has been steady for the last 10 years. Arq Bras Endocrinol Metabol. 2009 Feb;53(1):55-63. http://pmid.us/19347186.

[3] Yoon SJ et al. The effect of iodine restriction on thyroid function in patients with hypothyroidism due to Hashimoto’s thyroiditis. Yonsei Med J. 2003 Apr 30;44(2):227-35. http://pmid.us/12728462.

[4] Kasagi K et al. Effect of iodine restriction on thyroid function in patients with primary hypothyroidism. Thyroid. 2003 Jun;13(6):561-7. http://pmid.us/12930600.

[5] Gribble GW. The natural production of organobromine compounds. Environ Sci Pollut Res Int. 2000 Mar;7(1):37-47. http://pmid.us/19153837.

[6] Zhang ZW et al. Urinary bromide levels probably dependent to intake of foods such as sea algae. Arch Environ Contam Toxicol. 2001 May;40(4):579-84. http://pmid.us/11525503.

[7] Kawai T, Zhang ZW et al. Comparison of urinary bromide levels among people in East Asia, and the effects of dietary intakes of cereals and marine products. Toxicol Lett. 2002 Aug 5;134(1-3):285-93. http://pmid.us/12191890.

[8] Leblanc C et al. Iodine transfers in the coastal marine environment: the key role of brown algae and of their vanadium-dependent haloperoxidase. Biochimie. 2006 Nov;88(11):1773-85. http://pmid.us/17007992.

[9] van Netten C et al. Elemental and radioactive analysis of commercially available seaweed. Sci Total Environ. 2000 Jun 8;255(1-3):169-75. http://pmid.us/10898404.

[10] Hou X et al. Iodine-129 in human thyroids and seaweed in China. Sci Total Environ. 2000 Feb 10;246(2-3):285-91. http://pmid.us/10696729.

[11] Toh Y et al. Isotopic ratio of 129I/127I in seaweed measured by neutron activation analysis with gamma-gamma coincidence. Health Phys. 2002 Jul;83(1):110-3. http://pmid.us/12075675.

[12] Miyashita S, Kaise T. Biological effects and metabolism of arsenic compounds present in seafood products. Shokuhin Eiseigaku Zasshi. 2010;51(3):71-91. http://pmid.us/20595788.

[13] Cleland B et al. Arsenic exposure within the Korean community (United States) based on dietary behavior and arsenic levels in hair, urine, air, and water. Environ Health Perspect. 2009 Apr;117(4):632-8. Epub 2008 Dec 8. http://pmid.us/19440504.

[14] Chong W, Shit Xg, Teng WP, et al. Multifactor analysis of relationship between the biological exposure to iodine and hypothyroidism. Zhongua Yi Za Zhi. 2004 Jul 17:84(14):1171-4. http://pmid.us/15387978.

[15] Tong YJ et al. An epidemiological study on the relationship between selenium and thyroid function in areas with different iodine intake. Zhonghua Yi Xue Za Zhi. 2003 Dec 10;83(23):2036-9. http://pmid.us/14703411.

[16] Karita K et al. Comparison of selenium status between Japanese living in Tokyo and Japanese brazilians in São Paulo, Brazil. Asia Pac J Clin Nutr. 2001;10(3):197-9. http://pmid.us/11708308.

[17] Thorling EB et al. Selenium status in Europe–human data. A multicenter study. Ann Clin Res. 1986;18(1):3-7. http://pmid.us/3717869.

[18] Mengüba? K et al. Selenium status of healthy Turkish children. Biol Trace Elem Res. 1996 Aug;54(2):163-72. http://pmid.us/8886316.

[19] Hincal F. Trace elements in growth: iodine and selenium status of Turkish children. J Trace Elem Med Biol. 2007;21 Suppl 1:40-3. http://pmid.us/18039495.

[20] Fordyce FM et al. Selenium and iodine in soil, rice and drinking water in relation to endemic goitre in Sri Lanka. Sci Total Environ. 2000 Dec 18;263(1-3):127-41. http://pmid.us/11194147.

[21] Alsayed A et al. Excess urinary iodine is associated with autoimmune subclinical hypothyroidism among Egyptian women. Endocr J. 2008 Jul;55(3):601-5. Epub 2008 May 15. http://pmid.us/18480555.

[22] Strieder TG et al. Prediction of progression to overt hypothyroidism or hyperthyroidism in female relatives of patients with autoimmune thyroid disease using the Thyroid Events Amsterdam (THEA) score. Arch Intern Med. 2008 Aug 11;168(15):1657-63. http://pmid.us/18695079.

[23] Stuckey BG et al. Low urinary iodine postpartum is associated with hypothyroid postpartum thyroid dysfunction and predicts long-term hypothyroidism. Clin Endocrinol (Oxf). 2011 May;74(5):631-5. doi: 10.1111/j.1365-2265.2011.03978.x. http://pmid.us/21470286.

[24] American Association of Clinical Endocrinologists Medical Guidelines for Clinical Practice for the Evaluation and Treatment of Hyperthyroidism and Hypothyroidism. https://www.aace.com/sites/default/files/hypo_hyper.pdf.

[25] Vanderpas JB et al. Selenium deficiency mitigates hypothyroxinemia in iodine-deficient subjects. Am J Clin Nutr. 1993 Feb;57(2 Suppl):271S-275S. http://pmid.us/8427203.

[26] Contempré B et al. Effect of selenium supplementation on thyroid hormone metabolism in an iodine and selenium deficient population. Clin Endocrinol (Oxf). 1992 Jun;36(6):579-83. http://pmid.us/1424183.

[27] Contempré B et al. Effect of selenium supplementation in hypothyroid subjects of an iodine and selenium deficient area: the possible danger of indiscriminate supplementation of iodine-deficient subjects with selenium. J Clin Endocrinol Metab. 1991 Jul;73(1):213-5. http://pmid.us/2045471.

[28] Benvenga S et al. Homologies of the thyroid sodium-iodide symporter with bacterial and viral proteins. J Endocrinol Invest. 1999 Jul-Aug;22(7):535-40. http://pmid.us/10475151.

[29] Wasserman EE et al. Infection and thyroid autoimmunity: A seroepidemiologic study of TPOaAb. Autoimmunity. 2009 Aug;42(5):439-46. http://pmid.us/19811261.

[30] Tozzoli R et al. Infections and autoimmune thyroid diseases: parallel detection of antibodies against pathogens with proteomic technology. Autoimmun Rev. 2008 Dec;8(2):112-5. http://pmid.us/18700170.

[31] Neve J. Clinical implications of trace elements in endocrinology. Biol Trace Elem Res. 1992 Jan-Mar;32:173-85. http://pmid.us/1375054.

[32] David Gluck, MD. Low Dose Naltrexone information site. http://www.lowdosenaltrexone.org/.

[33] LDN Yahoo Group. http://groups.yahoo.com/group/lowdosenaltrexone/.

[34] LDN World Database. Where LDN users share their experience with various diseases. http://www.ldndatabase.com/.

[35] Those Who Suffer Much Know Much. A colection of LDN users testimonies. http://www.ldnresearchtrustfiles.co.uk/docs/2010.pdf.

[36] Elaine A. More. The Promise Of Low Dose Naltrexone Therapy: Potential Benefits in Cancer, Autoimmune, Neurological and Infectious Disorder. http://www.amazon.com/Promise-Low-Dose-Naltrexone-Therapy/dp/0786437154.

[37] Gupta P, Kar A. Role of ascorbic acid in cadmium-induced thyroid dysfunction and lipid peroxidation. J Appl Toxicol. 1998 Sep-Oct;18(5):317-20. http://pmid.us/9804431.

[38] Absorption of thyroid drug levothyroxine improves with vitamin C. The Endocrine Society. News Room. http://www.endo-society.org/media/ENDO-08/research/Absorption-of-thyroid-drug.cfm.

[39] Abraham, G.E., Brownstein, D.. Evidence that the administration of Vitamin C improves a defective cellular transport mechanism for iodine: A case report. The Original Internist, 12(3):125-130, 2005. http://www.optimox.com/pics/Iodine/IOD-11/IOD_11.htm.

[40] Edwards CQ et al. Thyroid disease in hemochromatosis. Increased incidence in homozygous men. Arch Intern Med. 1983 Oct;143(10):1890-3. http://pmid.us/6625774.