Category Archives: Obesity

Disease Begins in the Mucus

Hippocrates famously said, “All disease begins in the gut.” I think we can narrow it down further: much modern disease begins in the mucus.

In a recent post, I put up this picture:

Antimicrobial peptides (AMPs), including defensins and cathelicidins, constitute an arsenal of innate regulators of paramount importance in the gut.

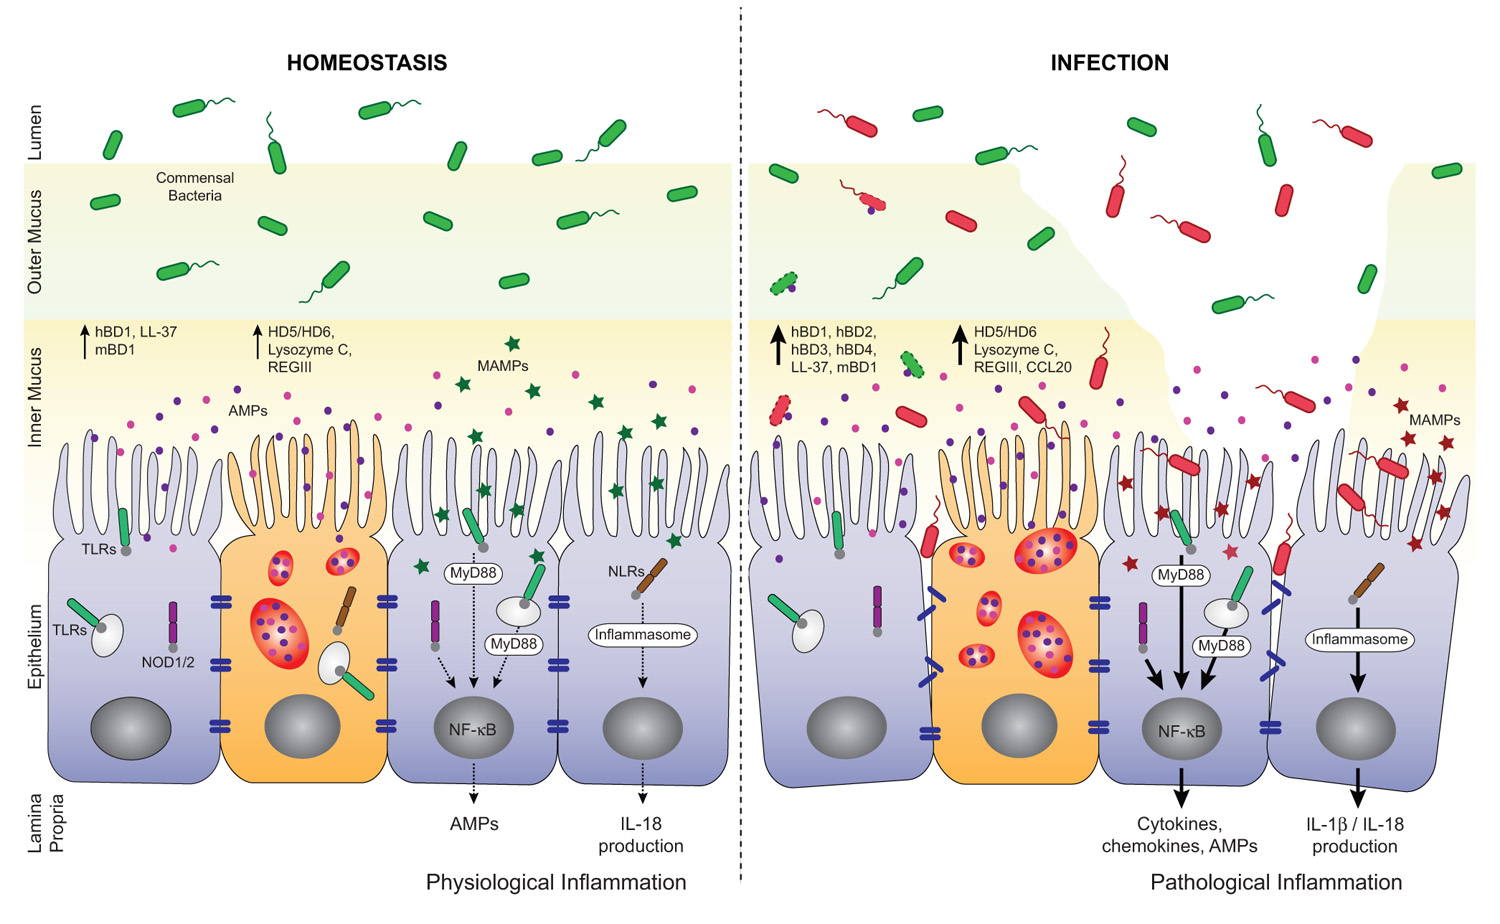
A depleted mucosal layer leads to inflammation and gut permeability.

It’s from a paper on the role of antimicrobial peptides in maintaining gut health. [1] The point of the left panel is that a healthy gut is characterized by a thick mucosal layer that shields our intestinal and immune cells from direct contact with bacteria. The inner mucus layer is infused with antimicrobial peptides to minimize its bacterial content. The outer mucus layer contains a population of friendly mucin-degrading bacteria – symbionts like Akkermansia who evolved to feed on our mucus. These friendly bacteria provide another layer of defense against infectious pathogens; bacteria tend to be quite good at keeping out competitors. Akkermansia has been found to prevent obesity.

In an unhealthy gut, on the other hand, the mucosal layer often gets stripped away. The image (right panel) attributes this to infection, which is one possibility, but nutritional factors also matter. For example:

  • Deficiencies of vitamins A or D will reduce production of antimicrobial peptides, making it easier for pathogens to reach our gut cells;
  • On very low-carb diets, production of mucin-2, the primary constituent of gut mucus, may be limited in order to preserve glucose for the brain (see “Dangers of Zero-Carb Diets, II: Mucus Deficiency and Gastrointestinal Cancers,” Nov 15, 2010);
  • Deficiencies of dietary fiber, vinegar, choline, and other nutrients may impair gut motility, leading to concentrations of partially digested food and bacteria at specific points in the intestine.

Regardless of why it happens, once bacteria come into direct contact with our gut and immune cells, they trigger inflammation and tend to loosen the gut barrier. This allows live bacteria and cell wall components from dead bacteria to enter the body from the gut.

Endotoxins – toxic compounds released when bacteria die, such as lipopolysaccharides from the cell walls of gram-negative bacteria – are immunogenic and inflammatory. A large influx of endotoxins into the body is “endotoxemia” – poisoning by endotoxins. As little as 2 nanograms LPS per kilogram body weight will induce fever, and 1 microgram LPS per kilogram of body weight will induce shock. [2]

Diseases caused by endotoxemia include:

  • Hepatitis [3]
  • Diabetes [4]
  • Heart disease [5]
  • Obesity [6]
  • Pulmonary hypertension [7]
  • Dyslipidemia [8]
  • Chronic kidney disease [9]

Many of today’s most prevalent diseases are caused by chronic endotoxemia.

So it behooves us to avoid it. If endotoxemia is fundamentally caused by the loss of a protective mucosal layer in the gut, how do we assure healthy production of mucus?

A recent paper sheds valuable light on that question.

Natural Whole Foods, High-Fat Diets, and Gut Health

It’s well known that in mice, “high-fat diets” induce endotoxemia. But these diets aren’t necessarily high in fat – any pelleted rodent food in which fat provides more than 20% of calories may be called “high-fat.” The critical difference of “high-fat diets” from chow is that they are composed of purified nutrients – starch, sugar, oil, vitamins, and minerals – whereas chow is composed of natural whole foods such as wheat, corn, and seeds.

A recent study tried to distinguish whether the cause of endotoxemia is the fat, or the purified starch, sugar, and oil. It made up three diets of varying fat content (8%, 48%, and 74% of energy respectively), but composed of natural whole foods. [10]

The result was remarkable:

[U]sing complex [i.e. natural whole foods] HFD, no associations were observed between dietary lipid amounts and the magnitude of endotoxemia, inflammation, and physiological alterations developed.

It turns out the endotoxemia that typically develops on high-fat diets is due to getting the calories from purified sources – starch, sugar, oil – rather than from whole foods. On a whole foods diet, the amount of endotoxin entering the body is more or less independent of the amount of fat consumed.

This is surprising in one respect. Lipopolysaccharide is fat-loving and enters the body along with dietary fat. So it stands to reason that a higher-fat diet would carry more endotoxin into the body.

But it turns out the body has mechanisms to regulate how much endotoxin enters the body. It wants a small amount so that the immune system can sample the gut microbiome, but not so much as to cause inflammation.

The primary mechanism for controlling endotoxin influx? Mucus production. The study noted that the mice eating higher-fat “had an increased number of goblet cells … [and] an increased MUC2 production.” MUC2 is mucin-2, the primary component of mucus in the gut.

Here is a picture with mucin-2 in the mucin-producing goblet cells stained red:

disease begins in mucus 02

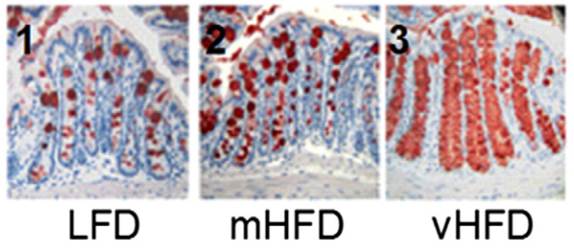
It’s obvious that mucin production goes up dramatically as the fat content of the diet increases.

The study concludes,

“We show that, in complex HFDs based on chow ingredients and milk fat, there was no association between dietary lipid amounts and the magnitude of metabolic endotoxemia or low-grade inflammation.”

If high-fat diets are healthy, we can thank our mucin-producing goblet cells.

One last note: the fact that mice can produce healthy amounts of mucus on a 74% fat diet does not necessarily mean that humans can do the same. Humans have much larger brains than mice, and as a result our carbohydrate needs are larger. It’s possible that mice can maintain mucus production on a low-carb diet better than humans can.

References

[1] Muniz LR, Knosp C, Yeretssian G. Intestinal antimicrobial peptides during homeostasis, infection, and disease. Front Immunol. 2012 Oct 9;3:310. http://pmid.us/23087688.

[2] Warren HS et al. Resilience to bacterial infection: difference between species could be due to proteins in serum. J Infect Dis. 2010 Jan 15;201(2):223-32. http://pmid.us/20001600.

[3] Parlesak A, Schäfer C, Schütz T, Bode JC, Bode C. Increased intestinal permeability to macromolecules and endotoxemia in patients with chronic alcohol abuse in different stages of alcohol-induced liver disease. J Hepatol. 2000 May;32(5):742-7. http://pmid.us/10845660.

[4] Moreno-Navarrete JM et al. Circulating lipopolysaccharide-binding protein (LBP) as a marker of obesity-related insulin resistance. Int J Obes (Lond). 2012 Nov;36(11):1442-9. http://pmid.us/22184060.

[5] Lepper PM et al. Association of lipopolysaccharide-binding protein and coronary artery disease in men. J Am Coll Cardiol. 2007 Jul 3;50(1):25-31. http://pmid.us/17601541.

[6] Cani PD et al. Metabolic endotoxemia initiates obesity and insulin resistance. Diabetes. 2007 Jul;56(7):1761-72. http://pmid.us/17456850.

[7] Dschietzig T, Alexiou K, Richter C, Bobzin M, Baumann G, Stangl K, Brunner F. Endotoxin causes pulmonary hypertension by upregulating smooth muscle endothelin type-B receptors: role of aldose reductase. Shock. 2008 Aug;30(2):189-96. http://pmid.us/18091567.

[8] Lassenius MI et al. Bacterial endotoxin activity in human serum is associated with dyslipidemia, insulin resistance, obesity, and chronic inflammation. Diabetes Care. 2011 Aug;34(8):1809-15. http://pmid.us/21636801.

[9] McIntyre CW et al. Circulating endotoxemia: a novel factor in systemic inflammation and cardiovascular disease in chronic kidney disease. Clin J Am Soc Nephrol. 2011 Jan;6(1):133-41. http://pmid.us/20876680.

[10] Benoit B et al. Increasing fat content from 20 to 45 wt% in a complex diet induces lower endotoxemia in parallel with an increased number of intestinal goblet cells in mice. Nutr Res. 2015 Apr;35(4):346-56. http://pmid.us/25687164.


Does PHD Immediately Normalize the Bodyweight Set Point?

The results from the Perfect Health Retreats continue to surprise me.

Retreat attendees come for all sorts of reasons. In terms of weight, they have so far had a fairly similar profile to the general middle-aged population, with almost half being obese and another quarter overweight. That’s enough obese and overweight participants to give us insight into the effects of our advice for weight loss.

Weight Loss Experience at the Perfect Health Retreat

When I was preparing my Ancestral Health Symposium talk on weight loss, I noticed a remarkable pattern that I didn’t have time to discuss in my talk. The pattern was that the amount of weight loss during retreats was proportional to the excess weight of the participants.

Here are some charts, with the amount of weight loss during the retreat plotted against BMI. From our 2013 retreats, which lasted 30 days, I’ve plotted just the obese participants:

01 Weight Change During 2013 PH Retreats

And from our May 2014 retreat, which lasted two weeks, I’ve plotted the obese and overweight participants:

02 Weight Change During 2014 May PH Retreat

You can see that the amount of weight lost in this short period is roughly proportional to starting BMI. It tracks remarkably closely to a straight line. I’ve put the equations for the lines underneath each figure.

If weight loss follows these straight lines, then you can easily envision what would happen to someone with a high starting BMI, say 50, who lived at the retreat permanently. He would lose weight rapidly at first. As his weight (and BMI) declined, his rate of weight loss would slow, tracking the line. As he approached a destination BMI in the 20-29 range, his rate of weight loss would approach zero. His weight would stabilize at this destination BMI.

(Parenthetically, let me comment on a few features of the charted data. First, it doesn’t surprise me that the destination BMI in the 2013 retreats was higher than that in the 2014 retreats; our program was still under development in 2013, the retreats are much more optimized now; for example, the 2013 retreats were held in a rather dimly lit facility with few windows, yet we know that circadian rhythm entrainment is huge for weight loss. Second, it doesn’t surprise me that the 2014 data is noisier than the 2013 data; the shorter retreat means that other factors, such as jet lag from traveling to the retreat, influence outcomes more significantly; also, in May 2014 we didn’t weigh anyone at the retreat so weights were self-reported from home by guests, making the weights not as reflective of the retreat environment and the time between weighings somewhat variable. Third, it doesn’t surprise me that the rate of weight loss at the 2014 retreat was slower than at the 2013 retreat; 2014 retreat participants were explicitly encouraged not to restrict calories, and wine, snacks, and desserts were served daily, whereas in 2013 the proprietor encouraged some calorie restriction and did not serve alcohol.)

The destination BMIs – the weights at which the fitted lines indicate weight loss would stop – are remarkably close to normal weight.

Implications for a Body Weight “Set Point”

Obesity researchers have found the concept of a body weight “set point” to be useful in explaining obesity. However, they generally find that the “set point” is well above normal weight, even after weight loss interventions.

Our Perfect Health Retreat weight loss experiences are consistent with the existence of a set point. However, Retreat experiences are best understood as telling us that:

  1. The body has a desired weight – a set point – that weight inexorably migrates toward.
  2. The pressure or force driving weight change, as indicated by the rate of weight change, is proportional to the deviation of actual weight from the set point. A larger deviation from the set point creates a greater pressure for weight change and a more rapid migration toward the set point. As the set point is approached, the rate of weight change slows down.
  3. In the context of our retreats, in which people follow the Perfect Health diet and lifestyle, the set point is reset to a normal weight within a few days of their arrival at the retreat.

If PHD does indeed reset the set point to normal in a few days, it is consistent with the theme of my Ancestral Health Symposium talk: it is diet and lifestyle that determine weight; fix those and your weight will inexorably normalize.

But this conclusion is radically contrary to the beliefs of academic obesity researchers. The general view is that changing the set point is extremely difficult, in part because the determinants of the set point extend back in time many decades:

Your heredity and your environment-starting back at the moment of your conception-determine your set point. Over the long term, excess food and insufficient exercise will override your body’s natural tendency to stay at its set point and lead to a higher, less healthy set point.

This implies that normalizing the set point will also require years or decades, because that is how long it takes for the influence of past set-point-raising factors to expire.

The Center for the Study of Nutrition Medicine, led by the distinguished obesity researcher George Blackburn, advises that one can’t sustainably lose more than 10% of body weight in six months:

Scientific evidence supports losing no more than 10% of your body weight at a time. It turns out that the body’s set point and its many regulatory hormones dictate the effectiveness of the 10% loss. That’s the amount of weight you can lose before your body starts to fight back. Many clinical studies have confirmed this phenomenon. Of course, some people can lose more than 10% at a time, but precious few can then maintain that loss.

After you maintain your new, lower weight for 6 months, you can repeat the cycle and reset your set point again by losing another 10%.

Is Dr. Blackburn’s conclusion, confirmed by “many clinical studies,” valid for PHDers? To test that, we need a longer time series.

The largest weight losses at the Perfect Health Retreat have been about 10% of body weight in 30 days. If Dr. Blackburn is right, then after people on PHD lose 10% of the body weight – i.e., after one or two months on PHD – then we should see weight loss stall or enter a yo-yo pattern for the remainder of six months, until the set point adjusts lower and weight loss can resume.

Alternatively, if PHD immediately and permanently resets the set point to a normal weight, the rate of weight loss in PHDers should track a straight line just like in the retreat data. We should see continuous weight loss with no stalls – although there will be a steady slowing of weight loss as a normal weight is approached. In the long run, weight is normalized permanently, and there is no weight regain as long as the person remains on PHD.

Which is it?

The long-term pattern of weight loss on PHD

Fortunately we have a few cases in which PHD readers have faithfully followed our advice, tracked their weight closely, and shared the data with us.

Before I discuss their weight loss experiences, let me describe the weight loss path we would expect to see if the pattern observed at the retreats holds up. The weight loss pattern observed at the retreats is described in a simple equation:

06 weight loss formula 1
Here w is body weight, sp is set point, τ is a characteristic time for weight loss, and Δw is the change in weight achieved in a retreat of length Δt.

Those of you who took calculus will recognize that as a differential equation which we can integrate. It leads to the following formula for weight as a function of time:

07 weight loss formula 2
Here e is a mathematical constant that is about 2.718. This is the formula for what is called an “exponential decay.” Weight starts at w(0), the weight at time zero, and it decays steadily toward the target weight, sp. The characteristic time, τ, is the time needed to progress 63.2% of the way toward sp.

So if PHD is really re-setting the set point to a normal weight within a few days, after which the set point doesn’t change — it just stays at the same weight, normal — then we should see weight loss follow this exponential decay.

OK, now let me get to cases.

The case of Jay Wright

Previously on this site we discussed Jay Wright’s weight loss journey. Here is his weight in blue, and I’ve fitted an exponential decay to it in red:

05 Jay Wright Weight History after starting PHD

It’s a pretty good fit with a set point of 151 pounds and a characteristic time of 146 days.

Jay’s weight loss took place in 2011. In several years since then, his weight has remained stable around 170 pounds. I believe Jay’s height is 5’10”, so his BMI at 170 pounds is 24.4 and his BMI at the fitted target weight of 151 pounds would have been 21.7.

As you can see by reading Jay’s story, during his period of weight loss he was intentionally restricting calories to 1200 calories per day; but when he got to his goal weight of 170-175 pounds he stopped restricting calories and ate to appetite. I’ll speculate that intentional calorie restriction may lower the set point by a few BMI points, say from 24.4 to 21.7, so that Jay’s “set point” during his weight loss period was 151 pounds but it reverted to 170 pounds once he began eating ad libitum.

The case of Isaac Knoflicek

Our second case was posted by Isaac Knoflicek on the PHD Facebook group a few weeks ago. Here was his weight loss chart. He described it this way:

~110 lost, first chunk was bike commuting, then after about a year of that I started PHD and the weight came off like crazy.

Isaac gave me his weight loss data. Here is what happened after he began PHD:

04 Isaac Knoflicek Weight Loss History after starting PHD

As you can see, it’s a great fit to an exponential decay – an even better fit than in Jay’s case.

Isaac is 6’3” (190.5 cm) tall, so the target weight of 191 pounds is a BMI of 23.9 – absolutely normal.

Although Isaac’s data ended in early 2013, he wrote, “I’ve spent the last year and a half making smaller tweaks but generally staying around the same weight.” That’s consistent with him having gotten close to his target weight; and with his set point having been permanently reset to a normal weight, so that there is no biological pressure for weight regain.

Here are Isaac’s before and after photos:
08 IsaacKnoflicek before09 Isaac Knoflicek after

Implications

Every obese person who has come to our retreats has lost weight (save one whose weight was unchanged), and in most cases weight loss tracked closely to the same pattern for all participants: a linear relationship between weight loss rate and starting BMI. The line reaches a zero weight loss rate near a normal BMI.

The implication is that for nearly all retreat participants, PHD actually fixes all the factors of overweight or obesity and leads to a normalization of the body weight set point. Although our experience at the retreats is still limited, the statistics are good enough to infer that PHD should work for most, if not all, non-diabetic obese people.

Another implication is that it’s possible to normalize set point in just a few days. If set point wasn’t normalized in a few days, weight loss rates over a 14-day retreat could not track a straight line.

Very likely, the reason the set point has appeared persistently high to academic researchers is that the weight loss approaches they have studied don’t actually address most factors in obesity. My Ancestral Health Symposium talk explains that weight is set by a multifactorial process and if multiple obesogenic factors are left uncorrected, the set point will remain elevated.

A third implication is that there is a characteristic physiological time for weight loss, and it may not be possible to accelerate weight loss much. The fastest rate of weight loss we observe is about 4 months to move 63% of the way toward normal weight from current weight. Based on rates of weight loss at the retreats, 6 to 8 months is more typical.

Fourth, it’s not obvious that calorie restriction is either necessary or desirable for long-term weight loss. If all calorie restriction does is temporarily lower the set point by a few BMI points, without affecting the characteristic time for weight loss τ, then calorie restriction may have little effect on either the ultimate weight or on how long it takes to reach it. Calorie restriction may be an energy-sapping, misery-inducing tactic that succeeds only in reducing weight slightly for a few months, with no long-term benefit. And it may have health risks.

Finally, the “last ten pounds problem” has produced a lot of angst. People often lose weight successfully to a weight about 10 pounds above their personal target, then find it extremely difficult to lose the last 10 pounds. We can now see why the last ten pounds can be so hard to lose. First, any minor defect in diet or lifestyle may raise the set point slightly. Second, weight generally rises with age, and people may use their younger weights as targets; so they may be underestimating their body’s physiological weight target. But mainly, it may just be that weight loss becomes very slow once you are within ten pounds of the set point. At 10 pounds above the set point, it takes 6 months to lose 6 pounds, even if you do everything perfectly. That’s only 1 pound per month. From 4 pounds above the set point, it takes 6 months to lose another 2.4 pounds – only 0.4 pounds per month. Then the pace of weight loss slows further. Once the rate of weight change slows to 0.1 pounds per week or less, it will appear to have gone to zero.

Conclusion

To convince skeptics, we will need more data. But I’m going to jump directly to these conclusions:

  • For most people, PHD (including both diet and lifestyle practices) will cure obesity – in the sense of normalizing body weight set point – in a few days.
  • Although the set point is normalized almost immediately, weight loss takes time. Even if you do everything perfectly, it takes about 6 months to shed 63% of excess weight, a year to lose 86%, 18 months to lose 95%, and 2 years to lose 98%. The last few pounds take a long time to go away.

Curious if I’m right? If you are overweight and would like to test this personally, come to our retreats and help us generate more data.

PHRetreat_img9_600x400px

My Ancestral Health Symposium talk on Weight Loss

What’s New in the New Edition, 2: How to Lose Weight

NOTE: What’s New in the New Edition, 1 is here; and here is the Amazon book page.

Scribner wanted the new edition to show people how to lose weight. We were happy to do that. I’d been planning to devote 2012 to weight loss and obesity blog posts, and then to write an obesity and weight loss book in 2013. We just moved the schedule up and squeezed the ideas into Perfect Health Diet.

Our book offers a unique take on obesity and weight loss. Some of the science is original to us – the ideas do not appear in Pubmed – and the conclusions are unusual for diet books:

The best diet for weight loss is delicious and does not generate cravings or more than mild hunger. You can – and should! – lose weight with minimal suffering.

The popular diets that generate the quickest short-term weight loss are not optimal for long-term sustainable weight loss; they are prone to yo-yo weight regain.

Unlike those diets, the Perfect Health Diet offers a path to lasting weight less and permanent restoration of normal weight and normal body composition.

If we’re right about the science and these conclusions, then our book could be a game-changer for weight loss.

Filling in Some Missing Context

The major defect of squeezing our obesity & weight loss material into Perfect Health Diet, instead of distributing it over two books, is that we didn’t have space to provide a lot of context to the obesity material. Our stage-setting chapters were devoted to the general question of “what’s a healthy diet” and were framed with a discussion of Michael Pollan’s food rules, not with discussion of issues specific to obesity and weight loss.

So let me add some context here.

The Recipe for a Popular Weight Loss Book

The recipe for a popular weight loss book seems to be:

  • Declare that doltish mainstream authorities are stuck in some absurdly mistaken view, and their loyalty to this paradigm has led them to overlook the key to weight loss.
  • The key to weight loss is simple:  give up a single villainous food.

This formula has been followed to good effect by Dr. William Davis (Wheat Belly) who vilifies wheat, Gary Taubes (Good Calories, Bad Calories and Why We Get Fat) who vilifies carbs in general or sugar specifically, and Dr. Robert Lustig (Fat Chance) who vilifies sugar.

The view that authors attribute to mainstream authorities is, often, a straw man. Here is Gary Taubes in his Reddit “Ask Me Anything” describing the absurdly mistaken view that he calls “calories in, calories out”:

Imagine we have a pair of identical twins. Say 18-year-old boys. Every day we measure their energy expenditure and every day we feed them exactly how many calories they expend. So we match calories in to calories out. They get both the same diet with one exception: one gets 300 calories of sugar or HFCS where the other gets 300 calories of a different carbohydrate or of fat. Then we continue this feeding experiment for the next 20 years or so….

If you believe obesity is about calorie-in-calories-out and that’s the only thing that matters, then both twins are going to end up exactly the same weight with exactly same amount of fat on their body and they’re both going to end up expending the same amount of energy.

The view he is describing is that dietary quality doesn’t matter a whit, only quantity of calories matters: the only thing that affects body weight, fat mass, and energy expenditure is how many calories were consumed, and how many calories are consumed isn’t affected by dietary quality.

In other words, a diet of nothing but cotton candy, Twinkies, and Coca-Cola would generate after 20 years exactly the same body composition and health as a diet of fish, rice, and vegetables.

Is there a single person in the world who holds this view?

Here is a review of Dr. Lustig’s Fat Chance:

The book repeats and expands on the main point of contention in the sugar wars: whether our bodies treat all calories the same. The old guard says yes: A calorie is a calorie; steak or soda, doesn’t matter. Eat more calories than you burn, you’ll gain weight. Lustig believes that our bodies react to some types of calories differently than others. [PAJ: emphasis added]

The “old guard” does not always take kindly to the assertion that it never occurred to them that the body might react differently to different foods. The article notes:

[A] leading endocrinologist, who asked to go unnamed, called Lustig an “idiot.”

These are times when I wish our diet approved of popcorn!

Now, let me be clear: these authors are giving good advice. Indeed, we give the same advice. With Drs. Davis and Lustig, we recommend eliminating wheat and added sugar; with Taubes, we believe the average American should cut carb intake roughly in half. Taking these steps will help people lose weight.

But these books have significant flaws:

  • The advice is incomplete. There are many factors which promote obesity. Removal of a single factor will rarely normalize weight.
  • The scientific background is misleading. It often seems that the goal is not so much to provide insight, as to set up a compelling and entertaining narrative. The story reads like the script of a Hollywood action movie: a frightening and mysterious problem appears which befuddles everyone – a solution is proposed – a hero implements the solution.

Perhaps it is not possible to write books more popular than these, but I think it is possible to write books that provide more insight and have a better chance of delivering lasting weight loss to readers who are willing to invest effort.

Obesity is a complex disorder, and many factors contribute to it. I think we did a fairly good job of addressing many of those factors – enough to enable nearly all readers to lose weight effectively, but also to gain a deeper understanding of obesity and its causes.

The Puzzle of Fatty Acid Ratios

The focus on wheat, sugar, and carbs in the popular diet books ignores what may be the primary cause of the obesity epidemic. In my Q&A with Latest in Paleo readers, I gave six reasons why omega-6 fats promote obesity. Some of these are discussed in detail in the book.

Any explanation for the obesity epidemic should account for the accumulation of omega-6 fatty acids in the body that has coincided with the obesity epidemic:

This is a plot found on p 115 of the book; the data was compiled by Stephan Guyenet of Whole Health Source, the circles are the omega-6 fraction in adipose tissue, and the crosses are the obesity rate among 18-29 year olds. It is hard to make sense of this pattern if omega-6 fats are not causing the obesity epidemic. No carb-centric explanation for obesity will tend to make omega-6 fats accumulate this way. Unlike some of the other weight loss books, we make a good faith effort to explain data like this.

Why Do Low-Carb Diets Work?

The omega-6 accumulation is only one of a number of puzzles that a good theory of weight loss and weight gain should explain. Another is the efficacy of low-carb diets.

If carbs don’t cause obesity, why do low-carb diets promote weight loss?

This issue is explored in chapter 17, where we show reasons why reducing carbs to 30% of energy or less will be beneficial for weight loss, but also why there’s generally little long-term benefit from further reductions in carb intake. Low-carb is good, but very low-carb isn’t better for long-term weight loss.

The Problem of Yo-Yo Weight Loss

Another important puzzle: Why is yo-yo weight loss and regain so common?

Here is Jay Wright’s weight loss history, mentioned in the book at page 184:

Although he had successful short-term weight loss on a number of diets, including very low-carb Paleo, they always made him hungry and sooner or later the weight was regained.

On our diet, Jay reached his normal weight in October 2011. He emailed me a happy new year wish, and remains at his normal weight 15 months later – the first time since college he’s been able to maintain that weight.

Why did our diet normalize his weight permanently without hunger, when other weight loss diets led to hunger and weight regain? That is the primary subject of our chapter 17, and is one of our original contributions to the theory of obesity.

Malnutrition and Weight Gain

We argue that malnutrition is a potent cause of increased appetite and weight gain.

A theme of Weston A. Price’s Nutrition and Physical Degeneration is that pregnancy depletes nutrients in the mother, frequently leading (especially in closely spaced pregnancies) to malnutrition in both mother and child.

If we’re right, then this could be why pregnancies, especially closely spaced pregnancies, tend to produce maternal weight gain.

I got a New Year’s update from Jennifer Fulwiler, another source of a reader report in the book (on p 11). She’s now pregnant with her sixth child, and left a comment noting her much improved health this pregnancy:

I have been following the PHD for this pregnancy. The results have been amazing. In fact, with all five of my previous pregnancies I had debilitating, severe morning sickness. On the PHD, I had almost none!

In an email she gave further details:

My husband and I have a reality show that recently started airing [insert joke here about what we may have done to be deemed “reality show material”], and when the episodes air I’ve been engaging with fans on social media. One of the most common responses I get is that people are shocked that I look so healthy, since I’m pregnant with my sixth child in eight years. A lot of people just assume that women who have many and/or closely spaced pregnancies simply have to be overweight.

I used to assume that too. In fact, that had been my personal experience: I seemed to add a few pounds with each pregnancy, and after I had my fifth child I found myself tired, achy, and 35 pounds overweight. Thanks to the PHD I lost all the weight, and when the show was filmed, in my first trimester of pregnancy with my sixth child, I weighed the same as I did the day I got married, and felt better than I ever had in my life. A lot of people who watched the show asked me what my secret was, and of course I directed them to the PHD!

Here’s the first episode of Jennifer’s reality show:

She does indeed look healthy, energetic, and more than a match for a Texas scorpion!

Conclusion

I mentioned the other day that we got a 4* review at Amazon:

This diet has controlled my cravings. After almost 40 years of interest in and great benefits from proper nutrition, I believe this is as close to perfect eating as we can get…. I didn’t give it 5 stars for two reasons: 1. no recipes…but can get those online and 2. very technical, leaving more explanation or clarification.

That about covers the pros and cons of our book as a weight loss guide. Our story isn’t quite as simple as the other diet books. Perfect Health Diet doesn’t resemble a Hollywood action movie.

But if you want to understand the science and find a successful program for long-term weight loss, we’re the best choice on the market. Perfect Health Diet will eliminate cravings and hunger, get you close to perfect eating, and help you normalize weight for the rest of your life.